An executive project dashboard is a powerful tool that gives you, as a business leader, a real-time, unified view of key project metrics, helping you track progress, spot issues, and align strategy across your organization. When you use executive dashboards, you unlock faster access to business data, which means you answer critical questions without delay. You gain improved accuracy, so your projections become more reliable. You also build confidence in every decision, reducing guesswork and making your leadership more effective.
Executive dashboards bridge the gap between raw data and strategic action. As a leader, you rely on real-time insights to respond to business challenges. These dashboards empower you to focus on what matters most for your business and your projects.
| Benefit of Executive Dashboards | Impact on Decision-Making |
|---|---|
| Faster data access | Reduces time to answer critical questions |
| Improved accuracy | Enhances reliability of projections |
| Increased confidence | Reduces guesswork in strategic decisions |
You see how executive dashboards transform your project oversight, supporting better decision-making and driving business success.
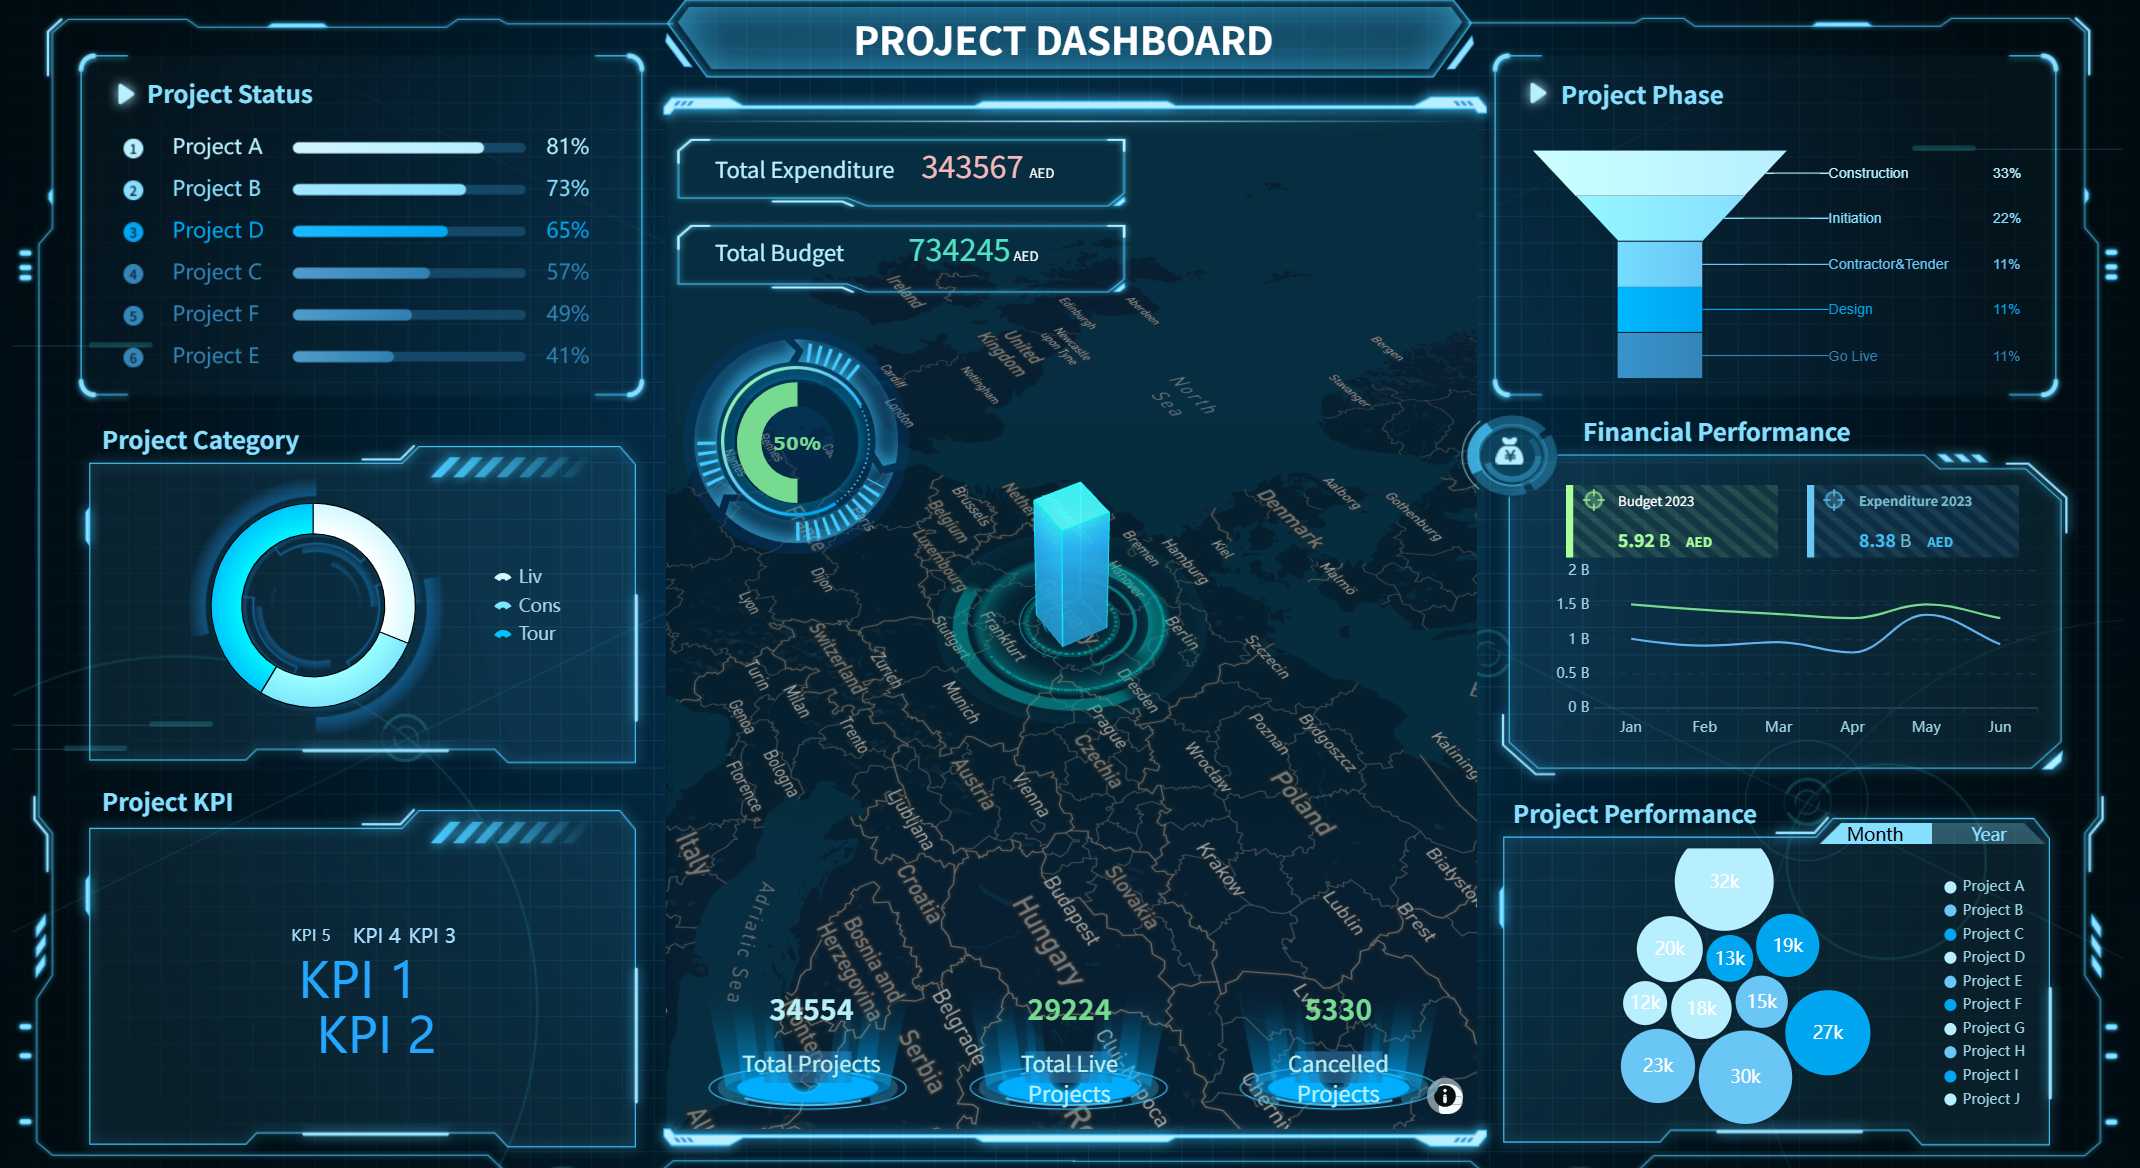
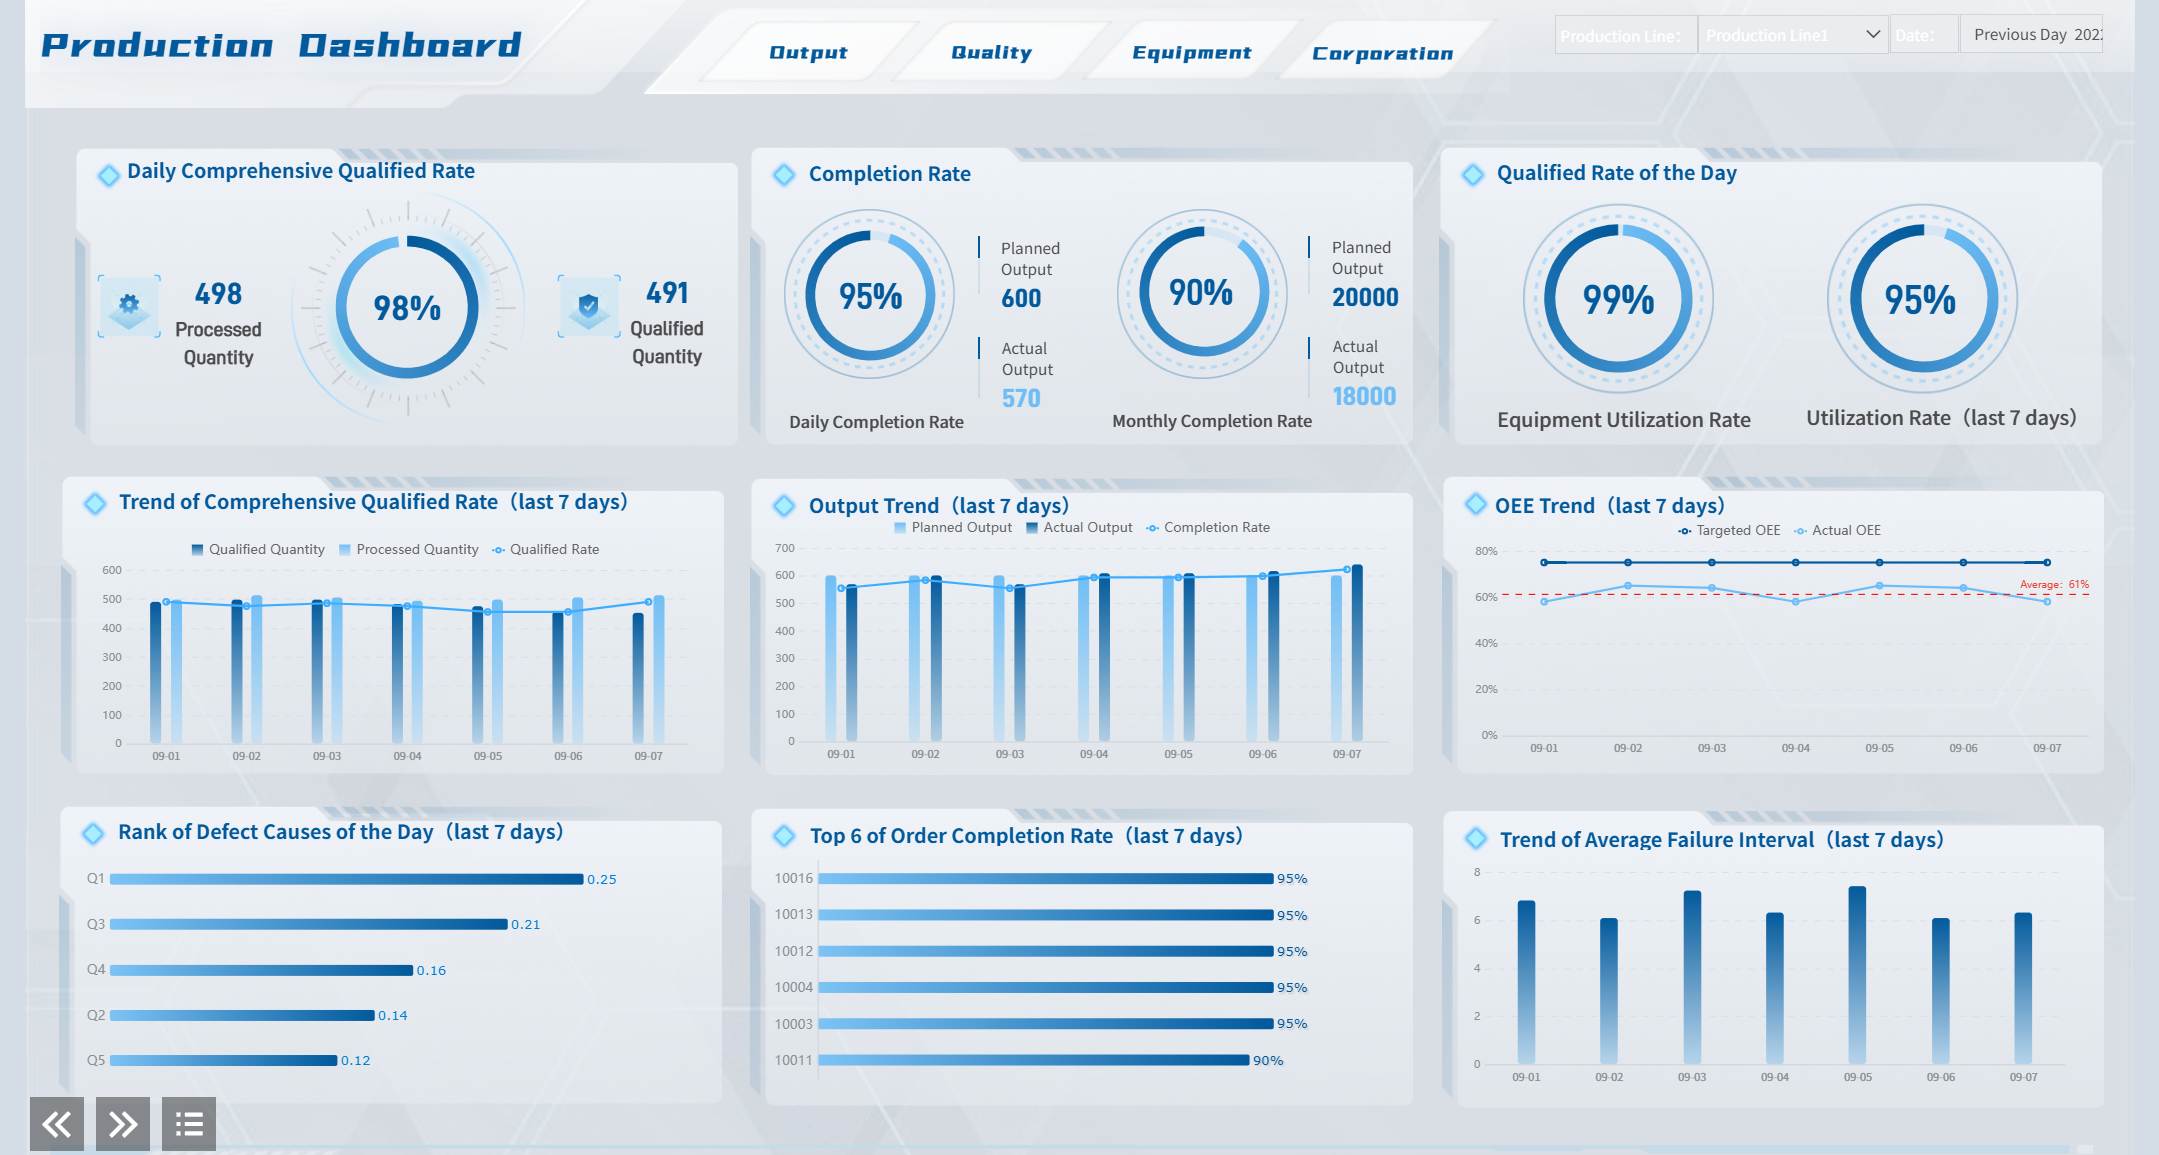
An executive project dashboard gives you, as a business leader, a centralized view of real-time project data, integrating multiple sources to deliver actionable insights that drive strategic decisions, improve oversight, and align your teams with organizational goals.
You need clear, up-to-date information to lead effectively. Executive dashboards deliver this by unifying diverse project management tools and data sources into one centralized view. This integration means you see every critical metric in real time, from project progress to resource allocation. FineReport excels here, connecting seamlessly to databases, spreadsheets, and external systems, so you always have the latest data at your fingertips.

Transparency in project management builds trust and improves decision-making. When you use a dashboard, you create open communication channels that align stakeholders and reduce risks.
Many organizations report measurable improvements after adopting executive dashboards. You gain real-time visibility into budgets, timelines, and performance metrics. Accountability increases because everyone knows who owns each action and deadline. Operational efficiency rises as reporting becomes faster and more aligned with your strategic goals.
| Improvement Type | Description |
|---|---|
| Real-time visibility | Dashboards provide interactive, visual tools for tracking projects, budgets, and performance metrics in real time. |
| Accountability | Clarity on actions, owners, and deadlines enhances accountability among team members. |
| Operational efficiency | Agencies report faster reporting and better alignment between strategic objectives and daily work. |
| Enhanced decision-making | Leadership can make data-driven decisions without waiting for quarterly reports. |
FineReport’s dashboard reporting features let you customize views for different roles, ensuring that executives, managers, and team members all see the information most relevant to them. This level of transparency supports better executive reporting and helps you maintain control over complex projects.
Traditional reporting often leaves you reacting to problems after they escalate. Executive dashboards change this by providing real-time updates and predictive analytics. You can spot issues early, validate project performance instantly, and respond before small problems become major setbacks.
| Feature/Benefit | Executive Dashboards | Traditional Reporting |
|---|---|---|
| Data Update Frequency | Real-time data updates | Static data with delayed updates |
| Predictive Analytics | Anticipates future issues and risks | Summarizes current status only |
| Decision-Making Support | Informed, high-impact decisions | Often lacks timely insights |
| Resource Allocation | Immediate response to changes | May lead to delays in addressing issues |
| Early Warning System | Detects issues before they escalate | Issues may go unnoticed until too late |
With FineReport, you receive threshold-based alerts and automated notifications. This means you can act quickly, reallocating resources or adjusting timelines as needed. You no longer need to wait for weekly or monthly executive reporting cycles. Instead, you make decisions based on the most current data, improving business performance and reducing risk.

Executive dashboards play a vital role in aligning your project execution with your organization’s strategic goals. When you use a dashboard, you ensure that every department and team member works toward the same objectives. This centralized view fosters collaboration, breaks down silos, and keeps everyone focused on what matters most.
Alignment facilitates more effective cooperation, communication, and execution across business units, departments, and teams.
Organizations that use advanced executive dashboards see significant improvements. Delivery success rates rise by 35%. Decision latency drops by up to 60%. Leaders report a 25% improvement in goal alignment scores. Visual portfolio insights help you decide four to six times faster, and on-time completion improves by 27%. FineReport’s real-time integration and customizable dashboard reporting features make it easier for you to track progress, monitor adoption, and ensure that every project supports your strategic direction.

You need to make decisions quickly and accurately. FineReport gives you real-time data access, so you always see the latest project updates. This feature lets you monitor business performance metrics and key performance indicators without delay. You can view dashboards that update instantly, helping you respond to changes as they happen. The drag-and-drop design makes it easy to build executive dashboards that show the most important insights for your business.

| Impact of Real-Time Data Access | Description |
|---|---|
| Immediate decision-making | You act on the latest available data. |
| Accurate executive reporting | You base decisions on precise, actionable insights. |
| Enhanced intelligence | AI-driven analytics improve your business strategy. |
Every business has unique goals. FineReport lets you customize KPIs and metrics on your executive dashboard. You can track what matters most for your project, from sales to resource allocation. Custom dashboards give you a one-page overview for board meetings or daily check-ins. KPI dashboards transform how you monitor performance, making it easier to spot trends and take action.

| KPI Template | Benefits |
|---|---|
| Executive Dashboard | One-page overview for fast insights in meetings. |
| KPI Dashboards | Visualizes critical metrics, enabling instant decision-making. |
You want to stay ahead of problems before they grow. FineReport’s executive dashboards use predictive analytics to forecast project outcomes. You can see real-time insights into project health, anticipate risks, and optimize resource allocation. Predictive analytics help you compare planned versus actual performance, so you can adjust your strategy with confidence.
| Benefit | Description |
|---|---|
| Improved Visibility | Real-time insights into project health for proactive management. |
| Enhanced Decision-Making | Data-driven choices reduce reliance on incomplete reports. |
| Proactive Risk Management | Early warnings allow timely interventions. |
| Optimized Resource Allocation | Forecasts bottlenecks and prevents team burnout. |
| Predicting Overruns | Analyzes costs and timelines for accurate forecasting. |
You need all your data in one place. FineReport integrates with databases, ERP, CRM, IoT, and cloud services. This unified platform brings together information from every part of your business. You can create self-service dashboards using a simple drag-and-drop interface. Real-time data synchronization ensures your executive dashboard always reflects the latest updates. Seamless integration supports comprehensive dashboard reporting and gives you a complete view of your business.

| Feature | Description |
|---|---|
| Unified Platform | Combines multiple data sources for a single executive dashboard. |
| Real-time Data Synchronization | Updates dashboards instantly for timely insights. |
| Self-service Dashboards | Lets you build reports independently with drag-and-drop tools. |
| Seamless Data Integration | Connects databases, ERP, CRM, IoT, and cloud for full business visibility. |
FineReport empowers you to make smarter decisions by giving you the tools to visualize, analyze, and act on your business data—all in one executive project dashboard.
An executive project dashboard is a centralized platform that gives you, as a leader, a real-time overview of project status, performance metrics, and strategic alignment, helping you make informed decisions quickly and confidently.
You need to see the big picture and the details. An executive dashboard brings all your project data together in one place. You can monitor project success by tracking key performance metrics, reviewing project history, and seeing future projections. This tool helps you improve team processes and leadership strategies by highlighting issues early.
With an executive dashboard, you gain:
You can use these insights to make data-driven decisions that keep your projects on track and aligned with your strategic goals.
| Benefit | Description |
|---|---|
| Centralized insights | All critical data is displayed in one place, providing a clear overview without separate reports. |
| Faster decision-making | Real-time updates allow you to identify risks and opportunities immediately. |
| Improved accountability | Connects performance metrics with responsible teams, fostering ownership of results. |
| Enhanced project tracking | Monitors milestones and budgets to ensure projects stay on track. |
| Data-driven storytelling | Transforms raw data into visual reports for better communication and transparency. |
| Strategic alignment | Ensures operational efforts support long-term business goals. |
You face risks in every project. Executive dashboards give you a centralized view of risk metrics, making it easier to spot hidden risks and act quickly. You can see where to focus your time, budget, and personnel for the best results. By bringing together data from different project management tools, you uncover trends and make smarter choices.
This approach leads to better business performance and supports your strategic objectives.
You can see the power of executive dashboards in action with the Abu Dhabi Projects and Infrastructure Centre (ADPIC). ADPIC manages large government projects and needed a way to improve oversight and strategic planning. By using FineReport, ADPIC created a CXO dashboard that delivered executive-level insights in real time.
With FineReport, ADPIC:
This transformation helped ADPIC align projects with strategic goals, ensure quality, and boost efficiency. You can apply the same approach to your organization, using executive dashboards to drive informed decision-making and achieve your business objectives.
You want your executive dashboard to deliver reliable insights. Many organizations struggle with data misrepresentation, information overload, and lack of context. These issues can lead to poor business decisions. FineReport addresses these challenges by offering robust data entry, validation checks, and optimized performance for large datasets. The table below shows how FineReport supports data accuracy and consistency:
| Feature | Description |
|---|---|
| Robust Data Entry | Allows easy addition, deletion, or modification of data on various devices. |
| Validation Checks | Ensures data accuracy by checking for errors during data entry. |
| Optimized for Large Datasets | Efficiently handles extensive datasets, maintaining performance and accuracy. |

To ensure your executive dashboards remain accurate, follow these executive dashboard best practices:
You may face resistance when introducing new executive dashboards. Design complexity, limited navigation, and lack of personalization can slow adoption. To overcome these challenges, involve end users in the design process and provide training programs. FineReport enables you to create personalized dashboards that fit your executive needs. Use digital adoption platforms and maintain a feedback loop to refine your dashboard. Start with a core user group, add features gradually, and hold regular check-ins to ensure the dashboard supports your business.

You want your executive dashboard to drive better business performance. A well-designed dashboard provides more visibility, greater accuracy, and faster decisions. FineReport consolidates important data, helping you avoid information overload and reduce mistakes. You gain quick access to key metrics, which allows you to guide your team and improve efficiency.
| Benefit | Description |
|---|---|
| More visibility | Clear insights into business aspects without overwhelming data. |
| Greater accuracy | Objective insights reduce guesswork in decision-making. |
| Faster decisions | Immediate action on real-time insights prevents issues from escalating. |
| Better performance | Quick access to key metrics improves efficiency. |
| Fewer mistakes | Consolidated data reduces risk of misinterpretation. |
Executive dashboards help you maintain awareness of organizational performance and identify areas for improvement, saving time and supporting your business goals.
An executive project dashboard is a real-time platform that gives you, as a leader, a clear view of project status, key metrics, and strategic alignment, helping you make better decisions every day.
You gain enhanced decision-making when you use dashboards like FineReport. Real-time insights let you act quickly, spot trends, and improve efficiency. Business leaders see faster responses to challenges and better results. Dashboards link projects, budgets, and strategy, so you optimize resources and align your team with long-term goals.
| Evidence | Explanation |
|---|---|
| Dashboards need to be linked contextually rather than presented independently. | This ensures that decisions are made with a holistic view of the organization, optimizing overall performance rather than functioning in silos. |
| Strategy should be at the core of every major business decision. | Long-term strategies provide a framework for evaluating operational metrics, ensuring that organizations are aligned with their strategic goals. |
| Projects and budgets must be linked to dashboards. | This connection ensures that resources are allocated effectively in line with strategic objectives, enhancing long-term business value. |
| Management insight is crucial for effective decision-making. | Understanding the broader context of data allows leaders to make informed decisions that align with long-term goals. |
| Understanding cause and effect relationships is essential. | This knowledge helps management anticipate challenges and proactively address them, rather than reacting to issues as they arise. |
Recent studies show that dashboards help you reduce time spent on data gathering and interpretation. You can respond quickly to trends, align teams, and track progress. Real-time insights support agility and keep your business on track.
Tip: When you evaluate dashboard tools, start with a clear purpose, select meaningful KPIs, and keep the design simple. Make sure your dashboard adapts to your changing needs.
What Is Project Dashboard and Why Does Your Business Need
Project Management Dashboards Explained for 2026
How to Build a Project Status Dashboard for Beginners

The Author
Lewis
Senior Data Analyst at FanRuan
Related Articles

Payment Analytics Dashboard: 12 KPIs Every Operations Leader Should Track to Cut Revenue Leakage
Losing revenue to declines? Discover 12 essential KPIs to track in your payment analytics dashboard to stop leakage and manage disputes.
Lewis Chou
May 05, 2026

SOC Dashboard Explained: 12 Essential KPIs, Views, and Workflows Security Teams Use
Learn about SOC dashboards, the 12 essential KPIs for security teams, and how they centralize alerts and workflows for faster threat detection and response.
Lewis Chou
May 05, 2026

EMR Dashboard Guide: 12 Metrics to Track for Faster Clinical and Operational Decisions
Learn the 12 essential EMR dashboard metrics to track for faster clinical and operational decisions, improving patient flow and revenue cycle management.
Lewis Chou
May 05, 2026


