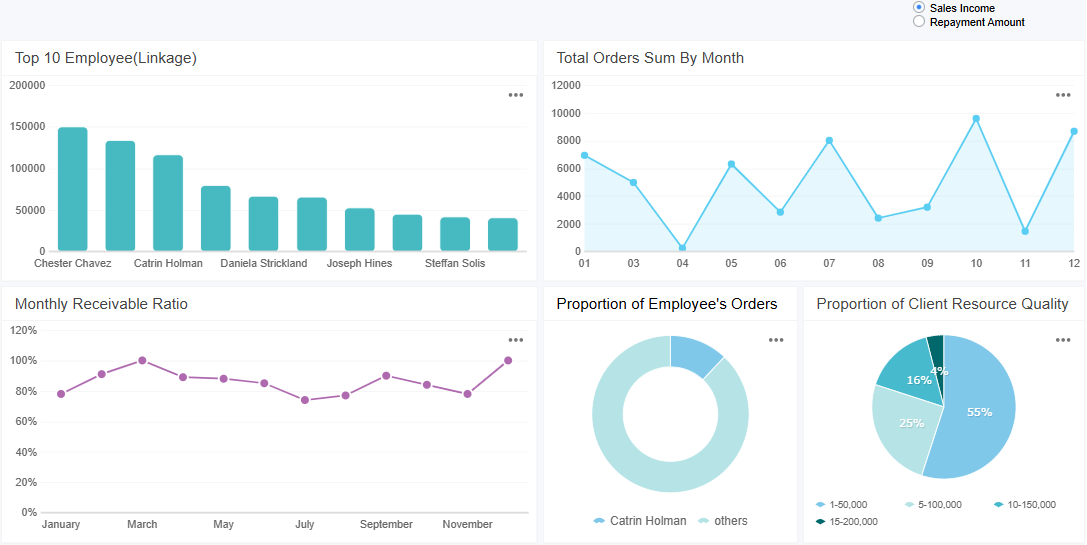
A sales reporting dashboard is a visual tool that displays your sales data and performance metrics in one place. You use a sales dashboard to track progress, monitor trends, and identify opportunities for improvement. This dashboard gives you instant access to reporting insights that help you make smart business decisions.
Sales teams benefit from real-time insights, which boost accountability and reveal trends or bottlenecks. For example, monitoring win rates and activity levels lets you adjust your strategy and improve results. Many businesses, from large enterprises to smaller organizations, rely on dashboards to drive efficiency and transparency. FineReport stands out as a solution that empowers you with data-driven sales management.
What is a Sales Reporting Dashboard?

Definition and Core Purpose
A sales reporting dashboard is a centralized platform that displays your sales data in a visual format. You use this dashboard to track performance, monitor activities, and analyze trends in real time. The dashboard brings together key metrics, giving you a clear overview of your sales operations. You can see how your team performs, identify strengths, and spot areas that need improvement.
Industry experts define a sales dashboard as a visual representation of sales data. It serves as a strategic tool for tracking performance and activities. You can find common metrics such as closed business, sales volume, lead conversion rates, pipeline data, and activity by sales representative. Sales managers and individual sales reps rely on dashboards to prioritize tasks and monitor progress. The dashboard uses real-time data, reflecting changes immediately as activities are logged in your CRM.
Here is a summary of the formal definition and core aspects of a sales dashboard:
| Aspect | Description |
|---|---|
| Definition | A sales dashboard is a visual representation of sales data. |
| Purpose | Used for tracking performance and activities in real time. |
| Common Metrics | Includes closed business, sales volume, lead conversion rates, pipeline data, and activity by sales rep. |
| Users | Sales managers and individual sales reps utilize dashboards for performance tracking and task prioritization. |
| Data Type | Utilizes real-time data reflecting changes immediately as activities are logged in the CRM. |
The primary objectives of implementing a sales reporting dashboard in your organization include enhancing sales performance, improving decision-making, and maximizing sales opportunities. You gain real-time visibility into sales activities, which helps you make smarter decisions. The dashboard allows you to monitor individual and team performance, ensuring accurate sales forecasting and aligning team objectives.
| Objective/Purpose | Description |
|---|---|
| Enhance sales performance | A dashboard acts as a strategic tool that improves overall sales performance and identifies growth opportunities. |
| Improve decision-making | By providing real-time visibility into sales activities, businesses can make smarter, data-driven decisions. |
| Maximize sales opportunities | Real-time updates allow teams to adjust strategies quickly, ensuring that every sales opportunity is utilized. |
| Monitor individual and team performance | Dashboards provide visibility into each rep’s productivity, helping managers identify strengths and areas for improvement. |
| Ensure accurate sales forecasting | By tracking historical trends and pipeline movement, dashboards help predict revenue with greater confidence. |
| Align team objectives | A centralized platform ensures that all team members are working towards the same goals and sharing insights. |
A sales reporting dashboard gives you the ability to see the big picture and the details at the same time. You can track sales targets, measure progress, and respond quickly to changes in the market. The dashboard helps you stay focused on your goals and supports continuous improvement.
How a Sales Reporting Dashboard Works
You interact with a sales dashboard by viewing real-time data that updates as new information enters your system. The dashboard centralizes data, ensuring that everyone in your team makes decisions based on the same information. You can filter data to focus on specific metrics or time periods. The dashboard aggregates data, providing summarized insights that are crucial for analysis. You also benefit from data enrichment, which combines various sources to give you a comprehensive view of sales performance.
- Sales dashboards centralize data, ensuring all users make decisions based on the same information.
- They facilitate data filtering, allowing users to focus on specific metrics or time periods.
- Dashboards aggregate data, providing summarized insights that are crucial for analysis.
- Enrichment of data combines various sources to provide a comprehensive view of sales performance.
The process typically follows these steps:
- Data is filtered to remove irrelevant information, allowing for targeted analysis.
- Aggregation of data is performed to summarize key metrics, essential for effective reporting.
- Data enrichment combines different datasets to enhance the context and insights derived from the sales data.
A sales reporting dashboard connects to live data sources, ensuring that the information you see is current and accurate. This capability allows you to respond quickly to changes in sales performance and market conditions. You gain agility and confidence in your decision-making.
FineReport stands out as an enterprise-level tool for creating sales reporting dashboards. You can integrate multiple data sources and visualize sales data in real time. FineReport empowers you to build dashboards that support your sales strategy and drive business growth.
Why You Need a Sales Reporting Dashboard
Key Benefits for Sales Teams
You need a sales dashboard to transform how your team works. With a sales reporting dashboard, you gain instant access to real-time data, which helps you make quick decisions and respond to changes in the market. You see which campaigns generate the most leads and which activities drive sales. This visibility allows you to focus on strategies that work and adjust those that do not.
Sales dashboards eliminate hours spent on manual reporting and data entry. You free up time for your team to concentrate on selling and building customer relationships. Customizable views let each sales rep track their own progress, align daily activities with business objectives, and monitor key metrics such as conversion rates and pipeline growth. Enhanced visibility fosters collaboration across departments, breaking down information silos and improving teamwork.
Tip: Use your sales dashboard to set clear goals and track progress toward incentives. This motivates your team and keeps everyone focused on targets.
| Evidence Description | Impact on Productivity and Efficiency |
|---|---|
| Sales reps perform better when they can see which campaigns generate the most leads | Increases awareness of effective strategies, leading to better performance |
| Customized dashboards allow reps to see how daily activities drive sales | Enhances focus on key activities, improving efficiency |
| Dashboards eliminate hours spent on manual data entry and reporting | Frees up time for sales activities, boosting overall productivity |
| Self-monitoring of performance metrics by reps and managers | Facilitates timely adjustments to meet targets, enhancing effectiveness |
Impact on Business Growth
A sales reporting dashboard drives business growth by providing measurable improvements in key metrics. You can track monthly lead counts, conversion rates, and customer acquisition costs. After implementing a sales dashboard, businesses often see a significant increase in new customer revenue and a reduction in operational costs.
| Metric | Before Implementation | After Implementation | Change |
|---|---|---|---|
| Monthly Lead Count | 35 | 53 | +52% |
| Lead-to-Customer Conversion Rate | 20% | 24% | +4% |
| Customer Acquisition Cost | €2,875 | €2,240 | -22% |
| Monthly New Customer Revenue | N/A | N/A | +73% |
| ROI of Dashboard Implementation | N/A | N/A | 485% |
Sales dashboards support continuous improvement by enabling you to analyze results, track trends, and conduct variance analysis. In manufacturing, for example, you can use a sales performance dashboard to automate data collection, monitor live metrics, and identify bottlenecks. This approach aligns with the PDCA cycle, helping you plan, check, and act on sales data for ongoing improvement.
FineReport enhances these benefits by automating reporting, improving transparency, and supporting continuous improvement. Companies like Kintetsu have used FineReport to integrate multiple data sources, create real-time dashboards, and streamline their sales reporting process. As a result, they improved operational efficiency and gained a comprehensive view of customer interactions.

Key Sales Reporting Dashboard Metrics and Features
Essential Sales Metrics to Track
You need to track the right sales metrics to get the most value from your sales dashboard. High-performing teams focus on metrics that predict outcomes and drive success. The most critical sales metrics include outreach activity, pipeline health, revenue generation, customer retention, sales cycle length, and win rate. These metrics help you measure both the quantity and quality of your sales efforts.
| Metric | Description |
|---|---|
| Outreach Activity | Measures the volume of sales outreach efforts made by the team. |
| Pipeline Health | Assesses the status and quality of leads in the sales pipeline. |
| Revenue Generation | Tracks the total revenue generated from sales activities. |
| Customer Retention | Evaluates the ability to retain customers over time. |
| Sales Cycle Length | Measures the average time taken to close a sale. |
| Win Rate | Indicates the percentage of deals won compared to opportunities. |
You should also monitor total pipeline value, number of open opportunities, average deal size, and lead response times. These metrics give you a clear view of your sales performance and help you identify areas for improvement.
Customization and Visualization Options
A sales dashboard must adapt to your unique business needs. You can customize the layout, select key performance indicators, and match your branding. A user-friendly design makes it easy for you and your team to navigate and understand the data. Many organizations use dashboards to consolidate metrics into visual formats that reveal patterns and guide decision-making.
Mobile access is essential. You can check your sales dashboard from any device, which means you stay informed wherever you are. Real-time data access lets you make decisions quickly and respond to changes in the field. This flexibility improves sales team responsiveness and customer engagement.
FineReport’s Advanced Features
FineReport offers advanced features that set it apart from other tools. You can use a drag-and-drop interface to create reports and dashboards without coding. Real-time reporting ensures you always see the latest sales data. FineReport supports mobile accessibility, so you can view your sales dashboard on any device.
You can integrate multiple data sources into one dashboard, which gives you a complete view of your sales operations. FineReport provides a wide variety of built-in charts and 3D maps, making your sales performance dashboard more interactive and insightful. Customizable templates help you design dashboards that fit your business goals.

Setting Up Your Sales Reporting Dashboard
Basic Steps to Implementation
You can set up a sales reporting dashboard by following a clear process. Begin by defining your vision for how advanced analytics and interactive dashboards will support your sales team. Secure executive buy-in to ensure you have the resources needed for success. Engage stakeholders early by sharing previews of the dashboard, which builds confidence and encourages feedback. Pilot the dashboard with a small group of users to gather insights and refine the product. Finally, roll out the dashboard to your entire sales team and provide comprehensive training.
Here is a step-by-step guide:
- Articulate your vision for actionable sales insights.
- Gain executive buy-in for funding and resources.
- Engage stakeholders with dashboard previews.
- Pilot the dashboard with select users.
- Roll out and train your sales team.
You should also prepare for business change by defining your strategy and establishing the right metrics. Involve users at all levels to ensure acceptance and use simple development tools for quick dashboard creation. Validate your data and remain open to new discoveries during development. Remember, implementing a sales reporting dashboard is a journey that evolves over time.
Choosing FineReport for Sales Dashboards
FineReport offers a professional solution for building your sales dashboard. Its drag-and-drop interface makes designing dashboards easy, even for users without technical backgrounds. You can visualize sales data in real time and analyze trends quickly. FineReport supports integration with multiple data sources, which is essential for medium to large enterprises. The platform enables you to create a sales performance dashboard that helps your team make informed decisions and drive results.
Overcoming Common Challenges
When you set up a sales reporting dashboard, you may face several challenges. Data quality issues can affect the accuracy of your sales insights. System complexity and data latency may slow down dashboard performance. Security concerns and the need for effective data governance are also common. You might need to handle different data formats and manage large volumes of sales data.
To increase user adoption, focus on user-centered design. Organize dashboards logically and use clear naming conventions. Limit dashboard creation to designated team members to maintain quality. Conduct user acceptance testing to ensure the dashboard meets your team's needs. Encourage power users to champion the platform and share their experiences with others. Embed key sales reports in accessible locations so your team can find important information quickly.
You gain several advantages when you adopt a sales reporting dashboard.
- Access real-time data for immediate strategy adjustments.
- Explore your sales data deeply to uncover trends and anomalies.
- Improve your bottom line by turning insights into action.
| Benefit | Contribution to Sales Performance and Growth |
|---|---|
| Improved forecast accuracy | Predict revenue more reliably by tracking key sales KPIs. |
| Stronger accountability | Ensure your team understands expectations and activities. |
| Faster deal progression | Remove bottlenecks and speed up the sales process. |
You also improve decision making, increase efficiency, and enhance customer service. FineReport helps you build a dashboard that delivers these results and supports your business growth.

Continue Reading About Sales Reporting Dashboard
Best Dashboard Apps for Business Insights
What is a Call Center Dashboard and Why Does It Matter
What is a Reporting Dashboard and How Does it Work
What is An Interactive Dashboard and How Does It Work
What is a Call Center Metrics Dashboard and How Does It Work


FAQ

The Author
Lewis
Senior Data Analyst at FanRuan
Related Articles

How to Build an Investment Portfolio Reporting Dashboard for Executives: KPIs, Benchmarks, and Drill-Down Views
Investment portfolio reporting for executives is not about showing every holding, transaction, and chart your investment team can produce. It is about giving CEOs, CFOs, CIOs, boards, and investment committees a fast, re
Yida YIn
Jun 25, 2026

12 KPI Reporting Examples for Executive Dashboards: What to Show in Weekly, Monthly, and Quarterly Reviews
Executive leaders do not need more data. They need decision ready $1 examples that match how often they review the business and what actions they are expected to take. A weekly $1 should surface fast moving risks and per
Yida YIn
Jun 25, 2026

How to Build a Digital Marketing Reports Dashboard: Executive Examples, KPIs, and Templates
A $1 is the control layer that helps executives and marketing leaders turn scattered channel data into fast, confident decisions. If you are a CEO, CMO, operations director, or marketing analytics lead, the real problem
Yida Yin
May 07, 2026