A project management dashboard gives you a single place to view essential data, insights, and visuals that summarize your project portfolio, making it easy to track budgets, statuses, and tasks. You use a project dashboard to see real-time updates and monitor every aspect of your project. This tool turns scattered information into clear visuals, helping you make smart choices and keep your team aligned.
| Benefit | Description |
|---|---|
| Data-Driven Decision-Making | You get real-time KPIs and metrics for informed choices. |
| Increased Efficiency | The dashboard automates tracking and resource allocation. |
| Centralized Data | All project data stays in one accessible location for your team. |
| Continuous Data Updates | Real-time changes keep your project dashboard up to date. |
| Customization and Scalability | You can adjust your project dashboard as your needs change. |
| Enhanced Communication | Share project progress and updates with stakeholders clearly. |
Modern teams rely on dashboards like FineReport to boost collaboration, improve communication, and make better decisions. You gain practical benefits that help your organization stay responsive and competitive.
What Is a project management dashboard?
A project management dashboard is a digital workspace that gives you a real-time, visual summary of your project’s progress, key metrics, and team activities, helping you track goals, budgets, and deadlines in one place.
Core Definition and Purpose
You use a project dashboard to see everything about your project at a glance. This tool brings together data from different sources and turns it into easy-to-read visuals. You can check task statuses, see who is working on what, and monitor budgets without searching through emails or spreadsheets.
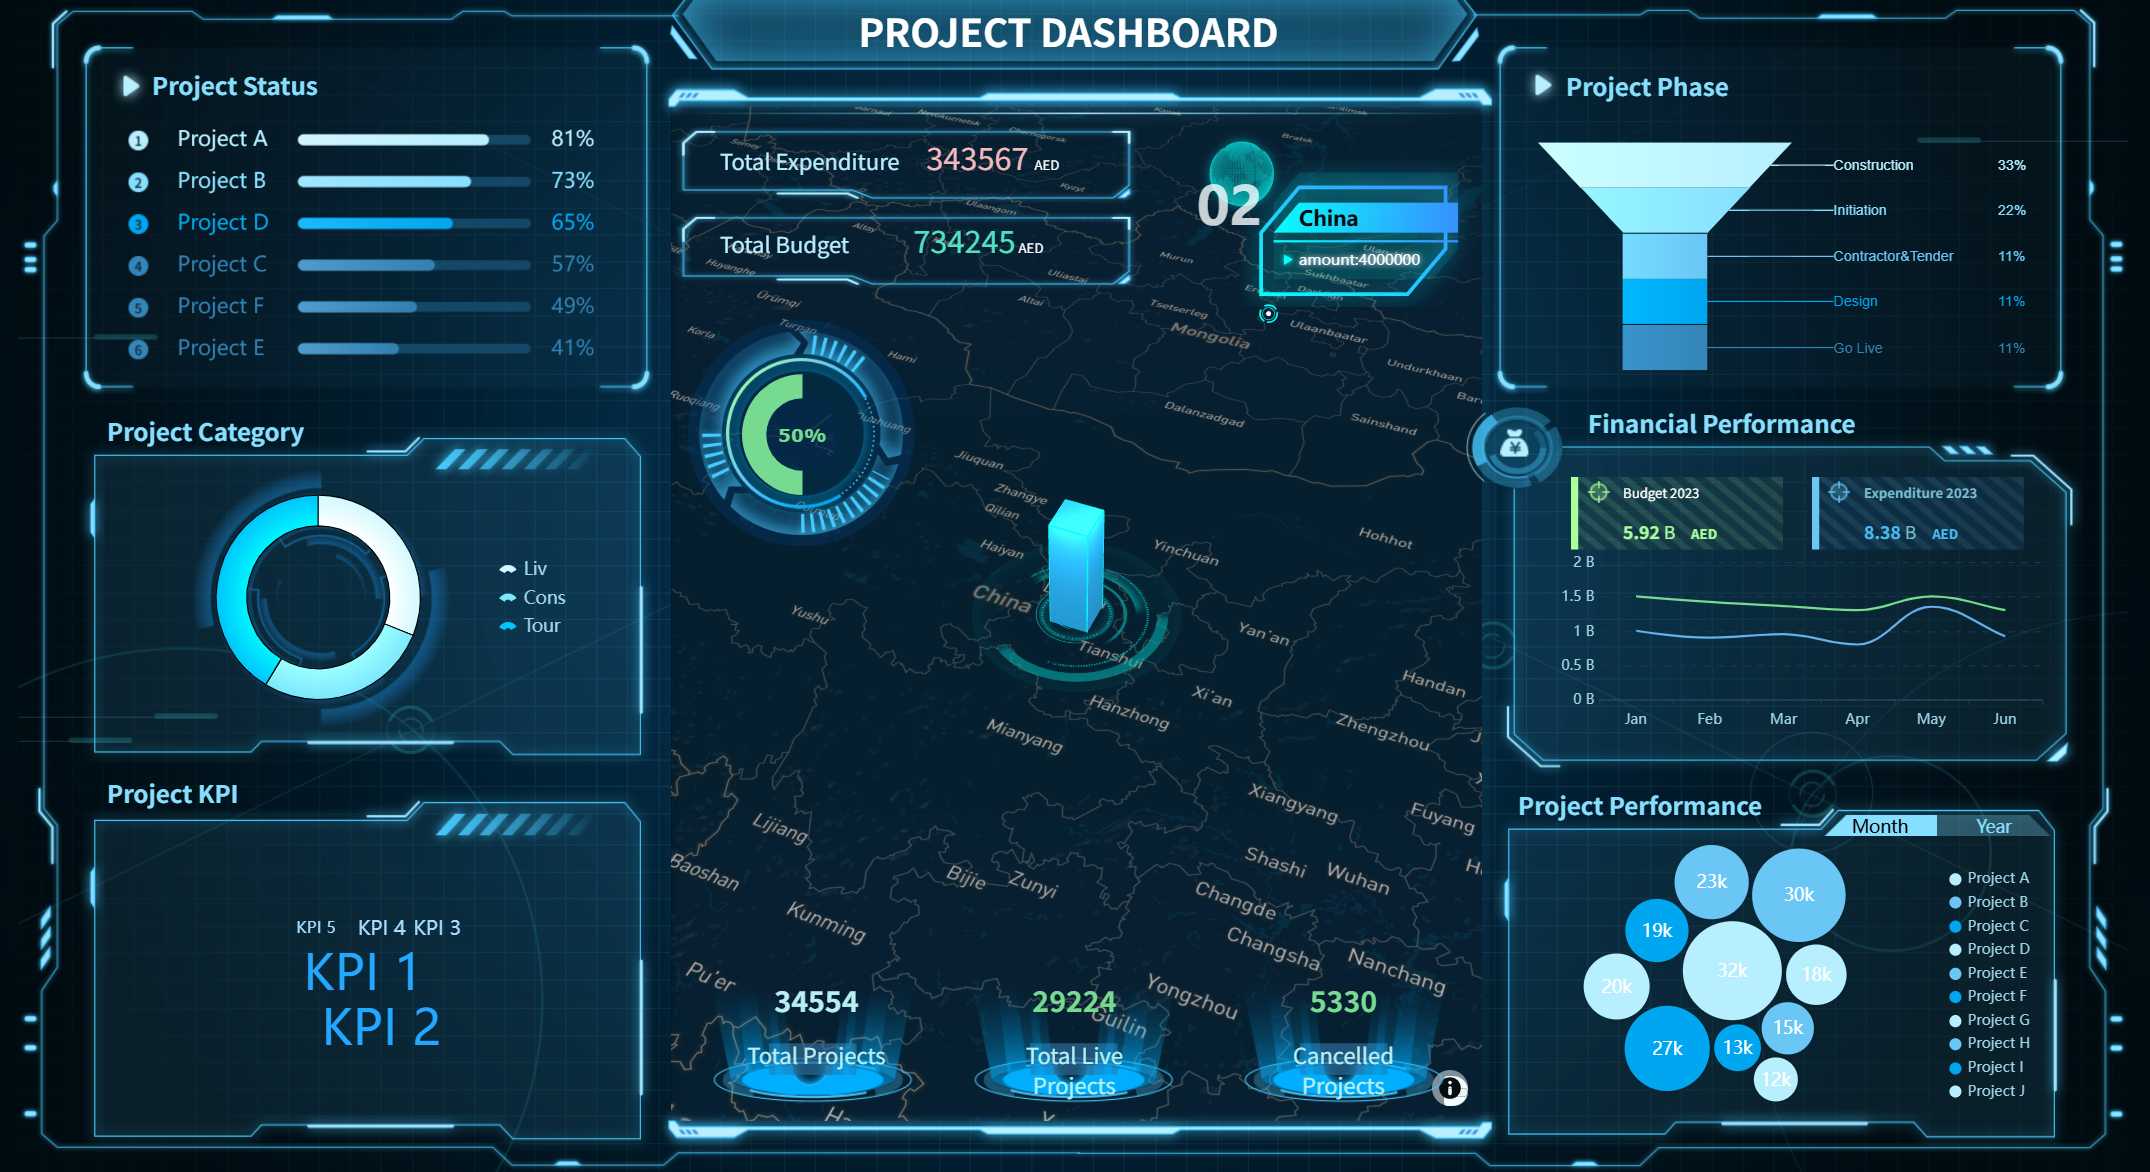
A project management dashboard helps you:
- Track project milestones and timelines.
- Monitor resource availability and workloads.
- Compare planned costs with actual spending.
- Identify risks and see solutions in action.
- Get real-time updates on project performance.
Tip: When you use a project dashboard, you make smarter decisions faster because you always have the latest information.
Here is a table showing what you can see in a project dashboard:
| Metric/Feature | Description |
|---|---|
| Task statuses and deadlines | Overview of current tasks and their deadlines. |
| Resource availability and workloads | Shows which team members are available and their workloads. |
| Financial performance | Compares budgeted costs against actual spending. |
| Project milestones and timelines | Highlights key milestones and completion dates. |
| Identified risks and solutions | Lists risks and strategies to manage them. |
| Real-time visual updates | Displays the latest project performance and deadlines. |
| Transparent financial tracking | Tracks budget status and spending. |
| Proactive risk management | Helps you resolve issues quickly to meet goals. |
How Project Dashboards Work
A project dashboard collects data from many sources and updates it in real time. You see charts, graphs, and tables that show your project’s health. You can spot problems early and adjust your plan before issues grow.
Most project dashboards connect to tools like scheduling software, financial systems, and databases. You might use:
- Scheduling tools for activity management.
- Financial systems for budget tracking.
- Central platforms for cost and performance data.
- Visualization tools for dynamic dashboards.
You also see data from:
- SQL or NoSQL databases
- APIs from third-party services
- Web analytics tools
- IoT devices
- Real-time data streams
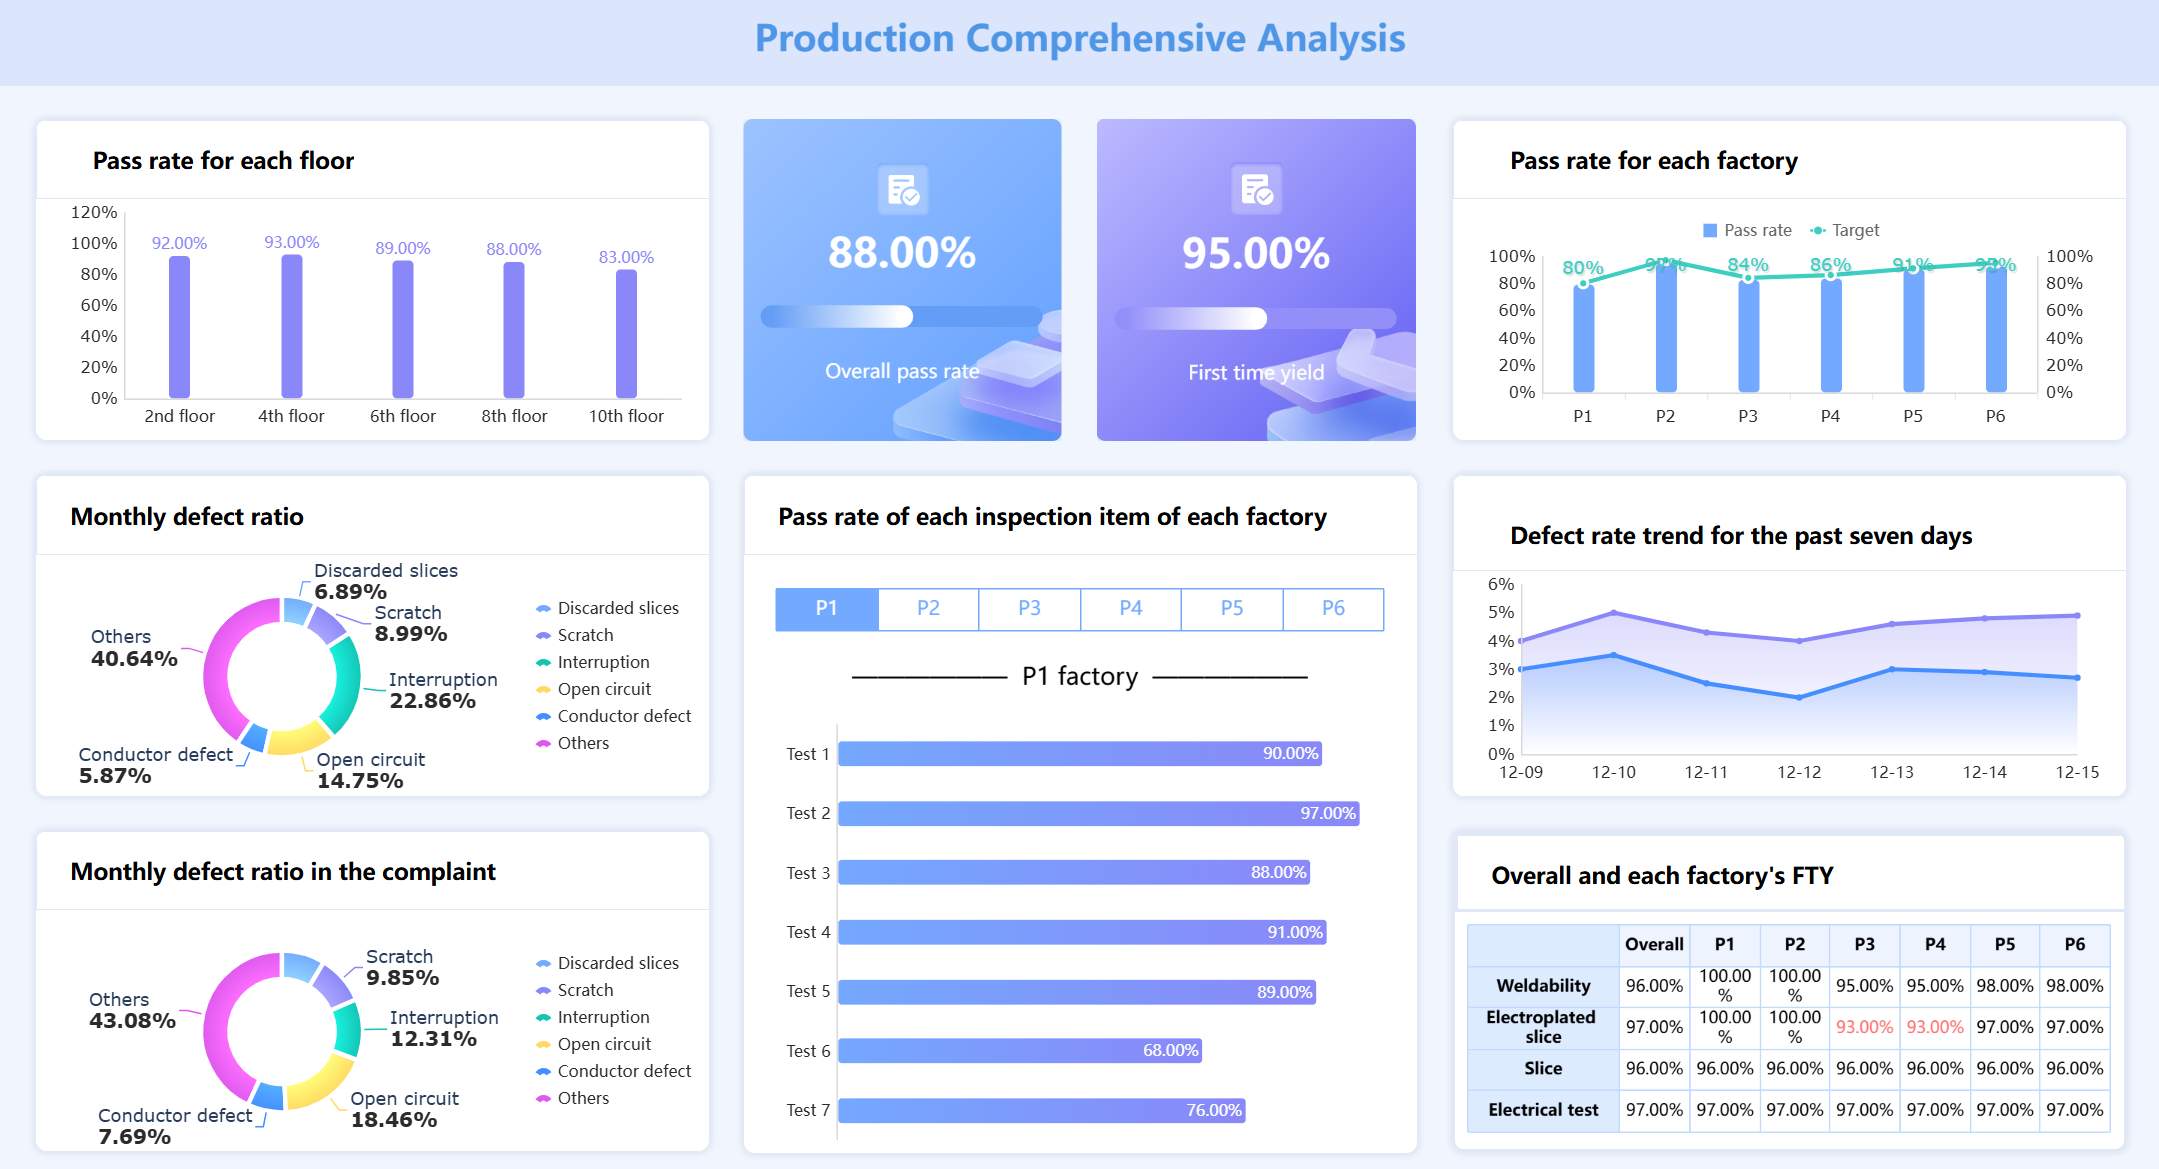
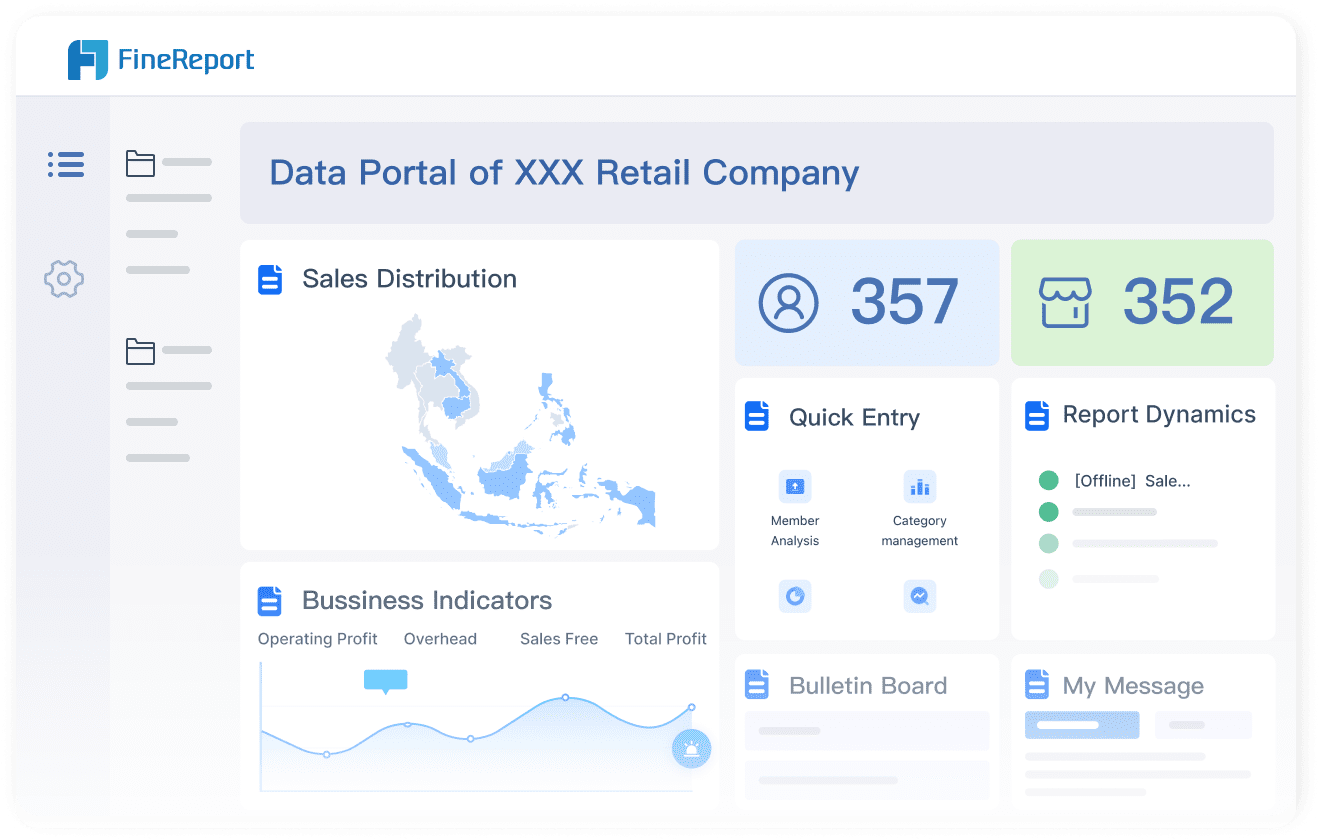
FineReport stands out as a modern project dashboard solution. You can integrate data from multiple sources, including databases, spreadsheets, and cloud services. FineReport’s drag-and-drop design lets you build dashboards quickly. You get real-time updates and interactive charts that help you understand your project’s status.
| Feature | Description |
|---|---|
| Data Integration | FineReport connects multiple data sources, keeping your project data unified. |

When you use FineReport, you create dashboards that show all your project details in one place. You can customize layouts, drill down into data, and share dashboards with your team. This approach keeps everyone informed and helps you reach your project goals.

Why Project Management Dashboards Matter
A project management dashboard is a digital tool that gives you a real-time, visual overview of your project’s progress, key metrics, and team activities in one place.
Key Benefits for Teams
You need a project dashboard to keep your team focused and your project moving forward. When you use a dashboard, you see project progress instantly. You track every milestone, task, and resource without searching through emails or spreadsheets. This visibility helps you spot issues early and adjust your plan before problems grow.
Project dashboards boost team collaboration. You share updates, assign tasks, and monitor project status together. Everyone sees the same information, so you avoid confusion and miscommunication. A Stanford study shows that collaboration can increase productivity by 50%. When you break down silos, your team shares knowledge and works toward the same goal.
Here are some ways a project dashboard helps your team:
- You get real-time feedback, so you adjust quickly and improve project outcomes.
- You see project progress and performance metrics, which keeps everyone aligned.
- You experience greater convenience and efficiency in daily work.
- You improve accuracy and communication across departments.
| Metric | Benefit |
|---|---|
| Goal attainment | 2x faster |
| Peer-to-peer recognition | 40% more |
| Burnout and disengagement | Noticeable drop |
You notice increased productivity when your team uses a project dashboard. Real-time insights allow you to respond to changes and keep your project on track. You also see more peer recognition and less burnout, which leads to better project performance.
Note: Enhanced project visibility means you always know your project status and can act before issues affect your progress.
Impact on Decision-Making
A project management dashboard transforms how you make decisions. You see key metrics and project progress in real time. Dashboards provide updates on project milestones, financial health, and resource allocation. You use data visualization to simplify complex information, making it easy for everyone to understand and act.
You identify and resolve problems quickly. Real-time visual data helps you spot delays, budget issues, or risks before they become major setbacks. You shift from reactive to proactive planning, using predictive analytics to anticipate challenges and adjust your strategy.
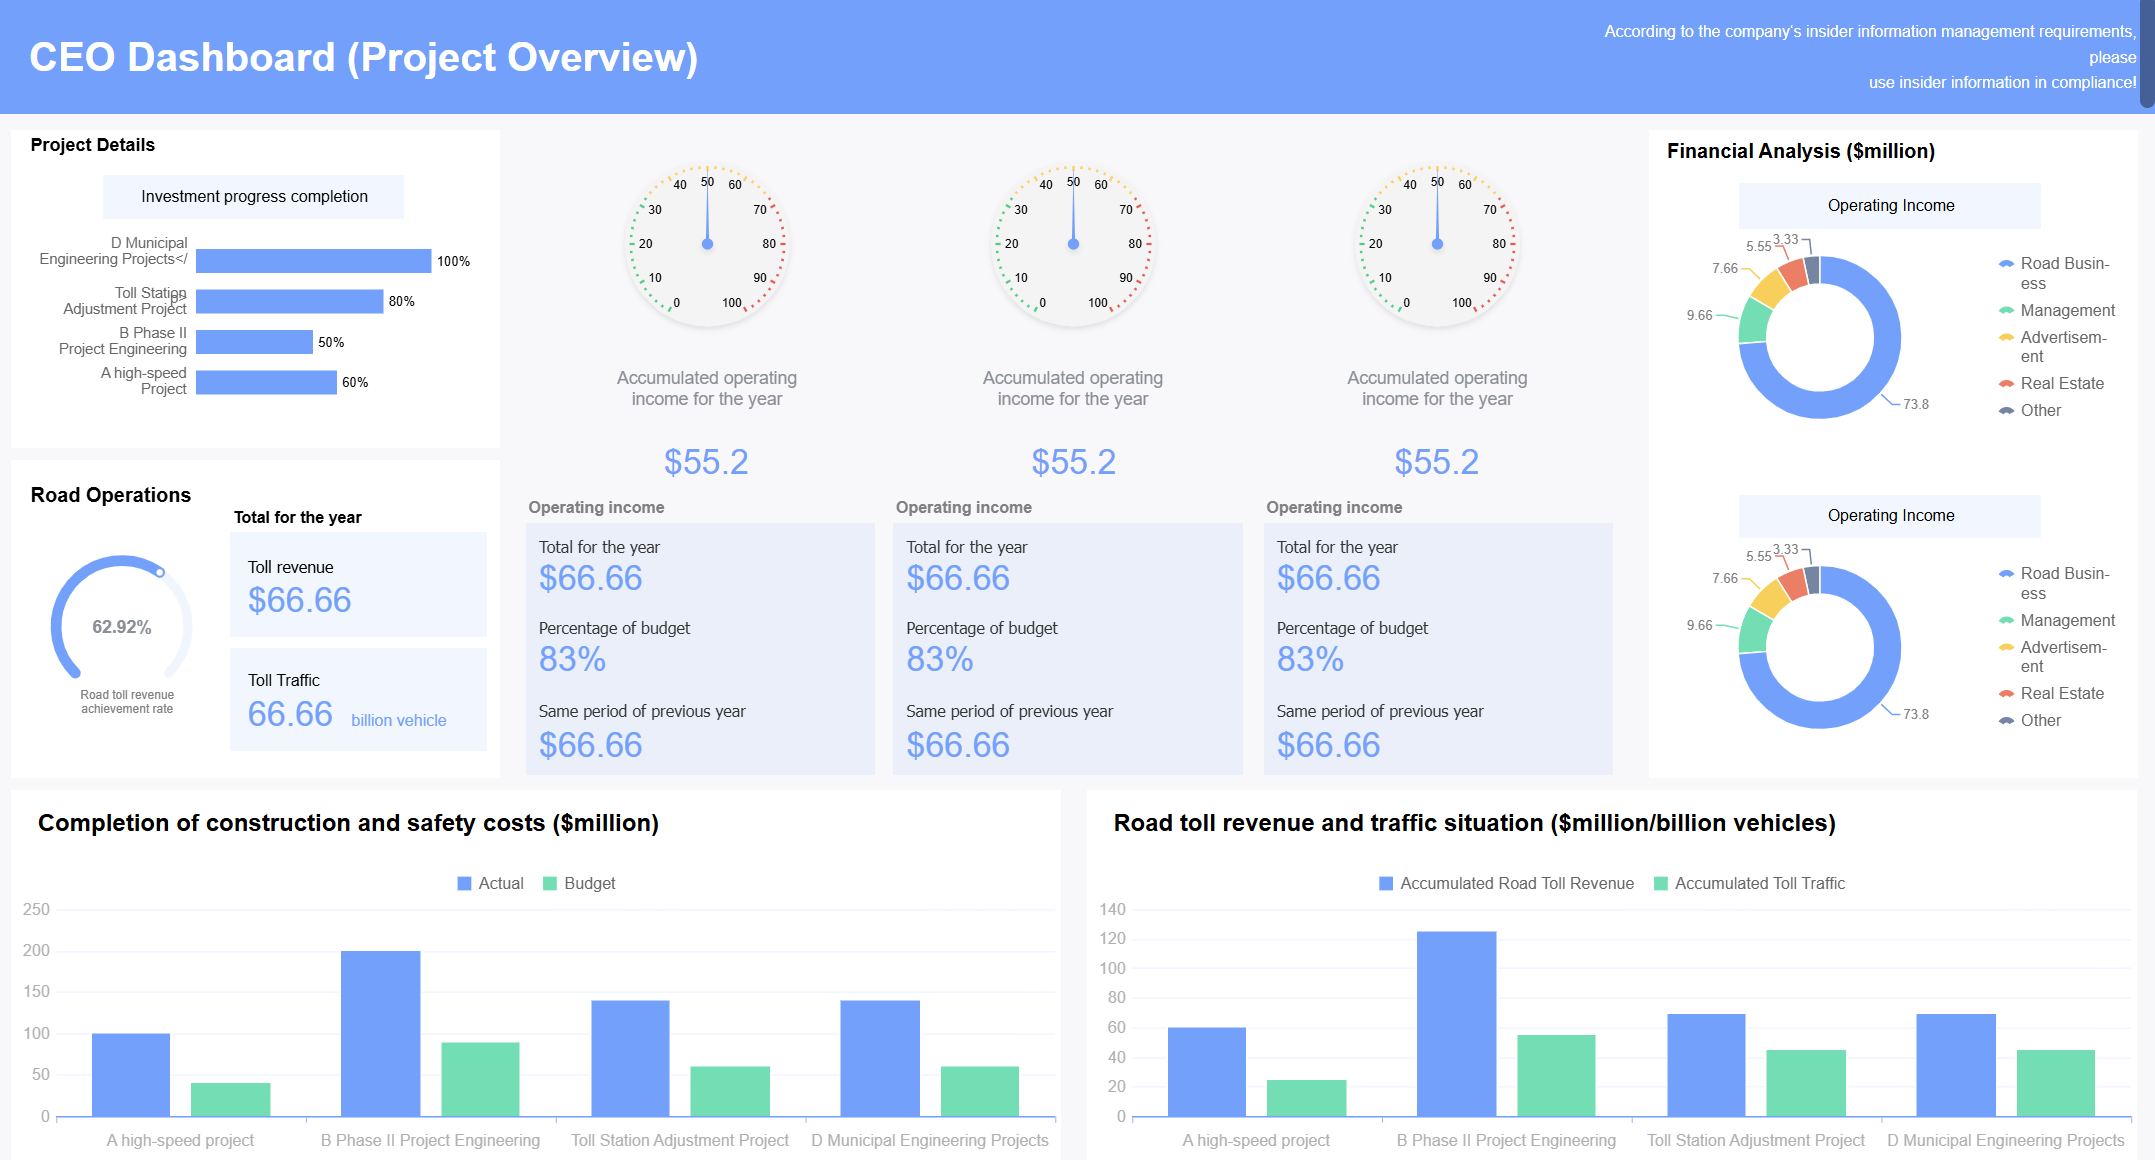
FineReport’s customer story at ADPIC shows how dashboards improve decision-making. ADPIC moved from static reports to interactive dashboards, tracking project milestones and resource allocation in real time. The organization integrated financial data with project outcomes, which improved accountability and trust. Automated compliance reporting reduced manual effort and increased safety. Dynamic dashboards tailored to stakeholders improved communication and engagement.
| Area of Improvement | Outcome |
|---|---|
| Project Tracking | Real-time tracking of milestones and resource allocation |
| Financial Oversight | Enhanced accountability and trust with funders |
| Compliance Reporting | Automated data collection, improved safety and responsibility |
| Stakeholder Communication | Dynamic dashboards, better engagement and efficiency |
| Predictive Analytics | Forecasting capabilities, proactive planning and risk management |
| Cultural Impact | Continuous improvement and recognition through real-time data visibility |
You foster a culture of continuous improvement when you use a project dashboard. Transparent reporting increases morale and collaboration. You link expenditures to project outcomes, which improves financial accountability. You automate compliance reporting, saving time and reducing errors.
You see project progress at every stage. You use milestone trackers to monitor completion dates and resource allocation. You rely on performance metrics to measure success and adjust your plan. Dashboards give you the tools to make informed decisions, keep your team aligned, and achieve your project goals.
Tip: When you use a project dashboard, you gain real-time insights that help you make faster, smarter decisions and drive your project forward.
Essential Features of a Project Management Dashboard
A project management dashboard is a digital workspace that gives you a real-time, visual summary of your project’s progress, key metrics, and team activities in one place. You use it to track goals, budgets, and deadlines with clarity and speed.
Must-Have Elements
When you choose a project dashboard, you want features that make your work easier and more effective. The key features of a project dashboard help you manage every part of your project. You see activity tracking, risk status, financials, and strategic alignment in one view. You also track change requests, time, budget, and resources. You get a personal to-do list and milestone tracking reports.
- Ease of use
- Customization
- Collaboration
- Resource management
- Task tracking
- Reporting
- Activity tracking
- Risk status
- Financials
- Strategic alignment
- Change request tracking
- Time tracking
- Budget management
- Resource actuals vs. estimates
- Project deliverables
- Milestone tracking
KPI dashboards consolidate complex data from multiple sources and present it in clear, visual summaries that make it easy for teams to spot patterns and anomalies immediately.
| Feature | Contribution to Effectiveness |
|---|---|
| KPIs | Provide a transparent, real-time view of progress against targets, ensuring focus on strategic goals. |
| Data Visualization | Present complex data in clear, visual summaries, enabling quick identification of patterns and anomalies. |
| Mobile Access | Allows easy access to project information, facilitating timely decision-making and performance tracking. |
FineReport lets you use drag-and-drop design to build dashboards quickly. You connect to multiple data sources, including databases and spreadsheets. You track your project budget dashboard and see updates in real time. You access dashboards on your phone or tablet, so you stay informed wherever you go.

Customization and Integration
You want your project dashboard to fit your needs. FineReport gives you real-time tracking, detailed reporting, and tailored dashboards. You customize layouts and choose what information to display. You share updates fast and keep finance and cost control visible. You see team bandwidth and project needs at a glance.
| Feature | Description |
|---|---|
| Real-time tracking | Provides up-to-date information on project progress, allowing for immediate adjustments. |
| Reporting | Enables detailed analysis and presentation of project data tailored to specific needs. |
| Tailored dashboards | Allows customization of the dashboard layout and information displayed based on project requirements. |

You integrate FineReport with your existing systems. You manage your project budget dashboard and track performance metrics anytime, anywhere. You keep your team connected and your project on track.
Types and Examples of Project Dashboards
A project management dashboard is a digital workspace that gives you a real-time, visual overview of your project’s progress, key metrics, and team activities, helping you track goals, budgets, and deadlines in one place.
Industry Applications
You see project dashboards used in many industries. Each sector has unique requirements for tracking and reporting. In finance, you need strong data integrity and real-time monitoring. Manufacturing relies on centralized data and traceability. The public sector demands transparent reporting and stakeholder visibility.
Here is a table showing how dashboard requirements differ by industry:
| Sector | Key Requirements | Compliance Focus |
|---|---|---|
| Finance | Strong data integrity, real-time monitoring, strict access controls | Regulatory frameworks like Basel III and GDPR |
| Manufacturing | Centralized data, traceability, customizable reporting | Industry standards such as GxP |
| Public Sector | Transparent reporting, stakeholder visibility | Procurement rules, public trust |
You use different types of dashboards depending on your role and needs. Strategic dashboards help senior managers oversee multiple projects. Operational dashboards give project managers real-time data on tasks. Analytical dashboards support analysts with deep data insights.
| Dashboard Type | For Whom | Main Goal |
|---|---|---|
| Strategic dashboards | Senior managers and executives | Oversee strategic direction of multiple projects |
| Operational dashboards | Project managers and team leads | Provide real-time data on operational aspects |
| Analytical dashboards | Project analysts, data scientists | Offer advanced tools for data-driven decisions |
Use Cases with FineReport
You can apply FineReport project dashboards in finance, manufacturing, and the public sector. In finance, you track risk management and compliance. FineReport helps you monitor overdue payments, asset quality, and customer risks. In manufacturing, you optimize production efficiency and equipment utilization. You use dashboards to analyze production metrics, quality, and costs. FineReport supports real-time monitoring and predictive maintenance.
In the public sector, you need transparent reporting and stakeholder engagement. The Abu Dhabi Projects and Infrastructure Centre (ADPIC) uses FineReport to manage government capital projects. You see real-time updates on milestones, budgets, and resource allocation. FineReport’s dashboards improve oversight and strategic planning.
Tip: You can customize FineReport dashboards for any industry. You choose the metrics, layout, and data sources that fit your project needs.
You use project dashboards to track progress, manage resources, and make informed decisions. FineReport gives you the flexibility to create dashboards that match your goals, whether you work in finance, manufacturing, or government.
Best Practices and Pitfalls for Project Management Dashboards
A project management dashboard is a digital workspace that gives you a real-time, visual summary of your project’s progress, key metrics, and team activities, helping you track goals, budget, and deadlines in one place.
Building Effective Dashboards
You want your project dashboard to deliver clear insights and drive action. Follow these best practices to build an effective dashboard:
- Focus on KPIs that matter. Choose metrics that show project health, delivery performance, and budget status. Limit KPIs to those that answer key questions about your project.
- Organize your dashboard layout to tell a story. Guide the viewer’s eye from high-level project status to detailed budget and milestone information.
- Use hierarchy and drill-downs. Provide layers of information so users can quickly move from summary views to detailed budget breakdowns.
- Apply human-centered design. Make sure your dashboard displays accurate data and offers flexibility for different users.
- Round numbers and use strategic sizing. This reduces cognitive load and helps users focus on important budget figures.
- Keep colors, fonts, and layout consistent. This makes information easier to find and understand.
- Label data clearly and update in real time. Users trust dashboards that show precise, current project and budget data.
Tip: Create a visual hierarchy so users can spot critical budget and project updates instantly.
Common Mistakes to Avoid
You may face challenges when building a project management dashboard. Avoid these common pitfalls:
- Trying to please everyone can lead to confusion. Different users have different needs.
- Skipping storyboarding may result in unclear dashboard objectives.
- Including too many formatting details distracts from your main project goals.
- Asking users what they want may not reveal true needs. Focus on project outcomes and budget priorities.
- Presenting data without context can cause misinterpretation.
- Overcrowded dashboards overwhelm users and hide important budget insights.
- Using metrics that others do not understand leads to confusion.
- Underestimating maintenance needs can lower dashboard adoption.
- Starting with too much complexity delays dashboard release.
- Cluttering with low-value graphics distracts from budget and project objectives.
- Waiting for complex technology can delay your access to project insights.
FineReport helps you avoid these mistakes. You use drag-and-drop design, real-time updates, and customizable layouts to keep your dashboard focused on project and budget success.
A project management dashboard is a digital tool that shows you real-time project data, helping you track progress and make decisions quickly.
You see real benefits when you use dashboards for your project. You spot delays early, which can reduce total delay impact by 35%. You control costs better and improve resource use by 19%. Stakeholder trust rises by 33%, and you make decisions 37% faster.
FineReport gives you a drag-and-drop interface, real-time reporting, mobile access, and customizable templates. You measure ROI by using accurate data, updating ROI regularly, and looking at team efficiency and client satisfaction.
When you choose a dashboard, focus on customization, data visualization, real-time updates, integration, collaboration, mobile access, scalability, and analytics. Make sure your project dashboard supports business goals, tracks KPIs, and keeps stakeholders engaged.
Continue Reading About Dashboard
What is a Call Center Metrics Dashboard and How Does It Work
What Is an Enterprise Dashboard and Why Does It Matter in 2026
Draft Dashboard Review - Is It the Ultimate DFS Tool?
What is a Digital Marketing Dashboard and Why Does it Matter


FAQ

The Author
Lewis
Senior Data Analyst at FanRuan
Related Articles

How to Build an Investment Portfolio Reporting Dashboard for Executives: KPIs, Benchmarks, and Drill-Down Views
Investment portfolio reporting for executives is not about showing every holding, transaction, and chart your investment team can produce. It is about giving CEOs, CFOs, CIOs, boards, and investment committees a fast, re
Yida YIn
Jun 25, 2026

12 KPI Reporting Examples for Executive Dashboards: What to Show in Weekly, Monthly, and Quarterly Reviews
Executive leaders do not need more data. They need decision ready $1 examples that match how often they review the business and what actions they are expected to take. A weekly $1 should surface fast moving risks and per
Yida YIn
Jun 25, 2026

How to Build a Digital Marketing Reports Dashboard: Executive Examples, KPIs, and Templates
A $1 is the control layer that helps executives and marketing leaders turn scattered channel data into fast, confident decisions. If you are a CEO, CMO, operations director, or marketing analytics lead, the real problem
Yida Yin
May 07, 2026