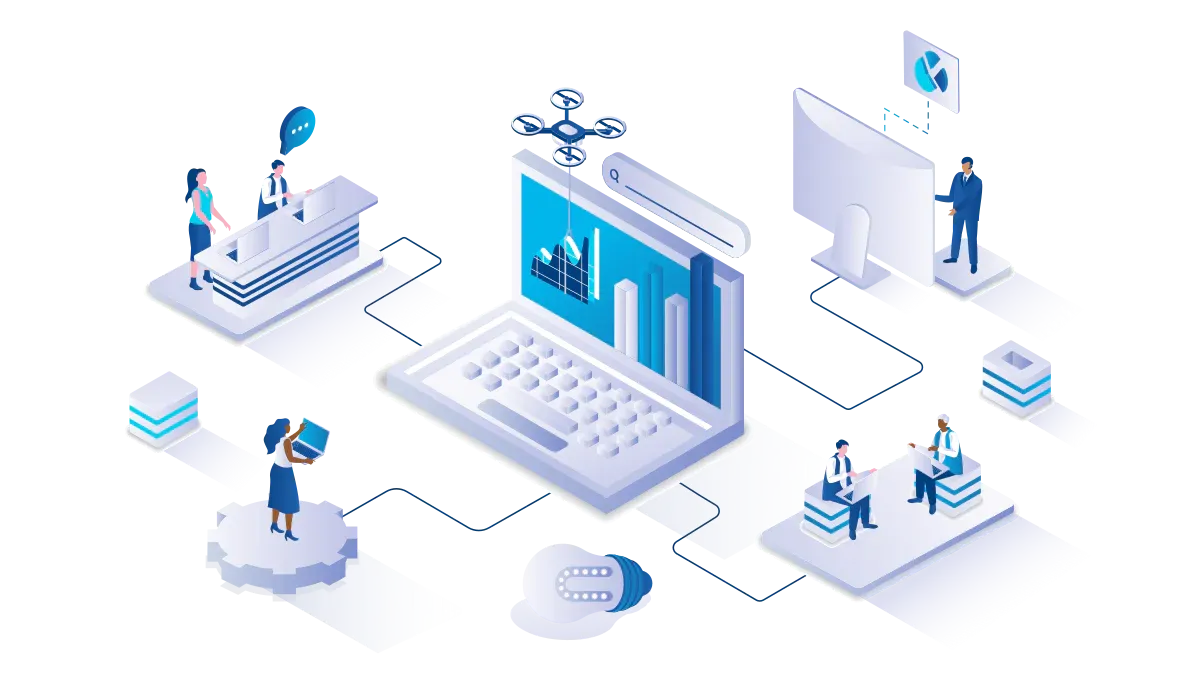
A project dashboard is a digital workspace that lets you track, analyze, and manage every aspect of your project in one centralized location, giving you instant access to key metrics and updates.
With a dashboard, you see project progress in real time, spot problems early, and boost team alignment. You can quickly find task assignments, deadlines, and profitability details. FineReport helps you create dashboards that consolidate project information and make decision-making faster and easier.
| Benefit | Description |
|---|---|
| Streamline reporting | Dashboards sync with workflows for accurate insights in real time |
| Spot problems early | Modern dashboards identify risks before they escalate |
| Centralize work | Dashboards gather information from various sources |
| Real-time profitability | Monitor project margins as work progresses |
| Better decision-making | Get timely data for fast, informed choices |
A project dashboard is a digital tool that gives you a real-time, visual summary of your project’s key metrics, helping you track progress, spot risks, and make informed decisions quickly.
You use a project dashboard to see the health and status of your project at a glance. It brings together important data points, such as activity tracking, risk status, financials, and strategic alignment. This workspace helps you monitor deadlines, milestones, and resource allocation without searching through multiple documents.
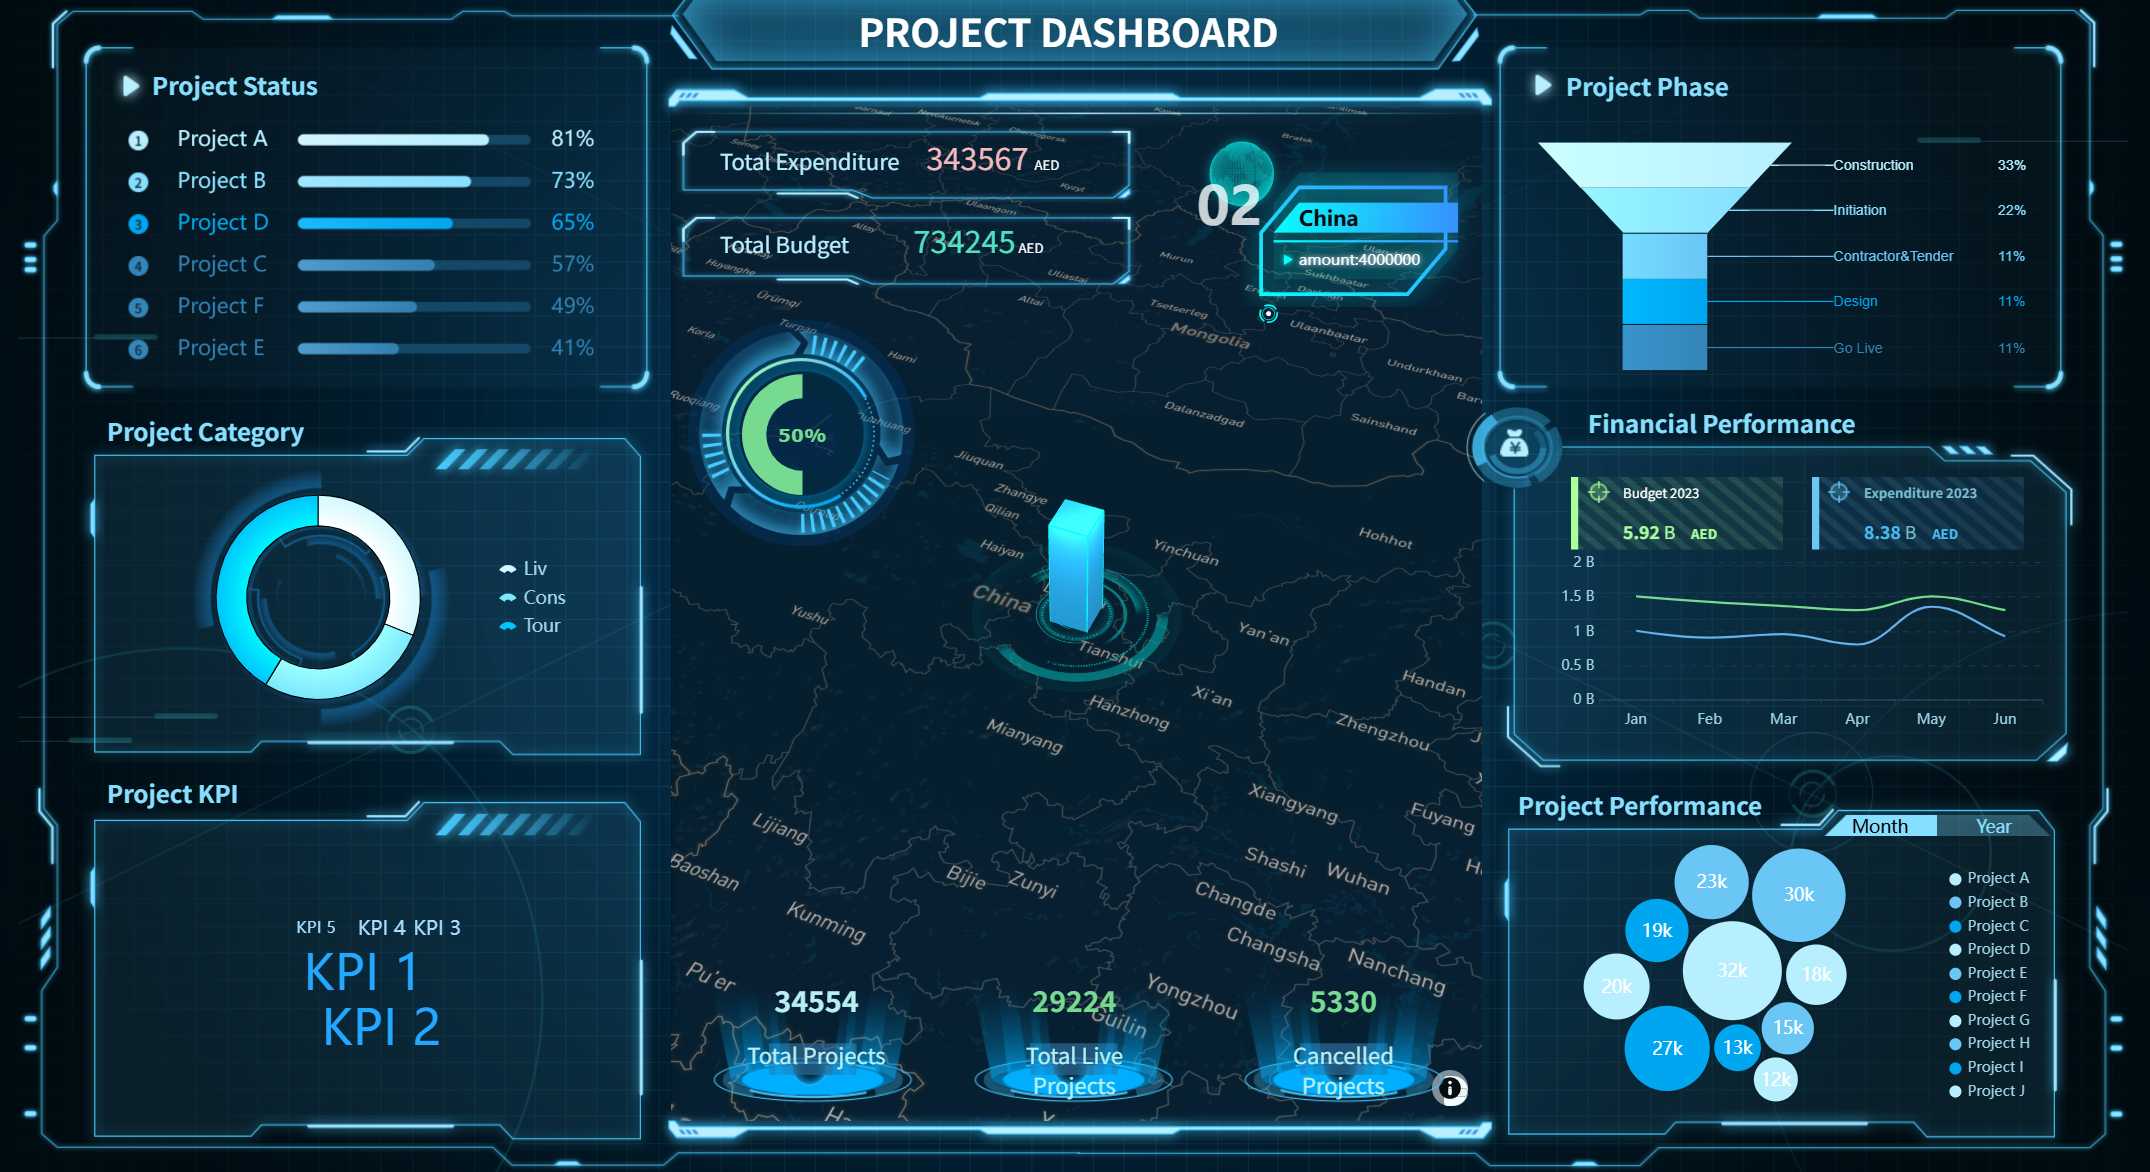
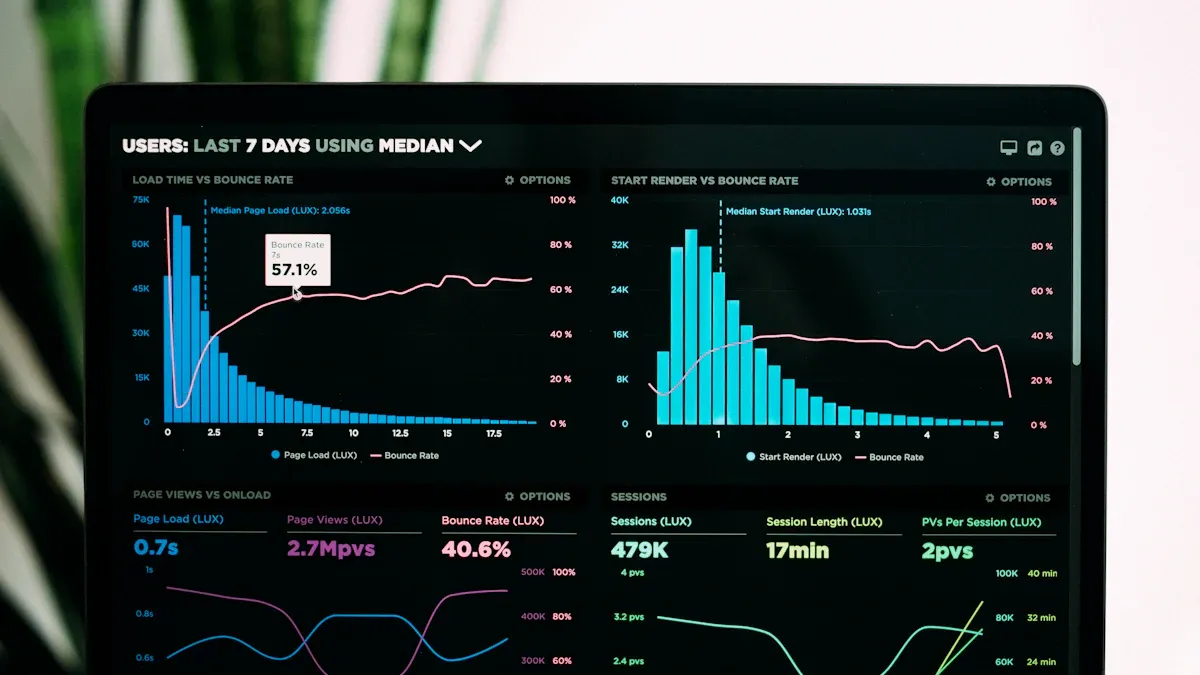
Tip: A project dashboard uses charts, graphs, and gauges to show trends and status, making complex information easy to understand.
Here are the core components you will find in a typical project dashboard:
| Core Component | Description |
|---|---|
| Key Metrics | Track project progress, budget status, and KPIs. |
| Visual Indicators | Use charts and graphs for quick status updates. |
| Real-Time Data | Access up-to-date information instantly. |
| Milestones and Deadlines | Highlight important dates and deliverables. |
| Risk Management | Identify and monitor project risks. |
| Resource Allocation | See how resources are used and distributed. |
| Customization Options | Adjust the dashboard to fit your needs. |
A project dashboard gives you and your team instant insights into every aspect of your project. You can track activities, monitor risks, and review financials all in one place. This tool helps you align your project with business goals and ensures everyone stays informed.
| Aspect | Reports | Dashboards |
|---|---|---|
| Purpose | Detailed data analysis | Visual summary for quick insights |
| Format | Tables or written summaries | Charts, graphs, and gauges |
| Interactivity | Usually static, sometimes with filters | Interactive with drill-down and filtering options |
A project dashboard replaces guesswork with clear, graphical insights. You make better decisions because you see the latest data in a format that is easy to understand and share.
A project dashboard is a digital workspace that displays your project’s key metrics, progress, and status in one place, helping you make informed decisions and keep your team aligned.
You need a project management dashboard because it transforms scattered project data into actionable insights, giving you improved visibility, real-time updates, and the power to drive productivity and better decision-making across your organization.
A project management dashboard brings clarity and control to your project management process. You see project progress, track performance, and monitor project status instantly. This visibility helps you spot issues early and respond quickly.
| Benefit | Description |
|---|---|
| Improved visibility | Provides a clear, real-time view of tasks, milestones, and overall project status. |
| Better alignment across teams | Centralized data reduces miscommunication and fosters collaboration. |
| Faster decision-making | Live updates enable quick identification of issues and timely actions. |
| Financial and schedule tracking | Monitoring KPIs helps assess cost efficiency and schedule adherence. |
| Optimize resource allocation | Balances workload distribution and plans capacity effectively to prevent bottlenecks. |
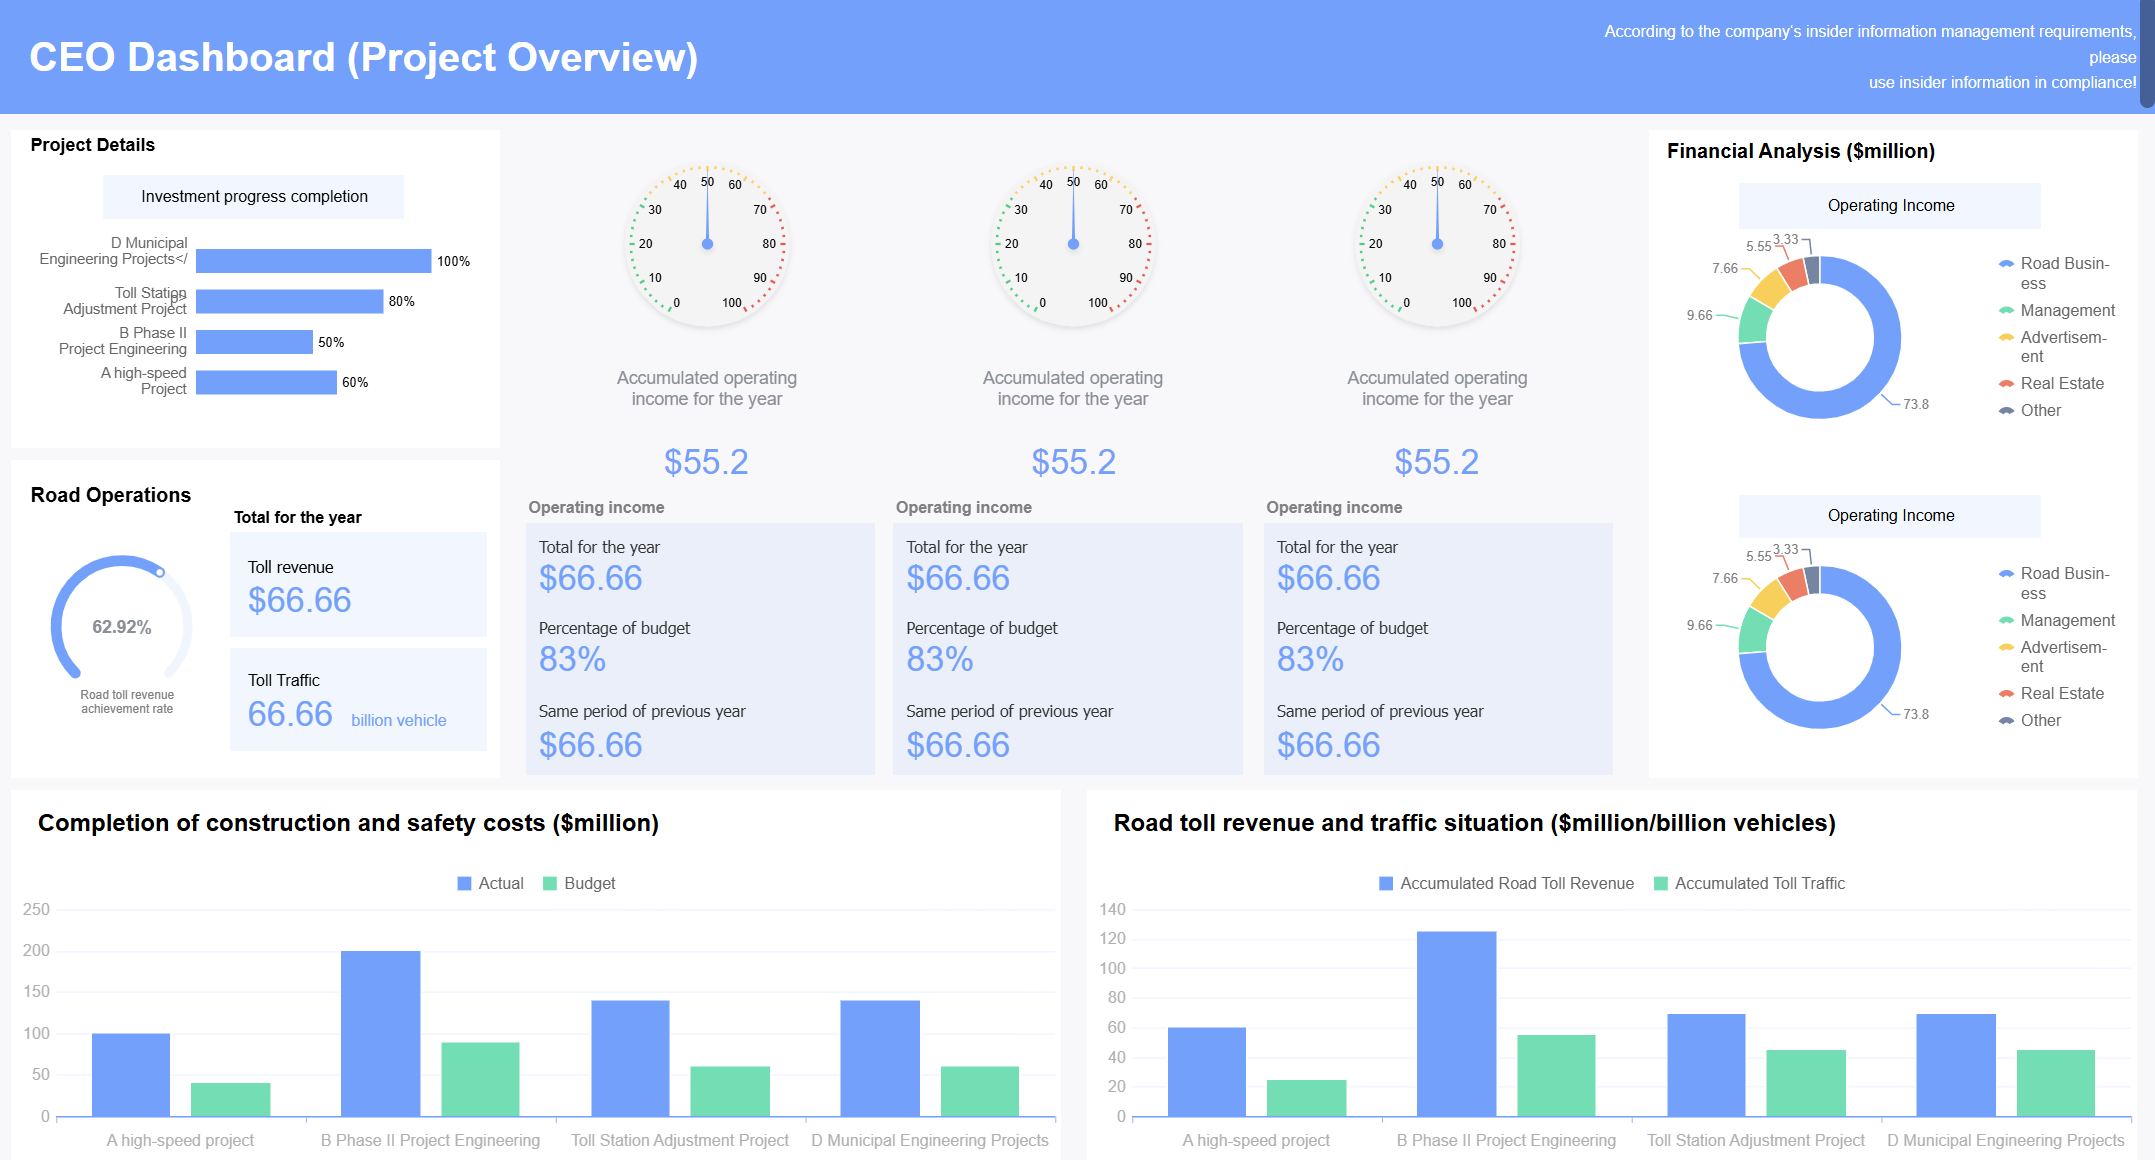
FineReport empowers you to create an effective dashboard that delivers actionable insights. You can monitor project performance, compare budget vs actual figures, and visualize project progress with interactive charts. The dashboard helps you track productivity, identify bottlenecks, and ensure proactive risk management.

A project management dashboard also supports improved communication. You can share real-time insights with your team and executives, keeping everyone informed and aligned. This transparency boosts accountability and helps you achieve project goals faster.
Real-time insights are essential for effective project management. With a project management dashboard, you see project status updates as they happen. This visibility enables you to make data-driven decisions and respond to changes without delay.
| Benefit | Contribution to Project Outcomes and Efficiency |
|---|---|
| Real-time visibility | Allows teams to instantly see progress and identify potential issues, enhancing overall project management. |
| Improved communication | Reduces the need for constant updates, fostering better communication among team members and stakeholders. |
| Improved decision-making | Enables informed decisions based on readily available data, leading to timely interventions. |
| Efficient resource allocation | Ensures effective allocation of resources, preventing team members from being overburdened. |
| Early risk identification | Helps in identifying risks before they escalate, allowing for proactive management of potential issues. |
| Increased accountability | Promotes accountability by providing clear visibility into responsibilities, ensuring deadlines are met. |
| Improved project execution | Contributes to better results, including on-time delivery and on-budget completion, enhancing overall team performance. |
FineReport dashboards provide real-time data access, enabling you to monitor project performance and make adjustments as needed. You can track project progress, analyze trends, and validate decisions with up-to-date information. This approach supports a data-driven culture and ensures your project aligns with business objectives.
A well-designed project management dashboard acts as a single source of truth. You get instant updates on project status, identify bottlenecks early, and ensure the right information reaches the appropriate stakeholders. This centralized view helps you optimize resource allocation, improve productivity, and maintain project visibility.
Project managers and executives benefit from centralized insights. They can monitor milestones, budgets, and KPIs in one place. The dashboard links performance metrics with responsible teams, fostering ownership and accountability. Leaders use these insights to make strategic decisions and keep projects aligned with corporate goals.
FineReport’s project management dashboard transforms raw data into visual reports, making complex information easy to understand. You can focus on high-level KPIs and ensure your project supports long-term business goals. This effective dashboard enhances productivity, drives better decision-making, and delivers measurable results.

A project dashboard is a digital workspace that gives you a clear, real-time overview of your project’s progress, tasks, and budgets in one place.
You need to monitor project progress to keep your team on track and deliver results on time. FineReport’s project dashboard lets you see every task, milestone, and deadline as they happen. You can track progress, spot delays, and adjust resources quickly. The dashboard provides real-time visibility, so you make informed decisions and respond to changes fast. Automation reduces manual updates, freeing you to focus on execution. When you use a project management dashboard, you improve collaboration and accountability. Teams align their efforts, and everyone knows their responsibilities. Early warnings help you avoid risks and keep your project moving forward.
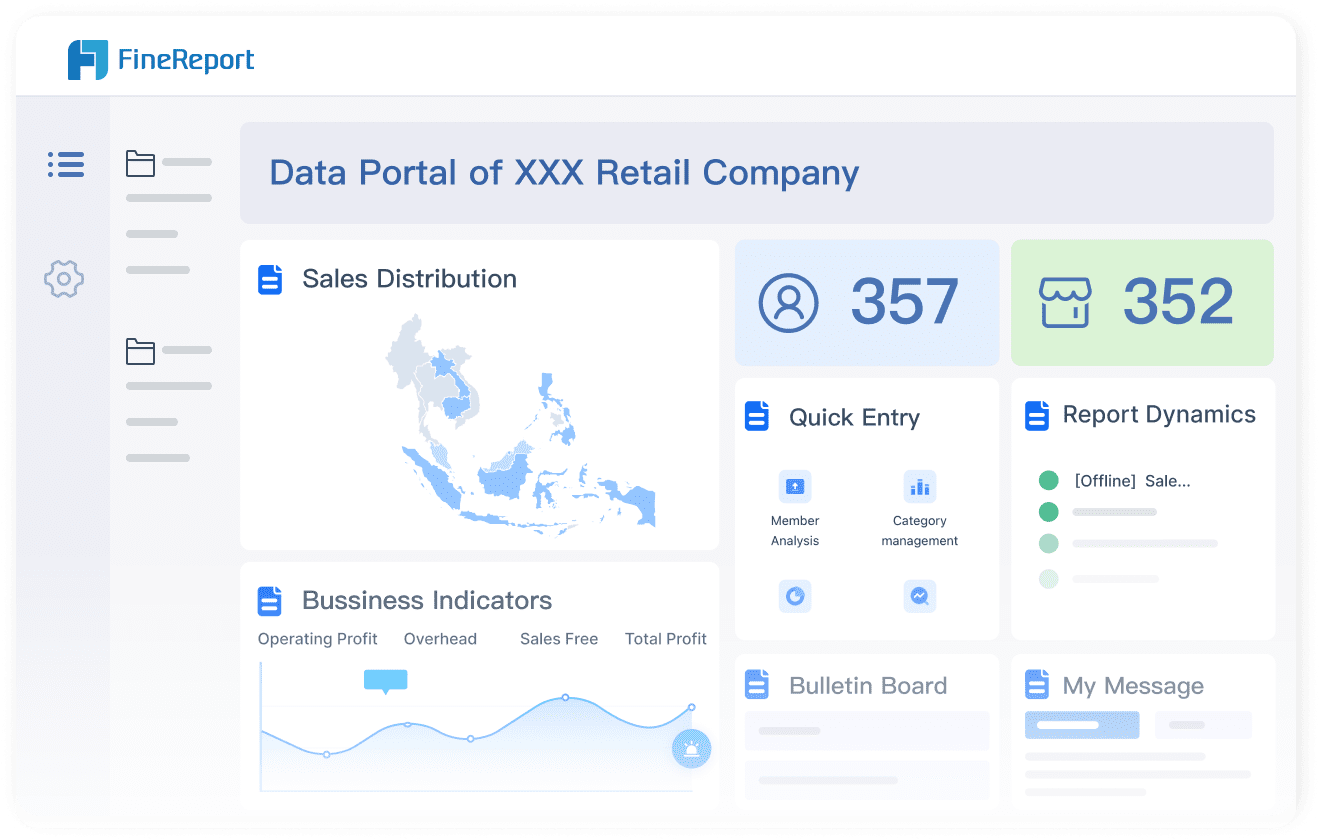
FineReport gives you the flexibility to customize your dashboard views. You can choose which metrics to display, filter data, and create layouts that fit your workflow. This customization boosts user engagement and satisfaction. You see only the information that matters most, whether you want to monitor project budgets or track progress across multiple teams. FineReport integrates data from over 70 sources, so you get a unified view of your project. The dashboard syncs with other enterprise systems, ensuring data quality and consistency. You can centralize meeting notes, action items, and financials, making it easy to manage complex projects.

| KPI | Description | Measurement Method |
|---|---|---|
| User Adoption Rate | Active users accessing the dashboard regularly | Portal analytics |
| Dashboard Customization | Users creating or modifying dashboard views | Event tracking |
| User Satisfaction Score | Feedback from embedded surveys | Aggregated survey responses |
You can access your project dashboard on any device, including smartphones and tablets. FineReport’s mobile dashboards prioritize key metrics, making it easy to check progress on the go. Touch-friendly design ensures smooth navigation, even for users with motor impairments. You get quick access to summary data, so you stay informed wherever you are. The 3D dashboard feature lets you visualize complex data in new ways. You can see trends, analyze progress, and make decisions with confidence. These advanced dashboards enhance accessibility and user experience, supporting diverse business needs.

| Feature | Description |
|---|---|
| Smart Report | Detailed insights for better project management |
| Visualizations & Dashboards | Interactive data representation |
| Decision-making Platform | Tools for informed choices |
| Mobile BI | Access on mobile devices |
| Visual Chart | Enhanced clarity for progress tracking |
| Data Collection | Integration from various sources |
| Deployment & Integration | Seamless setup and use |
Tip: Use mobile dashboards to monitor project budgets and progress anytime, anywhere.
A project dashboard is a digital tool that displays your project’s key metrics and progress in a single, easy-to-understand view.
You can use executive dashboards to get a high-level overview of your project’s health and performance. These dashboards focus on strategic metrics, such as budget status, milestone completion, and risk indicators. Team dashboards, on the other hand, help you track daily tasks, deadlines, and resource allocation. You see which team members are responsible for each activity and monitor progress in real time.
Tip: When you design a dashboard, balance screenspace, detail, and interaction. This helps you get actionable insights without overwhelming users.
Here are important attributes to consider for effective dashboard design:
You can tailor a project dashboard to fit your industry’s unique needs. For example, a marketing dashboard tracks website performance, lead generation, and engagement rates. In ecommerce, dashboards focus on inventory management and marketing performance. Finance dashboards monitor revenue, cash flow, and fundraising efforts. Executive dashboards provide high-level insights for decision-making.
| Industry | Dashboard Examples |
|---|---|
| Ecommerce | Inventory dashboard, Warehouse dashboard, Ecommerce KPI dashboard, Shopify dashboards |
| Executive | CMO dashboard, CEO dashboard, Management dashboard, Company dashboard, Pirate metrics dashboard |
| Finance | Revenue dashboard, Cash flow dashboard, Fundraising dashboard, Account Manager dashboard |
| Marketing | Digital marketing dashboard, Web analytics dashboard, Lead generation dashboard, SEO dashboard |
You can use dashboards to monitor billable hours, track sales performance, or analyze organizational efficiency. Each dashboard type helps you focus on the metrics that matter most for your project.
FineReport lets you create custom dashboards that match your project’s goals. You start by defining the dashboard’s purpose. You select data sources that provide accurate insights. You add visualizations and interactive elements to make the dashboard engaging and easy to use.

FineReport integrates data from multiple sources, so you see all your project information in one place. You can customize layouts, filter data, and drill down into details. This flexibility helps you make informed decisions quickly and keeps your project on track.
Note: Custom dashboards with FineReport support real-time updates and interactive analysis, making them ideal for dynamic project environments.
A project dashboard is a digital workspace that displays your project’s key metrics, progress, and status in a single, easy-to-understand view.
You can set up a project dashboard with FineReport by following a clear process. First, define the goals for your project. Decide which metrics matter most for your team and organization. Next, gather reliable data sources. FineReport connects to databases, spreadsheets, and other systems, so you can centralize all project information.
Use FineReport’s drag-and-drop designer to build your dashboard. Add charts, tables, and visual indicators to show project status and progress. Customize the layout to highlight important milestones, deadlines, and risks. Involve your team in the design process. Their input helps you create a dashboard that solves real business problems, such as reducing unnecessary meetings or spotting issues early.

After building the dashboard, test it with a small group. Collect feedback and make adjustments. Train users with workshops and online resources. Show them how to navigate the dashboard and use its features. Demonstrate the value by linking dashboard insights to project outcomes.
To keep your project dashboard effective, follow these best practices:
| Strategy | Description |
|---|---|
| Scannability and ease of navigation | Make the dashboard easy to understand for everyone. |
| Regular updates | Keep project information current and use the dashboard as intended. |
| Data transparency | Allow all stakeholders to access relevant dashboards. |
| Encourage reflection and discussion | Organize meetings to discuss project data and implications. |
You should update your project dashboard regularly. Share insights with your team and discuss project data in meetings. This keeps everyone informed and helps you make better decisions. Continuous improvement ensures your dashboard stays relevant and useful.
A project dashboard is a digital workspace that gives you a real-time view of your project’s key metrics and progress.
You gain clear benefits when you use a project dashboard for your project management. You see real-time updates, automate routine tasks, and improve collaboration. FineReport helps you build dashboards that speed up data access and improve accuracy. Many organizations report faster decision-making and better project outcomes.
| Common Challenge | Description |
|---|---|
| Data Access and Quality | Inconsistent data or missing information can make project evaluation difficult. |
You should review your current project management process. Modern dashboards like FineReport can help you overcome challenges and drive business success.
What is a Digital Dashboard and How Does It Work
Dashboard Anywhere Made Easy for Chrysler Employees
Production Management Benefits for Manufacturers

The Author
Lewis
Senior Data Analyst at FanRuan
Related Articles

Payment Analytics Dashboard: 12 KPIs Every Operations Leader Should Track to Cut Revenue Leakage
Losing revenue to declines? Discover 12 essential KPIs to track in your payment analytics dashboard to stop leakage and manage disputes.
Lewis Chou
May 05, 2026

SOC Dashboard Explained: 12 Essential KPIs, Views, and Workflows Security Teams Use
Learn about SOC dashboards, the 12 essential KPIs for security teams, and how they centralize alerts and workflows for faster threat detection and response.
Lewis Chou
May 05, 2026

EMR Dashboard Guide: 12 Metrics to Track for Faster Clinical and Operational Decisions
Learn the 12 essential EMR dashboard metrics to track for faster clinical and operational decisions, improving patient flow and revenue cycle management.
Lewis Chou
May 05, 2026


