Have you ever opened Excel, ready to dive into your data, only to find the Data Analysis ToolPak missing? Don’t worry—you’re not alone! This is a common hiccup, and the good news is that it’s super easy to fix. Whether it’s a setting issue or something else, you can get back to analyzing your data in no time. Let’s tackle this together and solve the "data analysis excel not showing" problem step by step.
Excel Data Analysis Troubleshooting Checklist
Before diving into detailed fixes, use this quick checklist to identify the most common reasons why the Data Analysis button may not appear in Excel.
□ Confirm you're using the desktop version of Excel
□ Check whether the Analysis ToolPak add-in is enabled
□ Verify that Excel add-ins are not disabled
□ Restart Excel after enabling ToolPak
□ Update Microsoft Office
□ Repair Office installation if necessary
□ Check organization-admin restrictions
□ Test with a new workbook
If you've completed all steps and Data Analysis still doesn't appear, follow the detailed troubleshooting guide below.
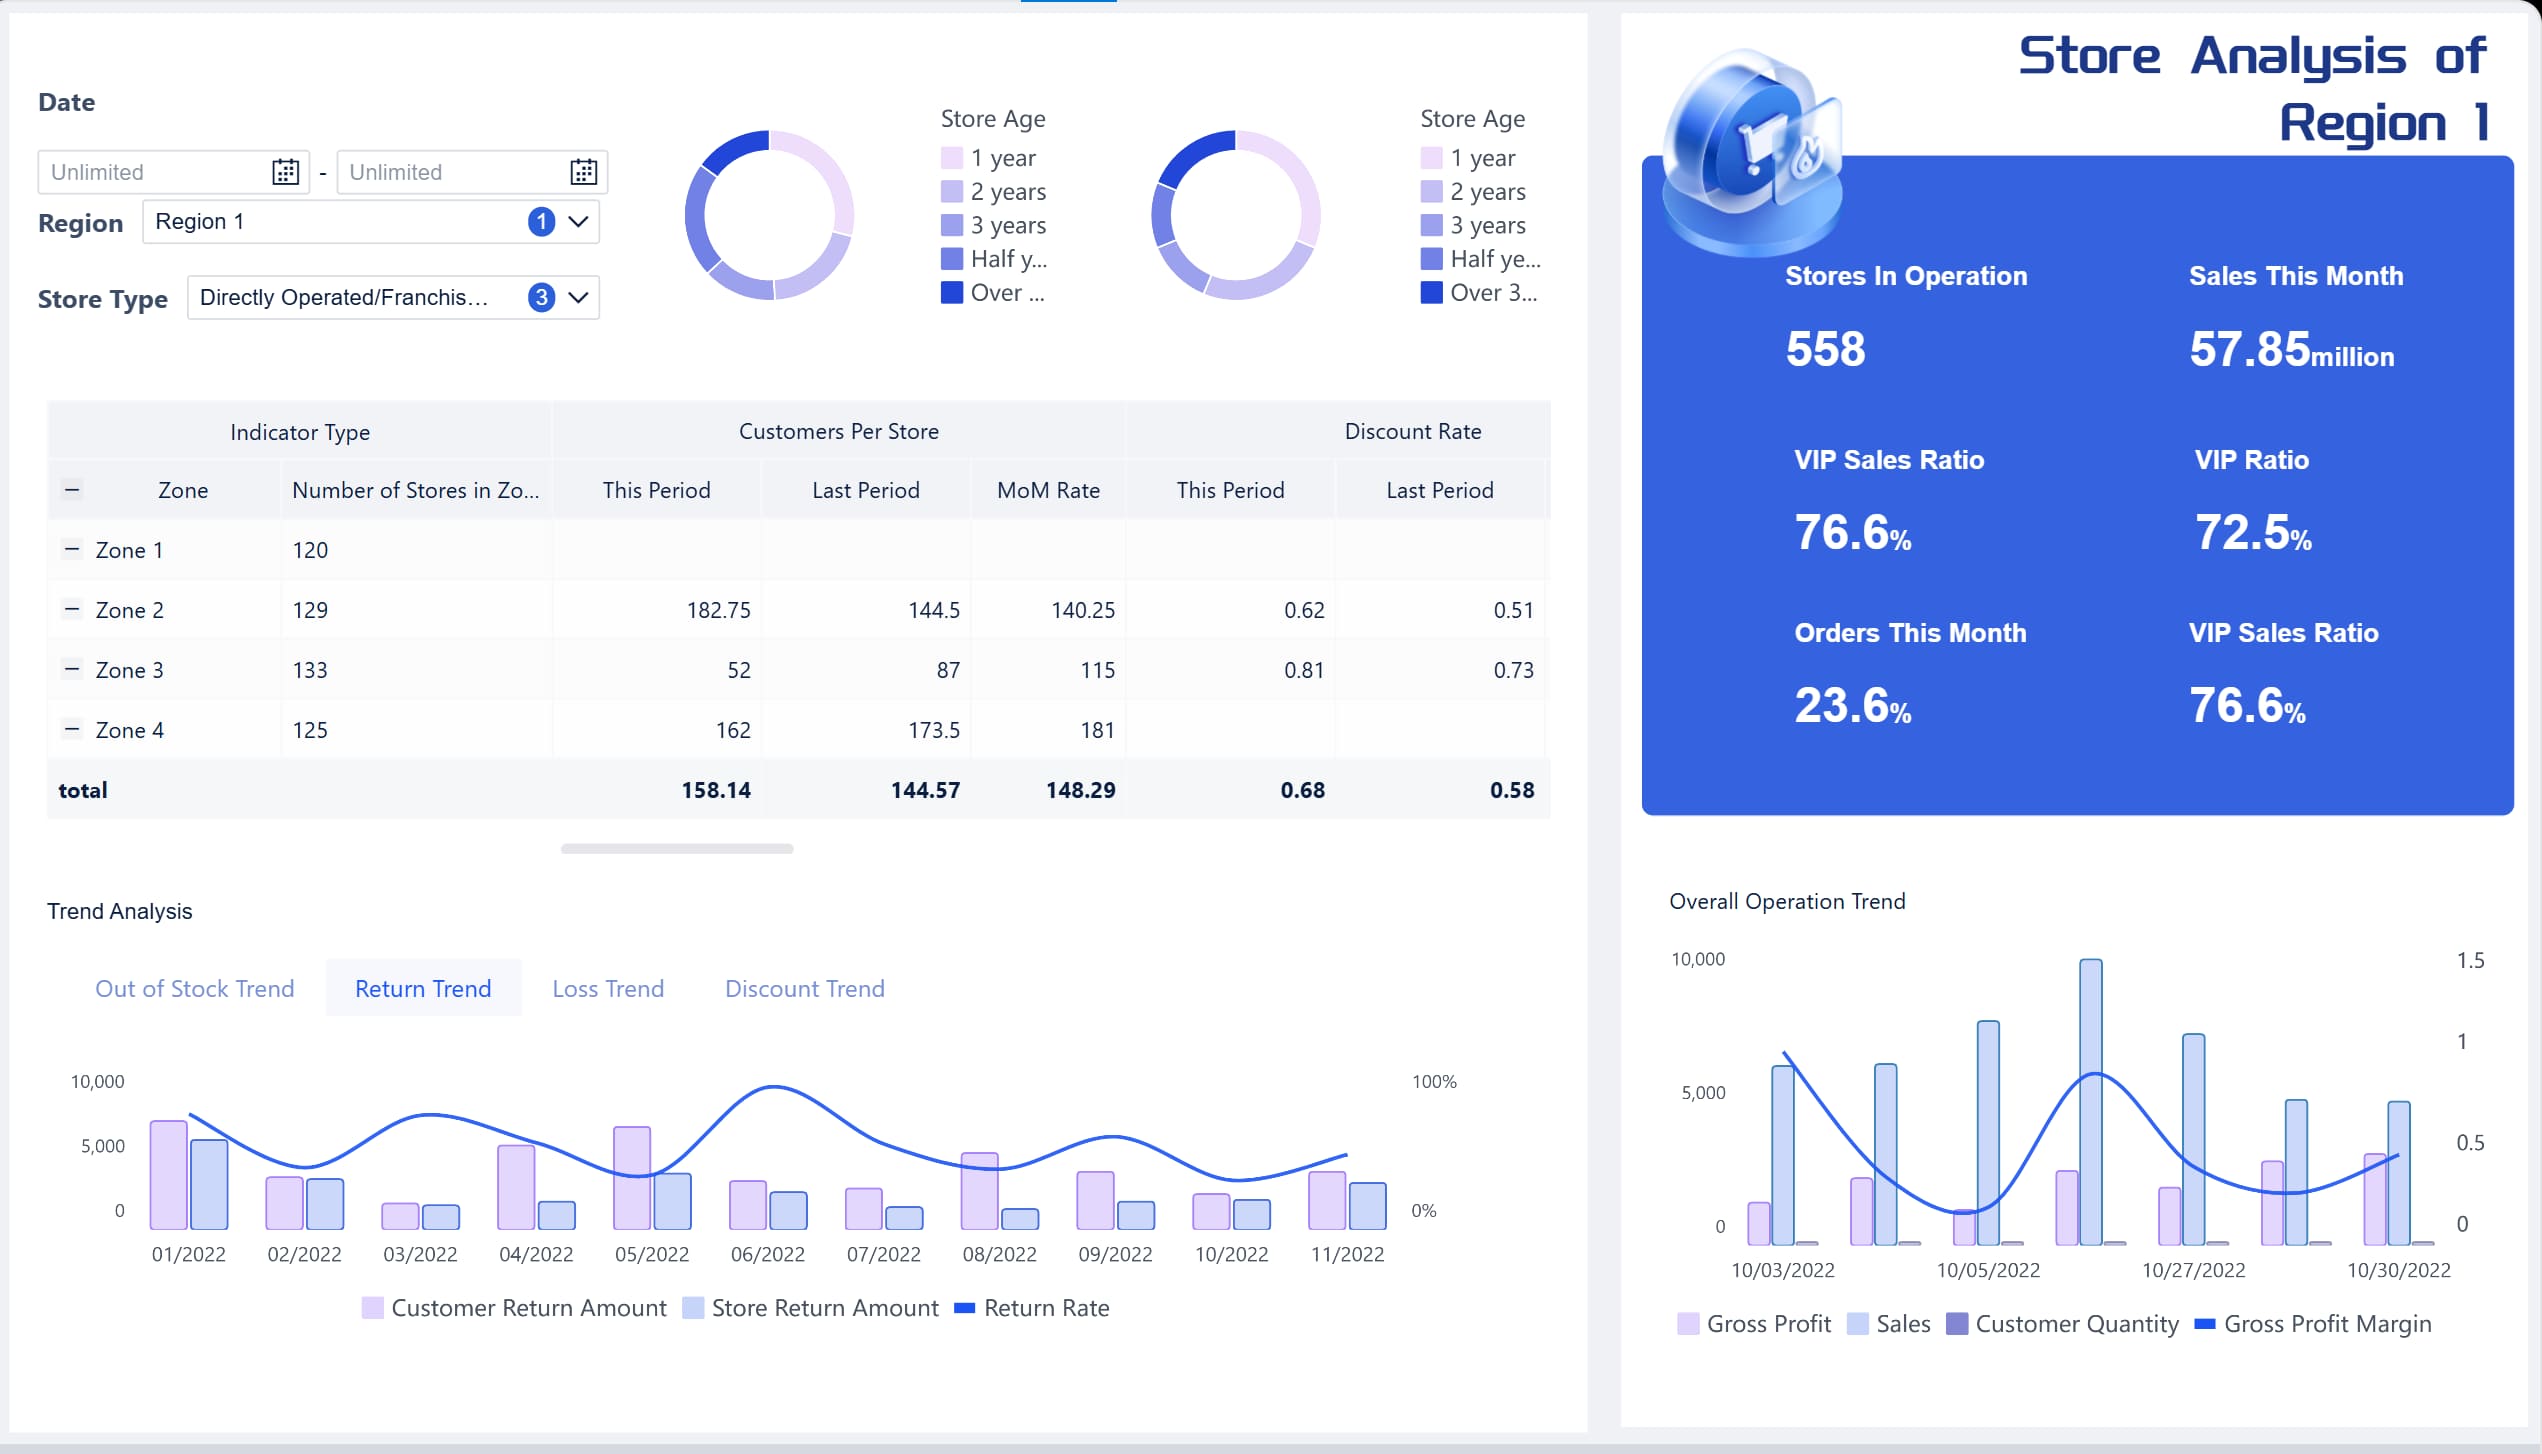
When the ToolPak Falls Short: You can Use BI Tools (like FineBI) for More Complex Analysis.
Key Takeaways on Fix Data Analysis Excel not Showing
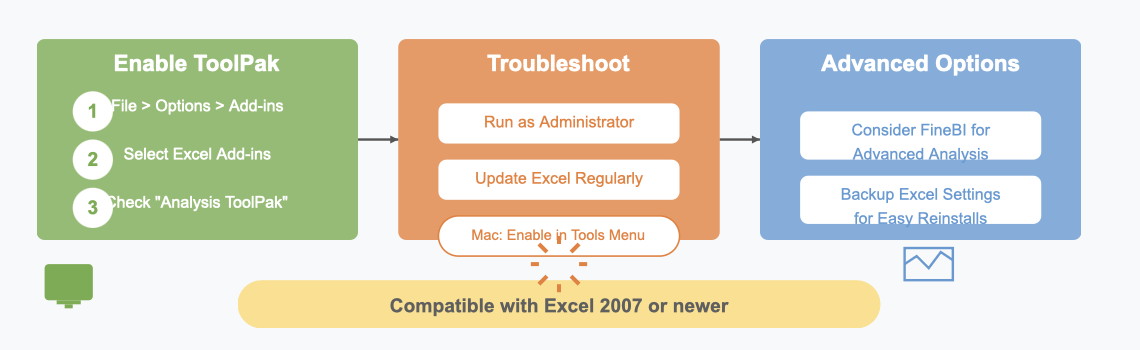
- Enable and Manage the ToolPak: The Data Analysis ToolPak is off by default—turn it on in Excel’s Add-ins menu. Ensure your Excel version is 2007 or newer for compatibility.
- Troubleshoot and Optimize: Run Excel as an administrator to fix permission issues and update regularly for smoother ToolPak performance. Mac users enable it in the Tools menu and restart Excel if needed.
- Explore Advanced Options: For more advanced analysis, consider professional reporting tools like FineReport. Backup your Excel settings to simplify reinstalls or updates.
Common Reasons for Data Analysis Excel Not Showing
If you’re wondering why the Data Analysis ToolPak isn’t showing up in Excel, you’re not alone. There are a few common reasons for this issue, and understanding them can help you fix it quickly. Let’s break them down.
The ToolPak is Not Enabled by Default
One of the most common reasons is that the ToolPak isn’t enabled by default. Even though it’s included in all versions of Excel, it often requires manual activation. This is especially true if you’ve done a custom installation of Excel.
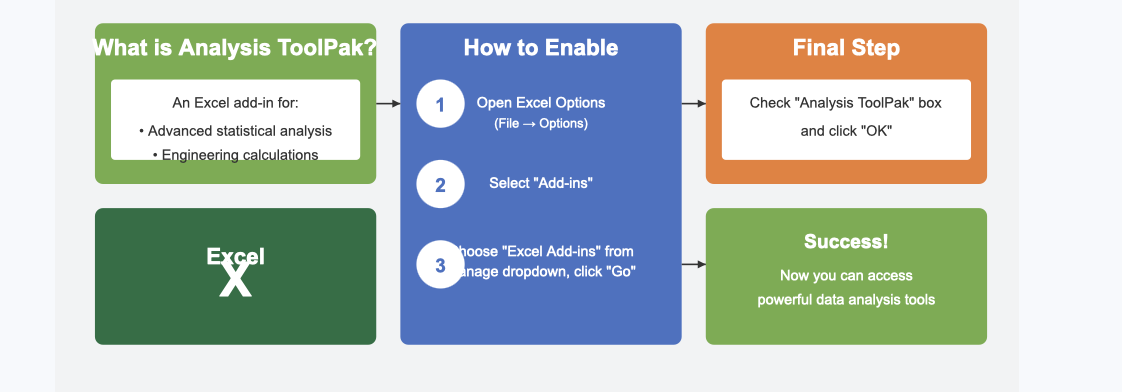
The Analysis ToolPak is an add-in that provides advanced statistical and engineering calculations. However, it doesn’t activate automatically. You’ll need to enable it through the Excel options menu. Don’t worry—it’s a quick process. Just head to the “Add-ins” section in Excel’s settings, and you’ll find the ToolPak waiting to be turned on.
Tip: If you don’t see the ToolPak listed, it might not be installed. In that case, you’ll need to add it manually by selecting “Excel Add-ins” and checking the box for the Analysis ToolPak.
Outdated Excel Version or Compatibility Issues
Another reason could be your Excel version. The Data Analysis ToolPak is only available in Excel 2007 and later versions. If you’re using an older version, you won’t find it, no matter how hard you look.
Compatibility issues can also cause problems. For example, if you’re running Excel on an older operating system, some features might not work as expected. Always make sure your Excel and operating system are up to date. Running the latest version ensures you have access to all the tools, including the Analysis ToolPak.
Here’s a quick checklist to help you troubleshoot:
| Reason for ToolPak Not Showing | Description |
|---|---|
| Add-in Not Showing | The ToolPak may not be installed. Check under 'Add-ins' in Excel options. |
| Data Analysis Option Grayed Out | The ToolPak is disabled. Re-enable or repair the installation. |
| Check Excel Version | The ToolPak is available only in Excel 2007 and later versions. |
| Run Excel as Administrator | Resolves permission issues preventing the add-in from being enabled. |
Incorrect Add-in Settings on Windows or Mac
Sometimes, the issue lies in the add-in settings. Errors in these settings can prevent the ToolPak from appearing or functioning correctly. This is especially common if you’ve used certain web add-ins or shared settings between different systems.
For example, users have reported issues like connectivity errors or permission warnings when using custom domains. These problems can disrupt the functionality of add-ins, including the Analysis ToolPak. On Mac, incorrect settings might cause the add-in to fail to load until you interact with it manually.
| Issue Description | Impact on Add-in Settings |
|---|---|
| Some documents failed to load after using certain web add-ins. | Indicates potential errors in add-in settings. |
| Sharing settings between OMEX and ExCatalog were no longer possible. | Affects web add-in settings updates. |
| Users received connectivity errors when internal and external EWS endpoints differed. | Impacts add-in functionality. |
| Custom domain users saw permission warning messages when pasting links. | Suggests issues with add-in permissions. |
| Forms content add-in did not render until user interaction occurred. | Points to errors in add-in display settings. |
If you suspect add-in settings are the problem, try resetting them or reinstalling the ToolPak. On Windows, running Excel as an administrator can also resolve permission-related issues.
By addressing these common reasons, you’ll likely solve the “data analysis excel not showing” problem and get back to analyzing your data in no time.
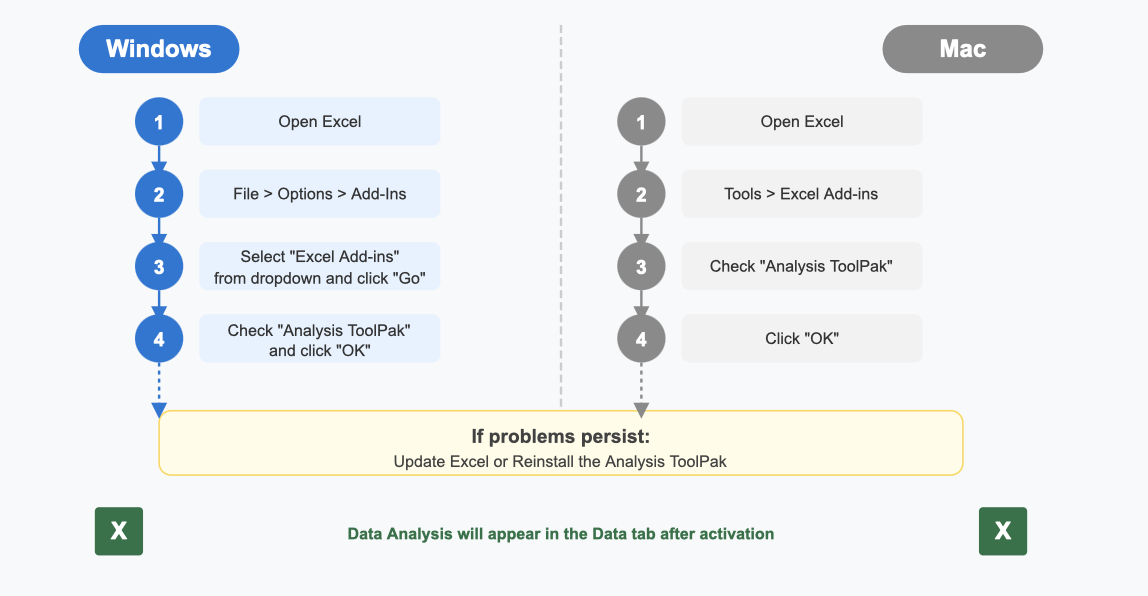
How to Enable Data Analysis Excel Not Showing on Windows

If you’re using Excel on Windows and the Data Analysis ToolPak isn’t showing, don’t worry—it’s easy to fix. Follow these steps to enable it and get back to crunching numbers.
Step-by-Step Guide for Windows Users
Here’s a simple guide to activate the Analysis ToolPak in Excel:
- Open Excel and create a new workbook.
- Click on the File tab in the top-left corner.
- Select Options from the menu.
- In the Excel Options window, click on Add-ins on the left-hand side.
- Look for the Manage dropdown at the bottom of the window. Ensure it says Excel Add-ins, then click Go.
- A list of available add-ins will appear. Check the box next to Analysis ToolPak.
- Click OK to confirm.
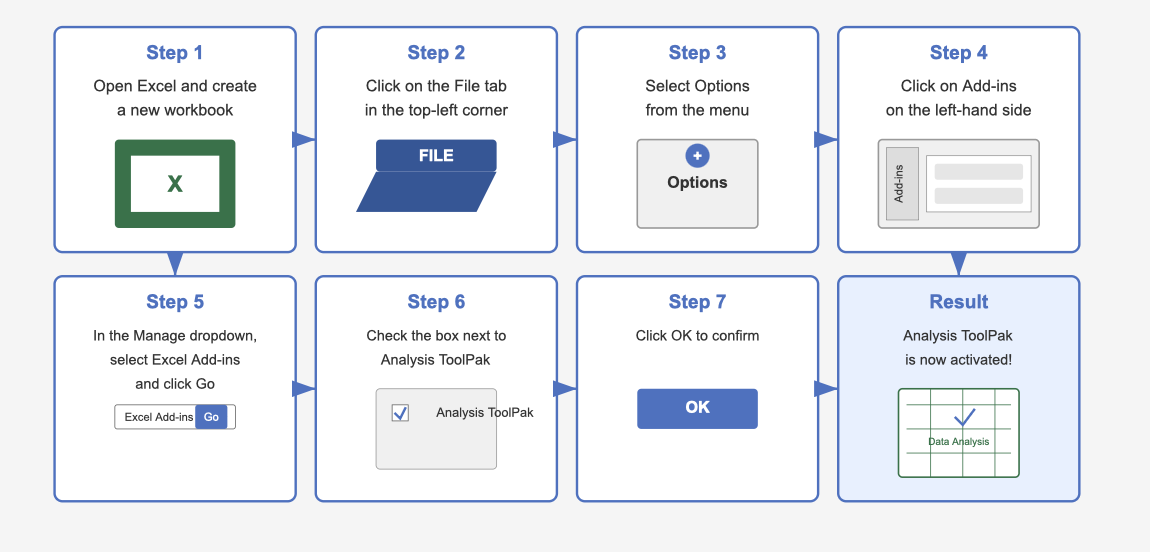
Once you’ve completed these steps, the ToolPak will appear under the Data tab in Excel. You’ll now have access to advanced data analysis features like regression, descriptive statistics, and more.
Pro Tip: If the ToolPak doesn’t show up after enabling it, try restarting Excel. Sometimes, a quick restart is all it takes to refresh the settings.
Troubleshooting Common Windows-Specific Issues

Even after enabling the ToolPak, you might encounter some hiccups. Here are common issues and how to resolve them:
- The ToolPak isn’t listed in the Add-ins menu
This usually happens if the ToolPak wasn’t installed during Excel’s initial setup. To fix this, run the Excel installer again and select the option to add missing components. - Permission problems prevent activation
If you’re unable to enable the ToolPak, try running Excel as an administrator. Right-click on the Excel shortcut, select Run as Administrator, and repeat the activation steps. - Excel version compatibility
The Analysis ToolPak is only available in Excel 2007 and later versions. If you’re using an older version, consider upgrading to access this feature. - Corrupted installation files
Sometimes, Excel’s installation files can become corrupted, causing add-ins to malfunction. Repair the installation by going to the Control Panel, selecting Programs, and choosing the Repair option for Microsoft Office.
Note: If none of these solutions work, reinstalling Excel might be necessary. Make sure to back up your files before proceeding.
By following these steps and troubleshooting tips, you’ll resolve the "data analysis excel not showing" issue and unlock Excel’s powerful analysis tools.
How to Enable Data Analysis Excel Not Showing on Mac
If you’re using Excel on a Mac and can’t find the Data Analysis ToolPak, don’t worry—it’s a common issue with a straightforward fix. Let’s walk through the steps to enable it and troubleshoot any Mac-specific problems.
Step-by-Step Guide for Mac Users
Getting the Analysis ToolPak up and running on your Mac is simple. Follow these steps:
- Open Excel and create a new workbook.
- Click on the Tools menu at the top of your screen.
- Select Excel Add-ins from the dropdown menu.
- A new window will pop up. Look for Analysis ToolPak in the list of available add-ins.
- Check the box next to Analysis ToolPak and click OK.
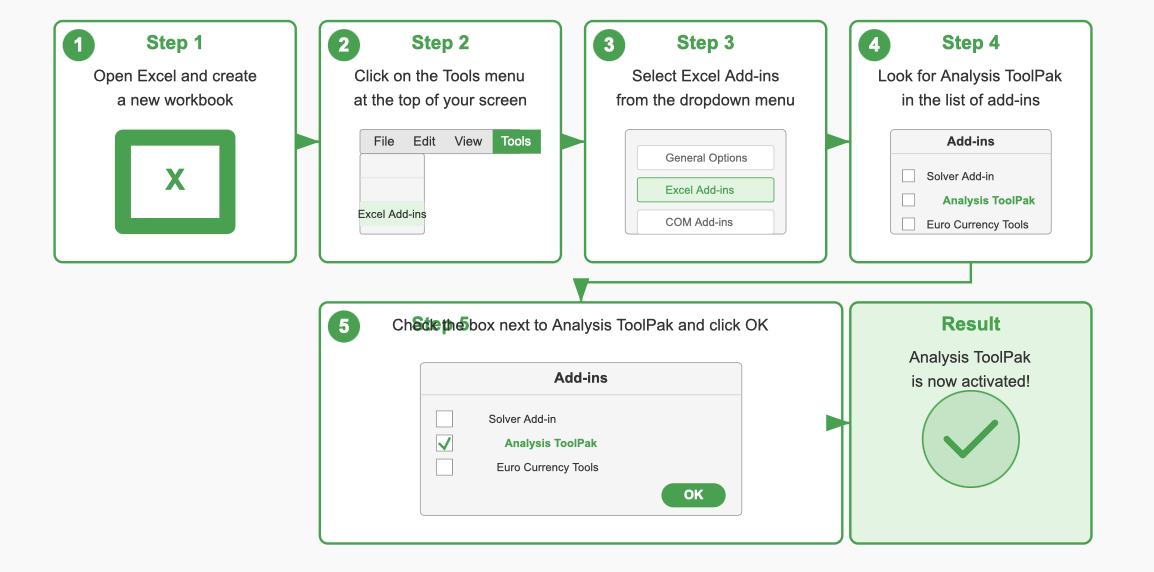
Once you’ve done this, the ToolPak should appear under the Data tab in Excel. You’ll now have access to features like regression analysis, histograms, and more.
Pro Tip: If the ToolPak doesn’t show up immediately, restart Excel. Sometimes, a quick restart is all it takes to refresh the settings.
Troubleshooting Common Mac-Specific Issues
Even after enabling the ToolPak, you might run into a few hiccups. Here’s how to tackle them:
- Add-in Not Showing?
Double-check if the Analysis ToolPak is installed. Go to Tools > Excel Add-ins and ensure the box is checked. If it’s not listed, you may need to reinstall Excel or update to the latest version. - Data Analysis Option Grayed Out?
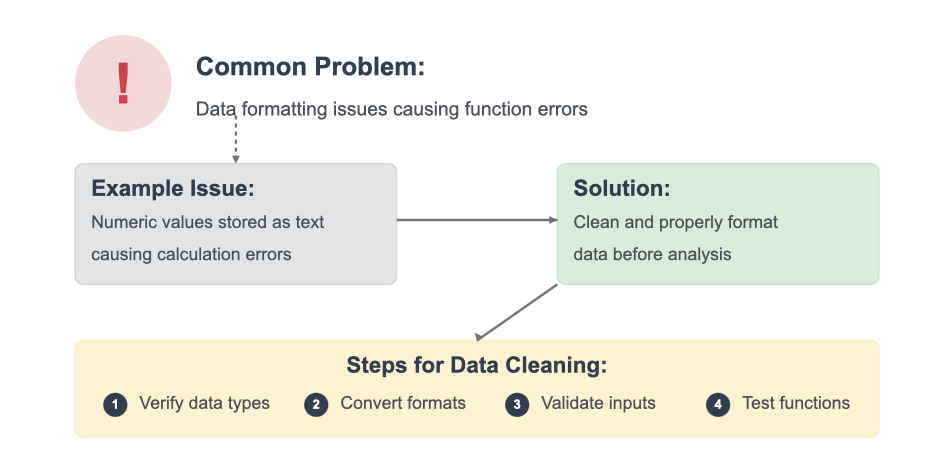
This usually means the ToolPak is disabled. Re-enable it by following the steps above. If that doesn’t work, repairing your Excel installation might help. - Functions Returning Errors?
Sometimes, errors occur because data isn’t formatted correctly. For example, numeric values stored as text can cause problems. Make sure your data is clean and properly formatted before running any analysis. - Performance Issues with Large Datasets?
Working with large datasets can slow things down. Try breaking your data into smaller chunks or use Excel’s Power Query feature for better performance.
If none of these solutions work, consider reinstalling Excel or reaching out to Microsoft Support for further assistance. Most users find that these steps resolve the "data analysis excel not showing" issue quickly and effectively.
Note: Always keep your Excel version updated. Updates often fix bugs and improve compatibility, ensuring a smoother experience.
By following these steps and troubleshooting tips, you’ll have the Analysis ToolPak up and running on your Mac in no time. Say goodbye to frustration and hello to seamless data analysis!
What to Do If Data Analysis Excel Not Showing Persists
If you’ve tried enabling the ToolPak and it’s still not showing up, don’t worry. There are a few more steps you can take to resolve the issue. Let’s dive into them.
Update Excel to the Latest Version
Sometimes, the simplest solution is the most effective. Updating Excel to the latest version can fix bugs that might prevent the Data Analysis ToolPak from working properly. Microsoft frequently releases updates to address compatibility issues and improve functionality.
Here’s why updating Excel can help:
- Updates often fix bugs that stop add-ins from installing or functioning correctly.
- The latest version ensures you have access to all features, including the Analysis ToolPak.
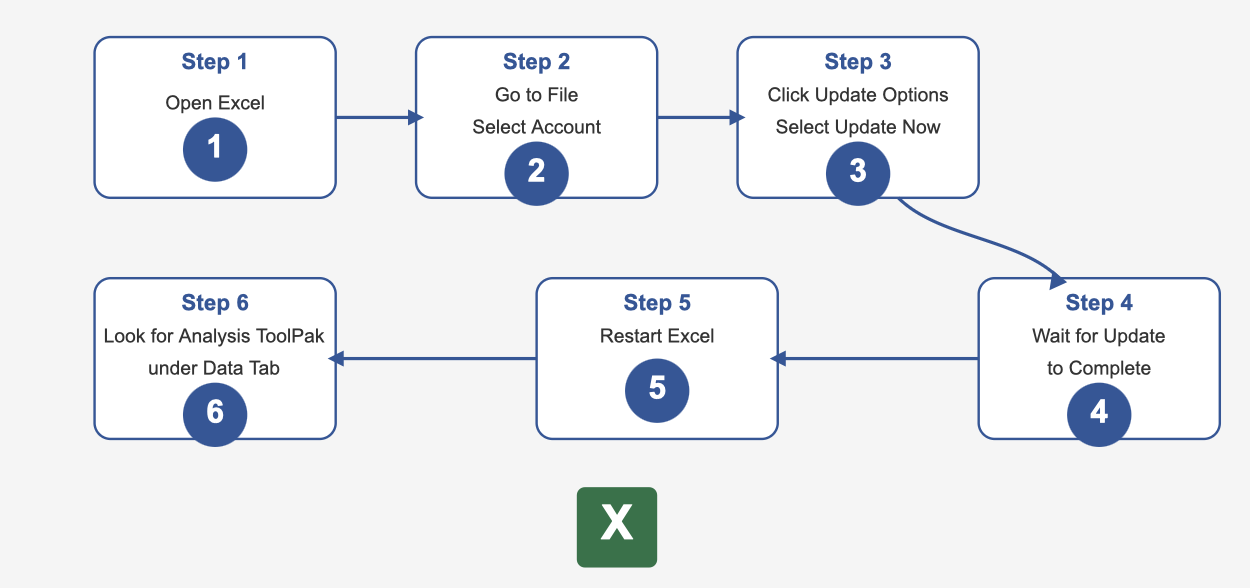
To check for updates, open Excel and go to File > Account > Update Options. Select Update Now to install the latest version. Once updated, restart Excel and see if the ToolPak appears under the Data tab.
Tip: If you’re still facing issues, double-check that the ToolPak is enabled under File > Options > Add-Ins.
Verify Add-in Settings and Reinstall the ToolPak
If updating Excel doesn’t solve the problem, the issue might lie in the add-in settings. Sometimes, the ToolPak gets disabled or isn’t installed during the initial setup. Verifying these settings can often resolve the issue.
Here’s what you should do:
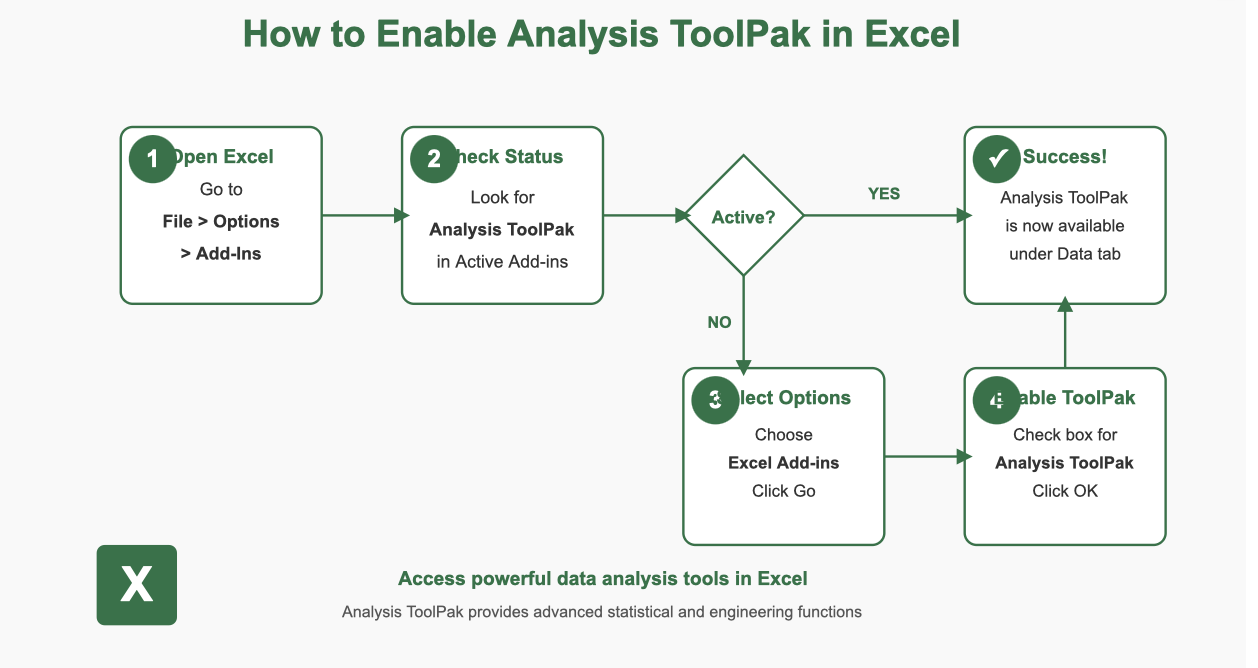
- Open Excel and navigate to File > Options > Add-Ins.
- Check if the Analysis ToolPak is listed under Active Add-ins.
- If it’s not listed, select Excel Add-ins from the dropdown menu at the bottom and click Go.
- In the pop-up window, check the box next to Analysis ToolPak and click OK.
If the ToolPak still doesn’t appear, you may need to reinstall it. Run the Excel installer again and select the option to add missing components. This ensures the ToolPak is properly installed and ready to use.
Note: Many users have found that verifying add-in settings resolves the issue quickly. It’s a simple step that can save you a lot of frustration.
Check for Operating System Compatibility
Sometimes, the problem isn’t Excel—it’s your operating system. Older systems might not support the latest Excel features, including the Analysis ToolPak. Ensuring your OS is compatible with your Excel version is crucial.
Here’s how to check:
- Confirm that your operating system meets the requirements for your version of Excel.
- If you’re using an outdated OS, consider upgrading to a newer version.
For example, if you’re running Windows 7 or an older macOS, you might encounter compatibility issues. Upgrading your OS can resolve these problems and improve overall performance.
Pro Tip: Always keep both your operating system and Excel updated. This ensures smooth functionality and access to all features.
By following these steps, you’ll likely resolve the "data analysis excel not showing" issue once and for all. Don’t let technical hiccups slow you down—get back to analyzing your data with ease!
Benefits of Resolving Data Analysis Excel Not Showing
Resolving the issue of the missing Data Analysis ToolPak in Excel opens up a world of possibilities. From unlocking advanced features to saving time and enhancing workflows, the benefits are undeniable. Let’s explore how fixing this problem can transform your data analysis experience.
Unlock Advanced Data Analysis Features
When you enable the Data Analysis ToolPak, Excel becomes more than just a spreadsheet tool. It transforms into a powerful analytical platform. You gain access to features like regression analysis, descriptive statistics, and ANOVA, all within Excel. These tools allow you to perform complex calculations without needing external software.
Here’s a quick look at what you unlock:
| Benefit | Description |
|---|---|
| Enhanced Analytical Capabilities | Transforms Excel into a robust analytical tool with various statistical and data visualization options. |
| User-Friendly Integration | Seamlessly integrates within Excel, providing tools like descriptive statistics, regression analysis, and ANOVA. |
| Streamlined Workflow | Simplifies complex data analysis processes, making it accessible and efficient for users of all skill levels. |
These features don’t just make your work easier—they also improve the quality of your insights. Whether you’re a student, a business analyst, or a researcher, these tools help you make data-driven decisions with confidence.
Save Time with Automated Calculations and Visualizations
Time is precious, and the ToolPak helps you save plenty of it. Instead of manually crunching numbers or creating charts, you can automate these tasks. The ToolPak handles the heavy lifting, allowing you to focus on interpreting results.
For example:
| Evidence | Explanation |
|---|---|
| The Data Analysis ToolPak provides advanced analytical capabilities | This feature streamlines complex data analysis processes, making it more efficient for users. |
| It allows for various statistical analyses without deep statistical knowledge | This accessibility improves decision-making based on data insights. |
Imagine running a regression analysis or generating a histogram in just a few clicks. You’ll spend less time on repetitive tasks and more time on meaningful analysis. This efficiency is a game-changer, especially when working with large datasets.
When Excel Analysis ToolPak Isn't Enough: What to Do
The Analysis ToolPak is useful for basic statistical calculations, forecasting, and regression analysis.
However, as datasets grow larger and reporting requirements become more complex, many teams encounter limitations such as:
• Manual data preparation
• Limited visualization options
• Difficulty handling large datasets
• Repetitive reporting processes
• Challenges combining data from multiple systems
If your goal goes beyond fixing a missing ToolPak button and involves building interactive dashboards, automated reports, or enterprise-scale analytics, dedicated BI tools can significantly reduce manual effort.
Enhance Your Workflow with Tools Like FineBI and FineReport
If you’re looking to take your workflow to the next level, consider integrating tools like FineBI and FineReport. These tools complement Excel by offering advanced features tailored to different user needs.
| Tool | Key Features | Efficiency Enhancement |
|---|---|---|
| FineBI | User-friendly interface, self-service capabilities, tailored analysis scenarios | Empowers business users to conduct analyses independently, saving time and resources for data analysts. |
| FineReport | Excel-like interface, suited for IT specialists | Enhances report generation speed, significantly saving time for IT personnel and improving workflow efficiency. |
FineBI empowers you to explore data by self-service analytics independently, while FineReport simplifies report creation for IT teams. Together, they enhance productivity and streamline workflows. If you’ve struggled with "data analysis excel not showing," these tools can provide a seamless alternative or complement to Excel’s capabilities.
You can try it out in the demo model below:
By resolving the issue and exploring these tools, you’ll unlock new levels of efficiency and insight. Why settle for less when you can achieve so much more?
Preventing Future Issues with Data Analysis Excel Not Showing
You’ve fixed the issue, but how do you make sure it doesn’t happen again? Let’s explore some practical steps to prevent future problems with the Data Analysis ToolPak in Excel.
Regularly Update Excel and Add-ins
Keeping Excel and its add-ins updated is one of the easiest ways to avoid issues. Updates often fix bugs, improve compatibility, and add new features. For example, Microsoft has resolved problems like reversed PivotDateFilter conditions and unexpected crashes during Quick Analysis. These updates ensure Excel runs smoothly and reliably.
Here’s a quick look at why updates matter:
| Issue Description | Fix Description |
|---|---|
| Bug with PivotDateFilter APIs where 'Before' and 'After' conditions were reversed | Fixed the bug to ensure correct filter conditions are applied. |
| Users unable to modify a PivotTable filter due to missing values in database | Resolved the issue to allow modifications even when values are absent. |
| Excel closing unexpectedly when using Quick Analysis after freezing top row | Fixed the crash issue to enhance stability during usage. |
| Warning about corrupt workbook with IFNA() formulas | Addressed the warning to prevent unnecessary alerts for valid workbooks. |
To stay ahead, check for updates regularly. Open Excel, go to File > Account > Update Options, and select Update Now. This simple habit can save you from dealing with frustrating errors later.
Backup and Restore Excel Settings
Imagine spending hours customizing Excel only to lose all your settings after a reinstall. Backing up your settings ensures you can restore them quickly if something goes wrong. It’s like having a safety net for your Excel preferences.
Here’s how you can do it:
- Export your settings by navigating to File > Options > Export Settings.
- Save the file to a secure location, like cloud storage or an external drive.
- If you ever need to restore them, simply import the saved file.
This small step can save you a lot of time and effort. Plus, it ensures your Data Analysis ToolPak and other add-ins are always configured the way you like.
Explore Alternatives Like FineVis for Advanced Data Visualization
Sometimes, Excel’s built-in tools might not meet all your needs. That’s where alternatives like FineReport come in. FineReport offers advanced data visualization features that go beyond what Excel can do. It’s designed to simplify complex data processing and improve communication with stakeholders.
Here’s how FineReport compares to traditional methods:
| Feature/Advantage | FineReport | Traditional Methods |
|---|---|---|
| Tailored analysis scenarios | Yes, for various industries | Limited customization |
| Complexity of data processing | Reduced, allowing focus on analysis | High complexity |
| Communication with stakeholders | Enhanced through visual representations | Often relies on tables |
| Preference for visual representation | Strong preference for visuals over tables | Tables are commonly used |
FineReport makes it easier to create interactive dashboards and dynamic 3D visualizations. If you’re working with large datasets or need to present data to a team, it’s a game-changer. By exploring tools like FineReport, you can elevate your data analysis and avoid running into limitations like "data analysis excel not showing."

Taking these steps will help you maintain a smooth workflow and prevent future issues. Whether it’s updating Excel, backing up settings, or exploring new tools, you’ll be ready for anything.
Alternatives to Data Analysis Excel Not Showing
If you’re still struggling with Excel’s Data Analysis ToolPak or looking for something more advanced, don’t worry. There are plenty of alternatives to explore. From powerful tools like FanRuan products to third-party add-ins and Excel’s built-in functions, you’ve got options to take your data analysis to the next level.
Using FanRuan Products for Data Analysis
FanRuan offers a suite of tools that can transform how you analyze data. If you’re looking for something beyond Excel’s capabilities, these products are worth considering. FineBI, for instance, empowers you to perform self-service analytics with ease. It’s perfect for users who want to explore data independently without relying on IT teams.
FineReport, on the other hand, is ideal for creating detailed reports with an Excel-like interface.

Here’s why FanRuan products stand out:
- FanRuan’s ANOVA tool helps you compare multiple groups effectively.
- It uncovers significant differences in data that might not be obvious at first glance.
- The tool provides a robust statistical framework, making data-driven decisions easier.
These tools don’t just simplify data analysis—they also enhance accuracy and efficiency. Whether you’re a business analyst or a student, FanRuan products can help you uncover insights that drive smarter decisions.
Exploring Third-Party Add-ins for Excel
If you’re not ready to switch tools entirely, third-party add-ins can supercharge Excel’s capabilities. Add-ins like Solver, XLSTAT, and Analysis ToolPak Pro offer advanced features for statistical analysis, optimization, and data visualization. They integrate seamlessly with Excel, so you don’t have to learn a new platform.
Here’s how third-party add-ins can help:
- They expand Excel’s functionality with specialized tools.
- Many add-ins are user-friendly and designed for specific tasks like regression analysis or forecasting.
- Some even offer free versions, making them accessible for everyone.
By exploring these add-ins, you can customize Excel to meet your unique needs. It’s like giving your favorite tool a powerful upgrade.
Leveraging Built-in Excel Functions for Basic Analysis
Sometimes, the simplest solution is the best one. Excel’s built-in functions are incredibly versatile and can handle a wide range of basic data analysis tasks. From calculating averages to creating pivot tables, these functions save time and reduce errors.
| Benefit | Description |
|---|---|
| Time Efficiency | Automates complex statistical calculations, saving time and effort. |
| Accuracy | Minimizes the risk of errors with built-in functions for accurate results. |
| Flexibility | Offers a wide range of statistical techniques for diverse analysis needs. |
| Data Visualization | Enables creation of visual data representations for easier interpretation. |
| Collaboration | Provides standardized tools that facilitate sharing and understanding among users. |
These tools are more than just time-savers. They help you derive actionable insights and shape strategies that propel your work forward. If you’re new to data analysis, Excel’s built-in functions are a great place to start.
By exploring these alternatives, you’ll find the right tools to overcome the "data analysis excel not showing" issue. Whether you stick with Excel or try something new, the key is to choose what works best for your needs.
Fixing the "data analysis excel not showing" issue is simpler than it seems. On Windows, you just need to enable the Analysis ToolPak through the Add-ins menu. On Mac, the process is equally straightforward—activate it via the Tools menu. If problems persist, updating Excel or reinstalling the ToolPak often does the trick.
Most issues can be resolved with these steps, so don’t stress. For even more powerful data analysis, check out FanRuan products like FineBI and FineReport. They offer advanced features that can elevate your workflow and make data analysis a breeze.
Click the banner below to try FineReport for free and empower your enterprise to transform data into productivity!

Continue Reading About Data Analysis
Why Care About Data Platforms? Find Out Here!
Understanding Descriptive Analytics: What It Is and How It Works
Step-by-Step Guide to Setting Up a Data Analytics Framework
Write a Killer Visual Analysis Essay in 2026!


FAQ

The Author
Lewis
Senior Data Analyst at FanRuan
Related Articles

What Recruiters Look for in a Data Analysis Portfolio: 10 Criteria to Score Yours Fast
A $1 is not judged like a school assignment. It is judged like a hiring shortcut. Recruiters, hiring managers, and analytics leads use it to answer one question fast: Can this person solve business problems with data in
Lewis Chou
May 29, 2026

What Is Data Analytics Consulting? Beginner’s Guide to Services, Deliverables, and Business Value
$1 helps organizations turn raw data into decisions they can trust. For many business leaders, the challenge is not a lack of data. It is a lack of clarity. Reports conflict, teams track different KPIs, dashboards are un
Lewis Chou
Jun 03, 2026

Data Analyst Job Description [+2026 Guide]: Compare Responsibilities, Skills, and Salary by Industry
A strong $1 does more than list tasks. It defines how a company turns raw data into business decisions, which teams the analyst supports, and what measurable outcomes the role is expected to influence. For employers, tha
Lewis Chou
Jun 02, 2026