Topological data analysis helps you uncover hidden structures in complex datasets by using concepts from topology. Unlike traditional methods, it focuses on the shape and connectivity of data, making it ideal for analyzing high-dimensional spaces. This approach has gained significant attention over the past 15 years, with applications in fields like neuroscience, oncology, and astronomy. By studying geometric features, TDA identifies patterns and relationships that conventional techniques often miss, especially in sparse or nonlinear data.
What is Topological Data Analysis?
Understanding Topology in Simple Terms
What is topology, and why does it matter for data?
Topology studies the properties of shapes and spaces that remain unchanged under continuous transformations, like stretching or bending. Unlike geometry, which focuses on measurements like angles and distances, topology emphasizes relationships and connections. For example, a coffee mug and a donut are considered the same in topology because they both have one hole. This focus on structure makes topology a powerful tool for analyzing data.
In data analysis, topology helps you uncover patterns that traditional methods might miss. It identifies features like clusters, loops, and voids, which reveal how data points connect. These insights are especially useful when working with high-dimensional or complex datasets. By applying topological principles, you can better understand the shape and structure of your data, leading to more meaningful conclusions.
Some fundamental principles of topology relevant to data analysis include:
Connectedness: Examines how different parts of a dataset relate to each other.
Number of holes: Identifies voids or gaps in the data structure.
Persistent homology: Tracks features that persist across different scales, highlighting significant patterns.
Examples of topological structures in everyday life
You encounter topological structures daily, even if you don’t realize it. Think about a subway map. The map simplifies the city’s geography, focusing on how stations connect rather than their exact locations. This abstraction mirrors how topology emphasizes relationships over precise measurements.
Another example is a social network. The connections between people form a web-like structure, where topology helps analyze clusters of friends or identify influential individuals. Even the shape of a river system, with its branching paths, reflects topological ideas by showing how water flows through connected channels.
How TDA Differs from Traditional Data Analysis
Limitations of traditional methods in handling complex data
Traditional data analysis often struggles with high-dimensional or nonlinear datasets. These methods typically rely on assumptions about data distribution or linear relationships, which may not hold in real-world scenarios. For instance, statistical techniques might overlook subtle patterns in noisy or sparse data, leading to incomplete insights.
How TDA focuses on shape, structure, and connectivity
Topological data analysis (TDA) takes a different approach by focusing on the shape and connectivity of data. It constructs multiple point clouds to capture essential temporal information, making it ideal for analyzing dynamic systems. TDA also uses tools from algebraic topology to detect global and nonlinear properties, such as loops and voids, that traditional methods often miss.
Here are some ways TDA excels:
It identifies features like clusters, loops, and voids, providing a deeper understanding of data structure.
It accommodates non-stationary data, making it robust against outliers.
It preserves essential topological features during dimensionality reduction, ensuring meaningful insights.
For example, in genomic analysis, TDA uncovers complex relationships between genes by focusing on their connectivity. In medical imaging, it detects subtle changes in tissue structure, aiding early disease diagnosis. These applications highlight how TDA’s emphasis on shape and structure leads to groundbreaking discoveries.
TDA’s use of persistence diagrams further enhances its capabilities. These diagrams summarize topological features across scales, showing which patterns persist and which fade. Features far from the diagonal in a persistence diagram often indicate significant insights, making TDA a valuable tool for analyzing complex datasets.
Key Concepts in Topological Data Analysis
Simplicial Complexes
What are simplicial complexes?
A simplicial complex is a mathematical structure that represents data in a way that captures its shape and connectivity. It consists of points, line segments, triangles, and higher-dimensional counterparts, all connected in a specific way. These complexes serve two important roles:
They act as geometric or topological spaces, making them useful for understanding the shape of data.
They function as combinatorial objects, which simplifies computational tasks.
By analyzing simplicial complexes, you can explore the structure of data through homology groups. These groups help identify features like connected components, loops, and voids across various dimensions. For example, in a dataset, a connected component might represent a cluster, while a loop could indicate a recurring pattern.
How they represent data in higher dimensions
Simplicial complexes excel at representing high-dimensional data. Two common types used in topological data analysis are:
Vietoris-Rips complex: This complex connects points within a certain distance, forming simplices that capture the dataset's connectivity. For instance, in genomic data, it can reveal relationships between genes based on Hamming distance.
Čech complex: This method constructs simplices by overlapping spheres around data points. It provides a different perspective on how data points relate to one another.
These complexes allow you to study the topology of high-dimensional datasets, uncovering patterns that might otherwise remain hidden.
Persistent Homology
The idea of persistence: tracking features across scales
Persistent homology is a key concept in topological data analysis. It tracks how topological features, such as connected components and loops, appear and disappear as you change the scale of analysis. This process, known as persistence, helps you identify which features are significant and which are noise.
For example, imagine analyzing a dataset of points scattered across a plane. At a small scale, you might see many tiny clusters. As the scale increases, some clusters merge, and loops may form. Persistent homology captures these changes, allowing you to focus on features that persist across multiple scales.
Why persistence is important for understanding data
Persistence provides a deeper understanding of your data's structure. By focusing on features that last across scales, you can identify meaningful patterns and relationships. Homology groups play a crucial role here, as they categorize features into dimensions:
Dimension 0: Connected components (clusters).
Dimension 1: Loops or cycles.
Higher dimensions: Voids and other complex structures.
This approach is particularly useful for noisy or high-dimensional datasets, where traditional methods might struggle to extract insights.
Visualizing Data with TDA
Introduction to persistence diagrams
A persistence diagram is a powerful tool for visualizing the results of persistent homology. It summarizes topological features by plotting their "birth" and "death" across scales. The x-axis represents when a feature appears, while the y-axis shows when it disappears.
How persistence diagrams summarize topological features
Persistence diagrams provide a concise summary of your data's topological structure. Here's how they work:
Red points (dimension 0) represent connected components, showing how clusters merge over time.
Blue points (dimension 1) represent loops, highlighting significant cycles that persist across scales.
For example, in a dataset of social connections, a persistence diagram might reveal small, short-lived clusters (red points) and long-lasting community structures (blue points). This visualization helps you focus on the most important features, making it easier to interpret complex datasets.
Persistence diagrams are an essential part of topological data analysis. They transform abstract mathematical concepts into actionable insights, enabling you to uncover hidden patterns in your data.
Tools and Platforms for Topological Data Analysis
Topological data analysis (TDA) relies on specialized tools and platforms to process and visualize complex datasets. These tools help you uncover hidden patterns and relationships by focusing on the shape and connectivity of data. Below, you’ll explore popular software, data integration platforms, and advanced visualization techniques that enhance TDA insights.
Software and Libraries for TDA
Popular tools for implementing TDA
Several software tools and libraries make TDA accessible and efficient. These tools provide robust features for analyzing datasets and extracting meaningful insights:
Scikit-TDA: A Python library offering curated tools for TDA.
Ripser: Known for its speed in computing Vietoris-Rips complexes.
GUDHI: Provides algorithms for simplicial complexes and persistent homology.
Dionysus: A C++ library designed for persistent homology computations.
TDA: An R package for statistical analysis of persistent homology.
TDAmapper: An R package that uses the Mapper algorithm for data analysis.
Giotto-TDA: A high-performance toolbox for topological machine learning.
These tools excel in tasks like dimensionality reduction, clustering, and feature engineering. For example, Ripser efficiently handles point cloud data, making it ideal for analyzing high-dimensional datasets.
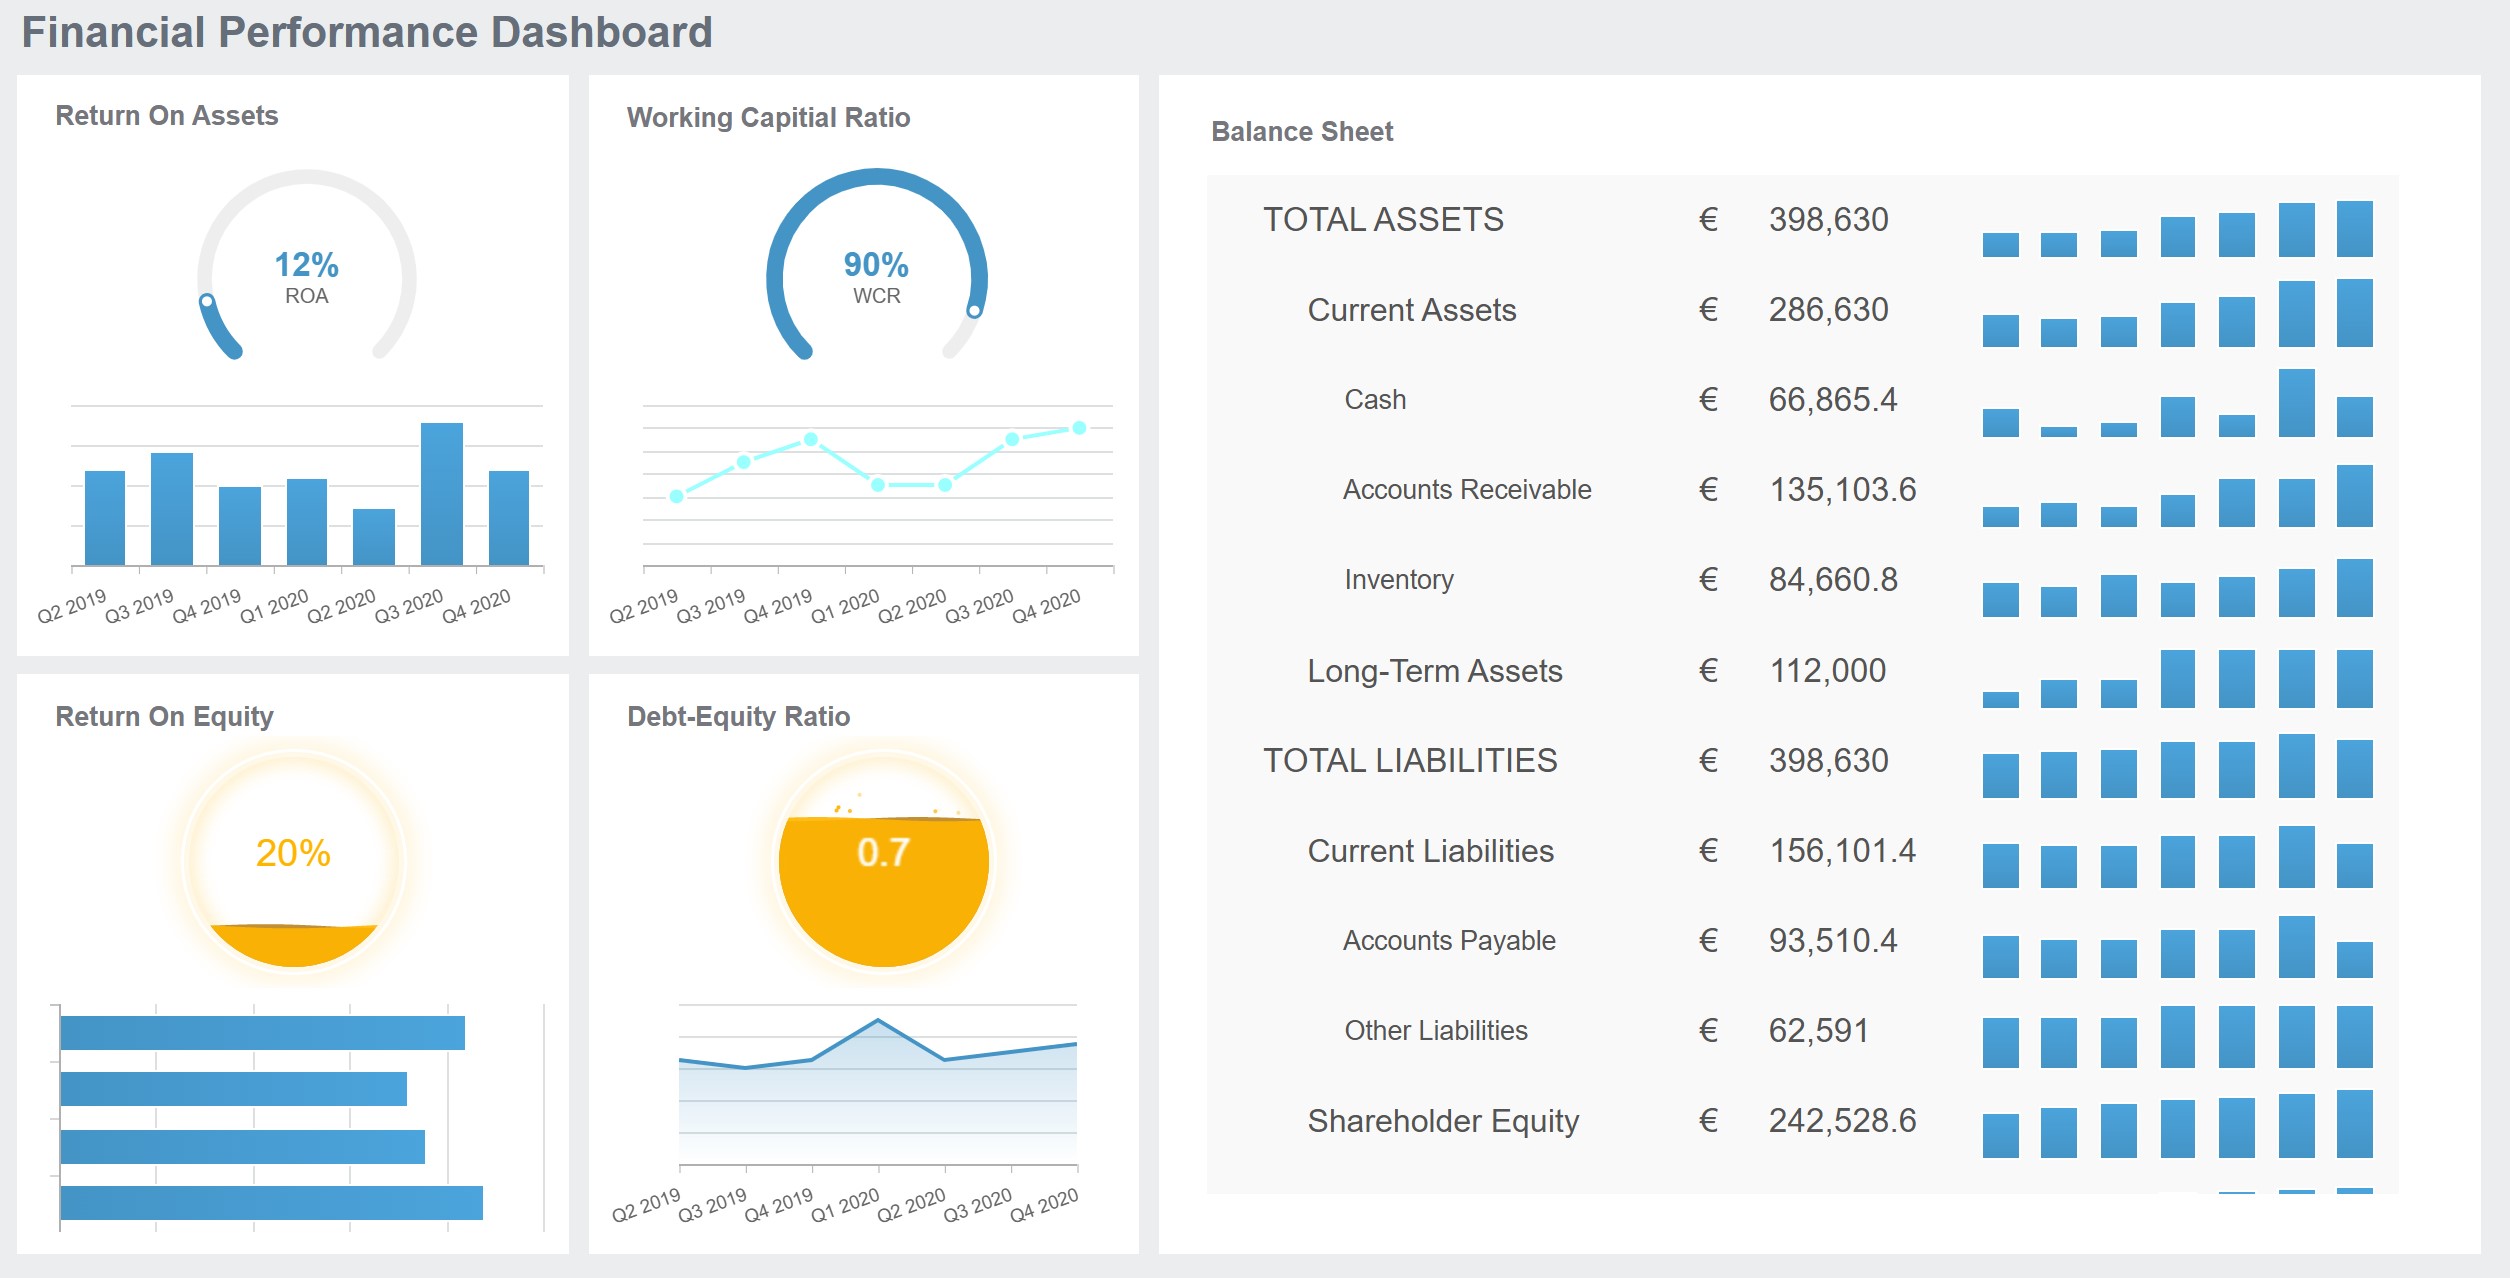
How FineBI supports data visualization for TDA insights
FineBI enhances your ability to visualize TDA results. Its self-service analytics platform simplifies the process of creating interactive dashboards. You can use FineBI to connect to diverse data sources, integrate datasets, and generate real-time visualizations. With over 60 chart types and advanced OLAP analysis, FineBI helps you explore topological features like clusters and loops. Its intuitive interface ensures that even users with minimal technical expertise can interpret TDA findings effectively.
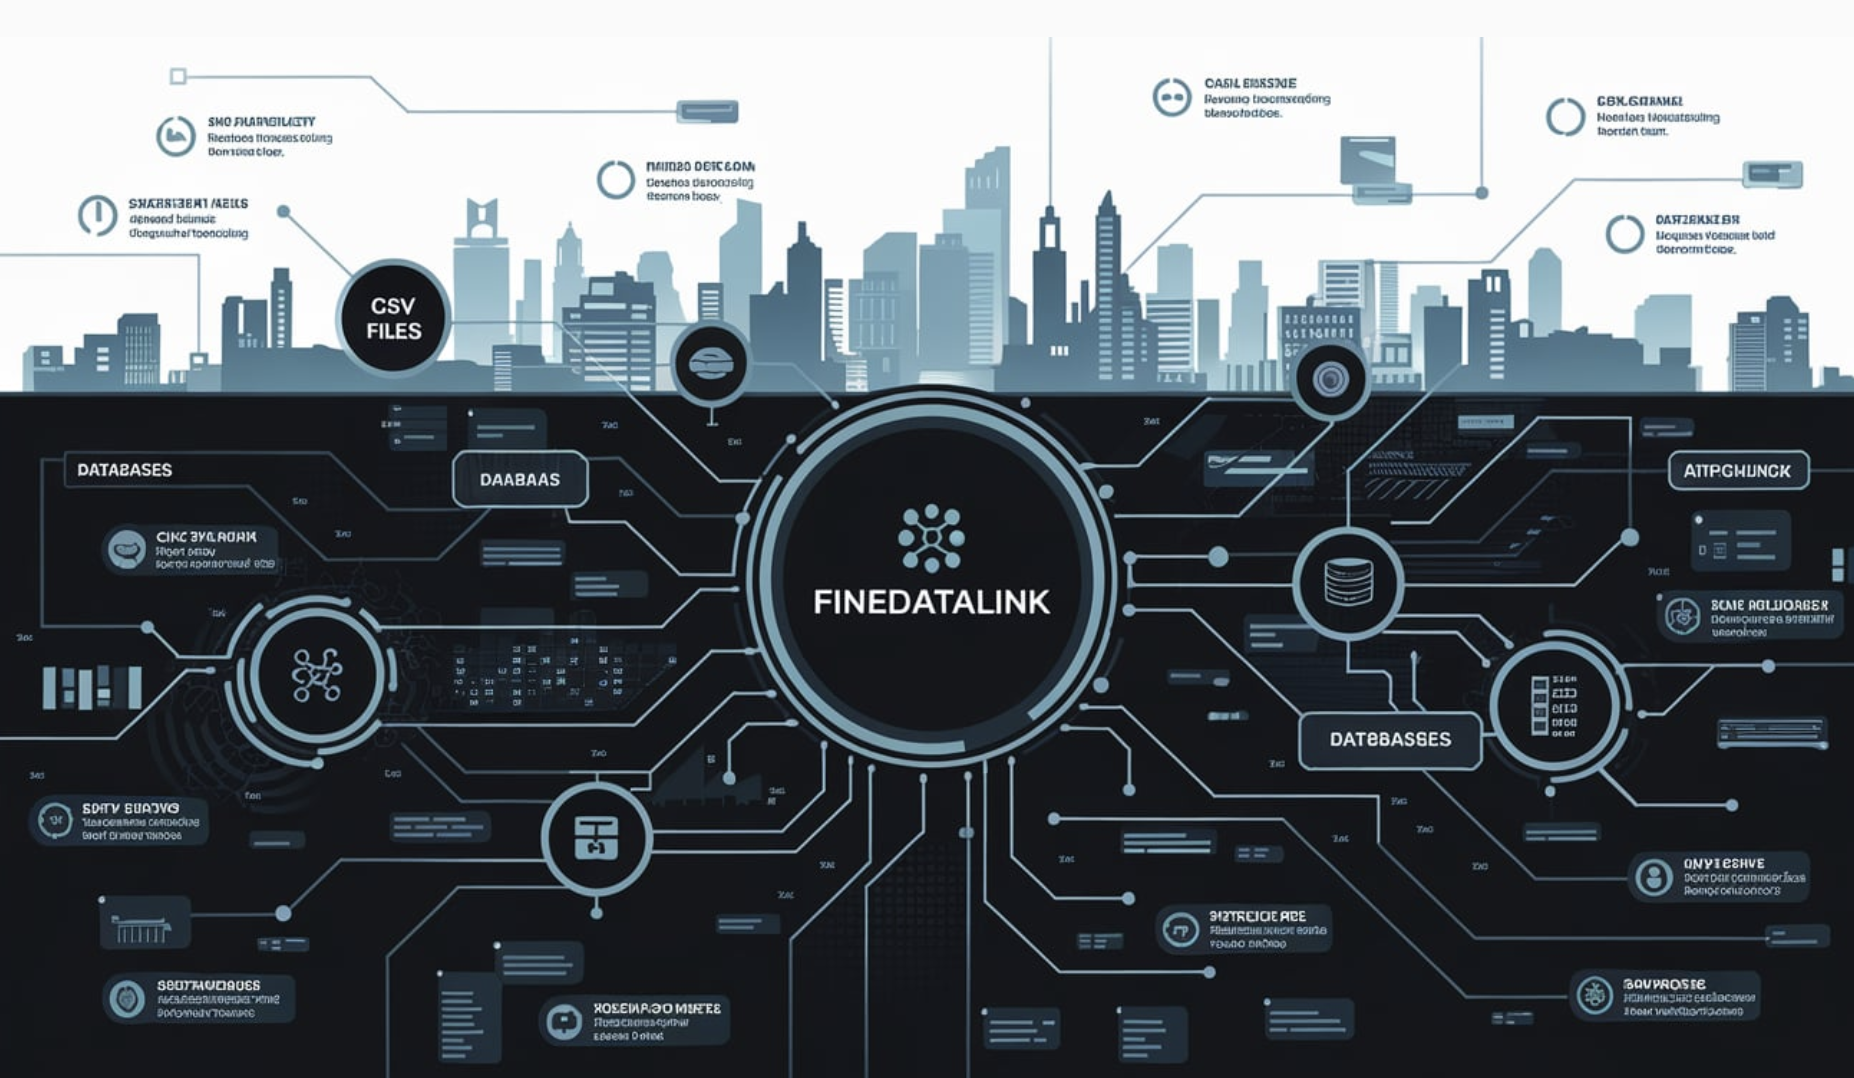
The role of FineDataLink in preparing data for TDA
Preparing data for TDA often involves integrating information from multiple sources. FineDataLink streamlines this process by offering real-time data synchronization and advanced ETL/ELT capabilities. It allows you to consolidate datasets from various systems, ensuring a unified data layer for analysis. By reducing manual effort, FineDataLink saves time and minimizes errors, making it easier to focus on uncovering topological insights.
Ensuring data quality and consistency for analysis
Data quality plays a critical role in TDA. FineDataLink ensures consistency by automating data cleansing and transformation. Its low-code platform simplifies complex workflows, enabling you to handle diverse data formats like CSV, JSON, and databases. This ensures that your dataset is accurate and ready for topological analysis, improving the reliability of your results.
Advanced Visualization with TDA
Using FineReport for interactive and dynamic visualizations
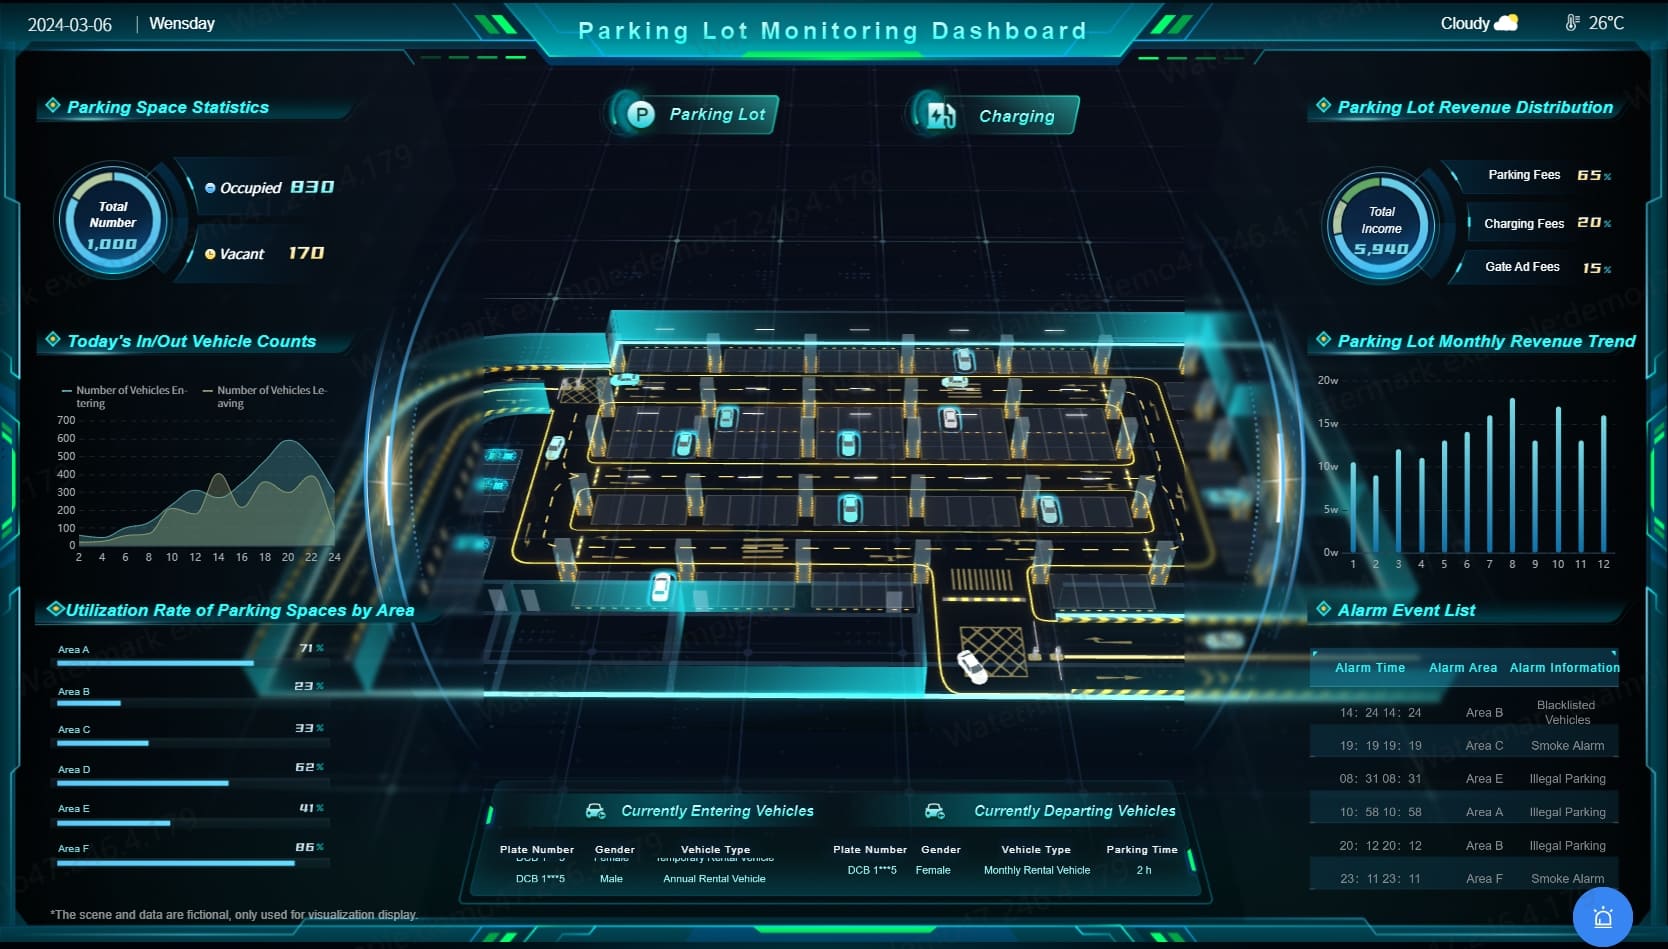
FineReport takes TDA visualization to the next level with its dynamic and interactive features. You can create 3D visualizations and customize dashboards using a zero-code drag-and-drop interface. FineReport supports real-time analytics, allowing you to monitor changes in your dataset as they occur. This makes it easier to identify persistent features like loops and voids in point cloud data.
Parking Lot Moonitoring Dashboard Created By FineReport
Enhancing TDA insights with 3D and real-time analytics
Advanced visualization techniques, such as the Mapper algorithm and barcodes, enhance your understanding of TDA results. Mapper simplifies high-dimensional data into topological skeletons, while barcodes represent features’ persistence across scales. FineReport integrates these techniques with 3D visualizations, enabling you to explore complex datasets interactively. Its adaptive design ensures seamless access across devices, making it a versatile tool for interpreting TDA insights.
FineReport empowers you to transform abstract topological concepts into actionable insights. By combining real-time analytics with advanced visualization, it helps you uncover patterns that traditional methods might overlook.
Applications of Topological Data Analysis
Topological data analysis has found its way into diverse fields, offering unique insights into complex datasets. Its ability to uncover hidden patterns and relationships makes it a valuable tool in data science and beyond.
Real-World Examples
Applications in biology (e.g., analyzing protein structures)
In biology, topological data analysis plays a crucial role in understanding the intricate structures of proteins. It helps model the three-dimensional folding patterns of proteins, revealing critical structural motifs that influence their functions. For example:
TDA identifies how proteins fold and interact, aiding in drug discovery by pinpointing active sites.
It improves diagnostics by analyzing genomic data to classify disease subtypes, paving the way for personalized medicine.
These applications demonstrate how TDA bridges the gap between biological complexity and actionable insights.
Applications in finance (e.g., market behavior analysis)
In finance, TDA provides a fresh perspective on market behavior. By analyzing high-dimensional data, it detects distinct clusters of market trends and anomalies. For instance, TDA can:
Identify patterns in stock price movements, helping investors make informed decisions.
Uncover hidden relationships between financial instruments, improving risk management strategies.
This approach enhances your ability to navigate the complexities of financial markets.
Applications in image and signal processing
TDA excels in image and signal processing by focusing on the shape and connectivity of data. It captures features like loops and voids, which are often missed by traditional methods. For example:
In medical imaging, TDA detects subtle changes in tissue structure, aiding early disease diagnosis.
In signal processing, it identifies recurring patterns in audio or communication signals, improving noise reduction techniques.
These examples highlight TDA’s versatility in handling diverse data challenges.
Benefits of Using TDA
Handling high-dimensional and noisy data
Topological data analysis offers several advantages when working with high-dimensional data:
It captures the underlying shape of data without requiring dimensionality reduction.
It focuses on persistent features, making it robust against noise and outliers.
It provides model-agnostic insights, allowing you to analyze unstructured datasets effectively.
Tools like Mapper algorithms enhance data visualization, offering intuitive representations of complex datasets.
It enriches feature representations, boosting the performance of machine learning models in tasks like clustering and anomaly detection.
These benefits make TDA an indispensable tool in modern data science.
Discovering hidden patterns and relationships
TDA uncovers hidden patterns by analyzing the topological features of data. It uses persistent homology to identify clusters, loops, and other structures that reveal latent relationships. For example:
It detects distinct clusters in noisy datasets, improving model interpretability.
It provides a robust framework for analyzing complex datasets, enabling you to uncover anomalies and structural relationships.
By focusing on the shape of data, TDA helps you gain deeper insights and make better decisions.
TDA’s ability to handle high-dimensional data and discover hidden patterns makes it a powerful application in data science. Whether you’re analyzing proteins, markets, or images, TDA provides the tools to unlock new possibilities.
Why Topological Data Analysis is Important
Addressing Challenges in Modern Data Analysis
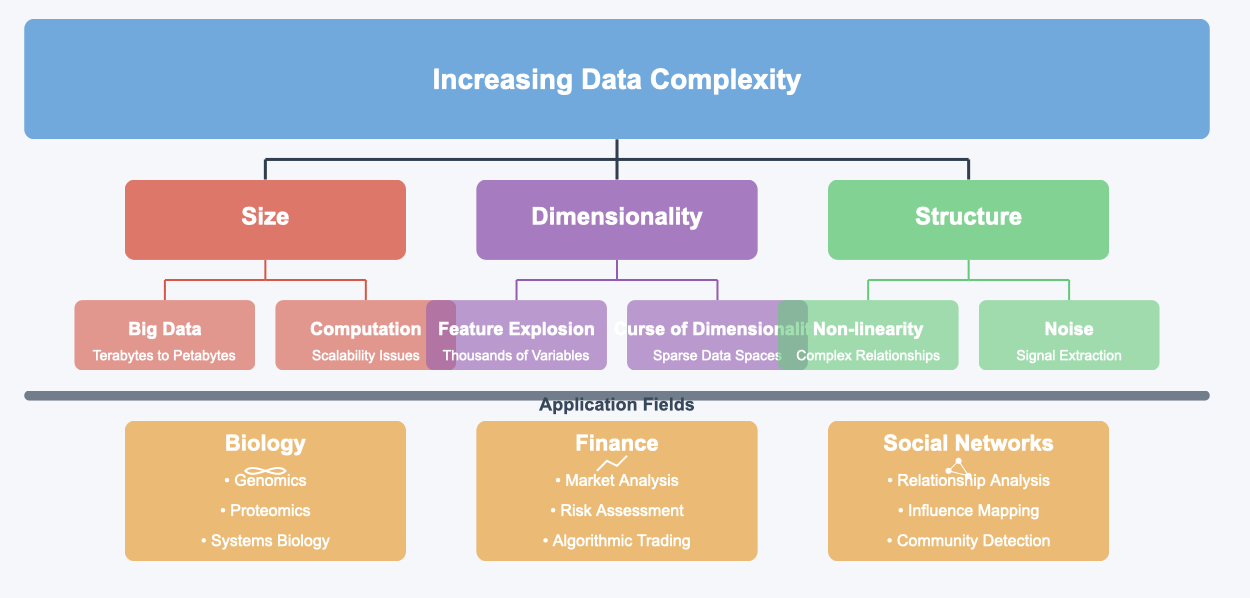
The growing complexity of data in various fields
Modern data analysis faces significant challenges due to the increasing complexity of datasets. As data grows in size and dimensionality, traditional methods often fail to capture its intricate structures. You encounter this issue in fields like biology, finance, and social network analysis, where data is not only vast but also noisy and nonlinear.
Topological data analysis (TDA) addresses these challenges effectively by focusing on the shape and connectivity of data. It uncovers geometric features, such as clusters, loops, and tendrils, that conventional techniques might overlook. For example:
TDA excels at analyzing high-dimensional datasets, revealing hidden relationships.
It interprets complex connections within data, offering insights that are valuable across diverse fields.
It handles noisy datasets robustly, ensuring that meaningful patterns are not lost.
By leveraging TDA, you can navigate the complexities of modern data and uncover insights that drive innovation.
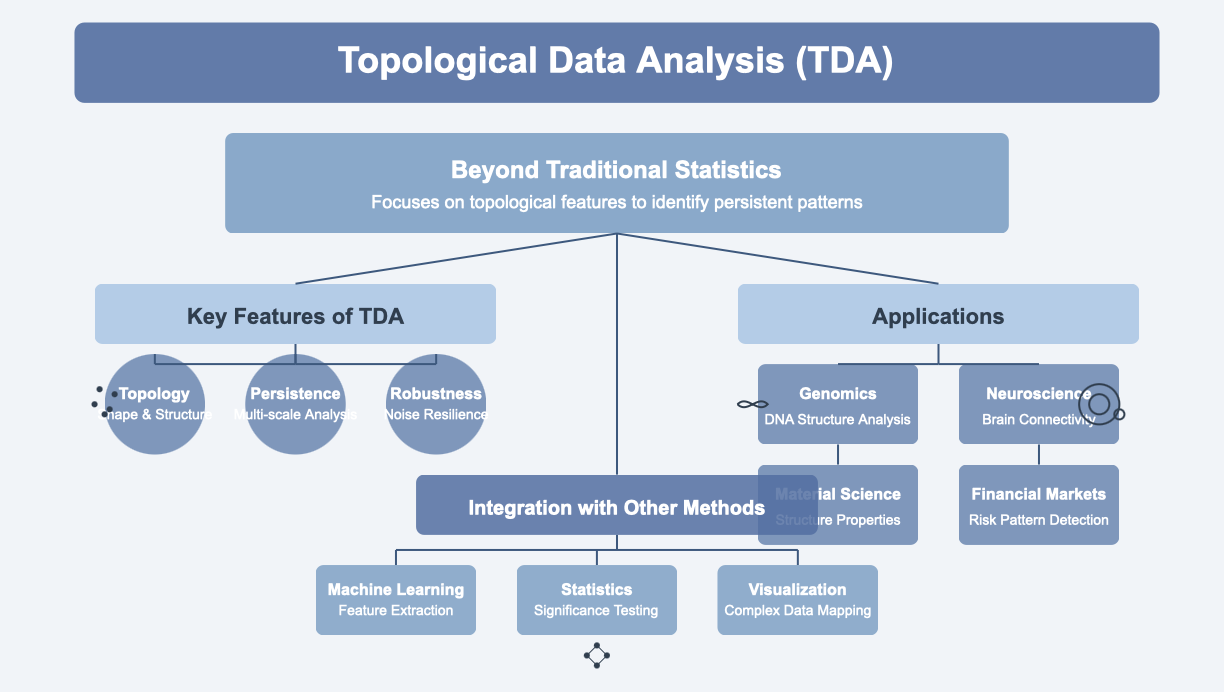
The need for tools that go beyond traditional statistics
Traditional statistical methods often rely on assumptions about data distribution or linearity. These assumptions limit their ability to analyze real-world datasets, which are often irregular and multidimensional. You need tools that can adapt to these complexities and provide deeper insights.
TDA goes beyond traditional statistics by focusing on the topological features of the data. It identifies persistent patterns across scales, helping you understand the underlying structure of your dataset. This approach is particularly useful in applications like genomic analysis, where connectivity and shape play a crucial role. TDA’s ability to integrate with other methods, such as machine learning, further enhances its analytical power.
TDA empowers you to explore data in ways that traditional methods cannot, making it an essential tool for tackling modern analytical challenges.
The Future of Topological Data Analysis
Potential advancements in TDA techniques
The future of TDA holds exciting possibilities. Researchers and practitioners are working on advancements that will make TDA even more powerful and accessible. Some key developments include:
Enhanced Algorithms: New algorithms will process large-scale data more efficiently.
Real-Time Analysis: TDA could soon provide immediate insights for dynamic systems.
Deep Learning Integration: Combining TDA with deep learning will improve data interpretation.
Visualization Tools: Advanced tools will make it easier to represent high-dimensional topological features.
Interdisciplinary collaboration between mathematicians, data scientists, and domain experts will also play a critical role in shaping TDA’s future. These advancements will expand TDA’s capabilities, enabling you to tackle increasingly complex datasets.
Expanding applications across industries
TDA’s applications are rapidly growing across various industries. In manufacturing, it supports smart factory initiatives by optimizing processes and detecting anomalies. Specific use cases include yield optimization in semiconductor production and machining chatter detection. In healthcare, TDA aids in analyzing patient data to improve diagnostics and treatment plans. Its role in finance continues to grow, offering insights into market behavior and risk management.
As industries embrace digital transformation, TDA will become a cornerstone of data-driven decision-making. Its ability to uncover hidden patterns and relationships ensures that it remains relevant in an ever-evolving landscape.
The future of TDA is bright, with advancements and applications that promise to revolutionize how you analyze and interpret data.
How FanRuan Empowers Topological Data Analysis
FanRuan provides a suite of tools that simplify and enhance topological data analysis. These tools—FineBI, FineDataLink, and FineReport—offer unique capabilities for self-service analytics, seamless data integration, and advanced visualization. By leveraging these solutions, you can unlock the full potential of TDA in your projects.
FineBI for Self-Service Analytics
Simplifying TDA insights with user-friendly dashboards
FineBI makes it easy to interpret TDA results through its intuitive dashboards. You can create interactive visualizations without needing advanced technical skills. The drag-and-drop interface allows you to explore topological features like clusters and loops effortlessly. FineBI also supports over 60 chart types, enabling you to present TDA findings in a visually compelling way.
Tip: Use FineBI’s OLAP analysis to drill down into specific topological features. This helps you uncover deeper insights into your data.
FineBI’s dashboards are designed to simplify complex TDA outputs, making them accessible to everyone in your organization. Whether you’re analyzing persistence diagrams or Mapper outputs, FineBI ensures clarity and ease of use.
Empowering teams to explore TDA results independently
FineBI empowers your team to take control of TDA insights. Its self-service analytics capabilities eliminate the need for constant IT support. Team members can independently explore datasets, apply filters, and generate reports. This fosters a culture of data-driven decision-making across your organization.
With FineBI, you can also set up role-based permissions. This ensures that sensitive data remains secure while enabling collaboration. Teams can share dashboards and insights, promoting transparency and efficiency.
FineDataLink for Seamless Data Integration
Preparing data pipelines for TDA with real-time synchronization
FineDataLink simplifies the preparation of data pipelines for topological data analysis. It integrates data from multiple sources in real time, ensuring that your datasets are always up-to-date. This real-time synchronization reduces latency and enhances the accuracy of your TDA results.
For example, you can use FineDataLink to consolidate data from relational databases, cloud platforms, and SaaS applications. This unified data layer provides a solid foundation for conducting TDA.
Supporting ETL/ELT processes for high-quality data
FineDataLink excels in ETL (Extract, Transform, Load) and ELT processes. Its low-code platform allows you to clean, transform, and prepare data with minimal effort. You can handle diverse data formats, including CSV, JSON, and XML, ensuring consistency and quality.
Note: High-quality data is crucial for reliable TDA. FineDataLink automates data cleansing, reducing errors and saving time.
By streamlining data integration, FineDataLink enables you to focus on analyzing topological features rather than managing data complexities.
FineReport for Advanced Data Visualization
Creating interactive visualizations for TDA findings
FineReport takes TDA visualization to the next level. You can create interactive and dynamic visualizations that bring your TDA findings to life. Its zero-code interface makes it accessible to users of all skill levels. FineReport supports 3D visualizations, allowing you to explore complex topological structures in an immersive way.
For instance, you can visualize persistence diagrams or Mapper outputs in 3D, making it easier to identify significant features. FineReport also offers over 60 chart types, giving you the flexibility to present your data in the most effective format.
You can try it out in the FineReport demo model below:
Leveraging adaptive design for cross-device accessibility
FineReport ensures that your visualizations are accessible across devices. Its adaptive design allows you to view dashboards on smartphones, tablets, PCs, and large screens. This cross-device compatibility ensures that you can analyze TDA results anytime, anywhere.
Emoji Insight: FineReport adapts to your workflow, whether you’re in the office or on the go.
By combining advanced visualization techniques with real-time analytics, FineReport helps you uncover patterns and relationships that traditional methods might miss.
FanRuan-en’s tools—FineBI, FineDataLink, and FineReport—empower you to harness the full potential of topological data analysis. From data integration to visualization, these solutions make TDA more accessible, efficient, and impactful.
Topological data analysis offers a unique way to uncover hidden patterns in complex datasets. Its focus on shape, structure, and connectivity makes it invaluable for analyzing high-dimensional data. Below is a quick recap of its purpose and key concepts:
Component
Description
Introduction
Helps you start exploring TDA effectively.
Conclusion
Guides you in understanding TDA's significance and applications.
Restate Practices
Encourages exercises to identify and respond to data-driven questions.
FanRuan-en's tools—FineBI, FineDataLink, and FineReport—simplify TDA by offering seamless data integration, interactive dashboards, and advanced visualizations. These tools empower you to explore TDA insights independently and efficiently. Dive deeper into TDA and discover its potential to transform your field.
Click the banner below to try FineBI for free and empower your enterprise to transform data into productivity!
What is the main purpose of topological data analysis?
Topological data analysis (TDA) helps you uncover hidden patterns and relationships in complex datasets. It focuses on the shape, structure, and connectivity of data, making it ideal for analyzing high-dimensional or noisy datasets that traditional methods struggle to handle.
How does TDA differ from traditional data analysis methods?
TDA emphasizes the geometric and topological features of data, such as loops and voids. Unlike traditional methods, which rely on assumptions about data distribution, TDA explores the underlying structure of datasets, revealing insights that might otherwise remain hidden.
What types of data can benefit from TDA?
TDA works well with high-dimensional, nonlinear, or noisy data. Examples include genomic data, financial market trends, social networks, and medical imaging datasets. Its ability to handle complex structures makes it versatile across many fields.
What tools can you use to perform TDA?
You can use tools like Ripser, GUDHI, and Scikit-TDA for computational tasks. For visualization, platforms like FineBI and FineReport simplify the process of interpreting TDA results through interactive dashboards and 3D visualizations.
Why are persistence diagrams important in TDA?
Persistence diagrams summarize topological features across scales. They help you identify which features, like clusters or loops, persist and which fade. This visualization makes it easier to focus on meaningful patterns in your data.
Can TDA integrate with machine learning?
Yes, TDA enhances machine learning by enriching feature representations. It improves clustering, anomaly detection, and dimensionality reduction. For example, TDA can preprocess data to highlight structural relationships, boosting model performance.
How does FineDataLink support TDA?
FineDataLink prepares data for TDA by integrating and synchronizing datasets from multiple sources. Its real-time data pipelines and ETL/ELT capabilities ensure high-quality, consistent data, making your analysis more reliable.
What industries are adopting TDA?
Industries like healthcare, finance, and manufacturing use TDA. It aids in tasks like disease diagnosis, market behavior analysis, and process optimization. Its ability to uncover hidden patterns makes it valuable across diverse applications.
Product Trial
FineReport
Pixel-perfect reports · Interactive dashboards · Easy data entry · Digital twins