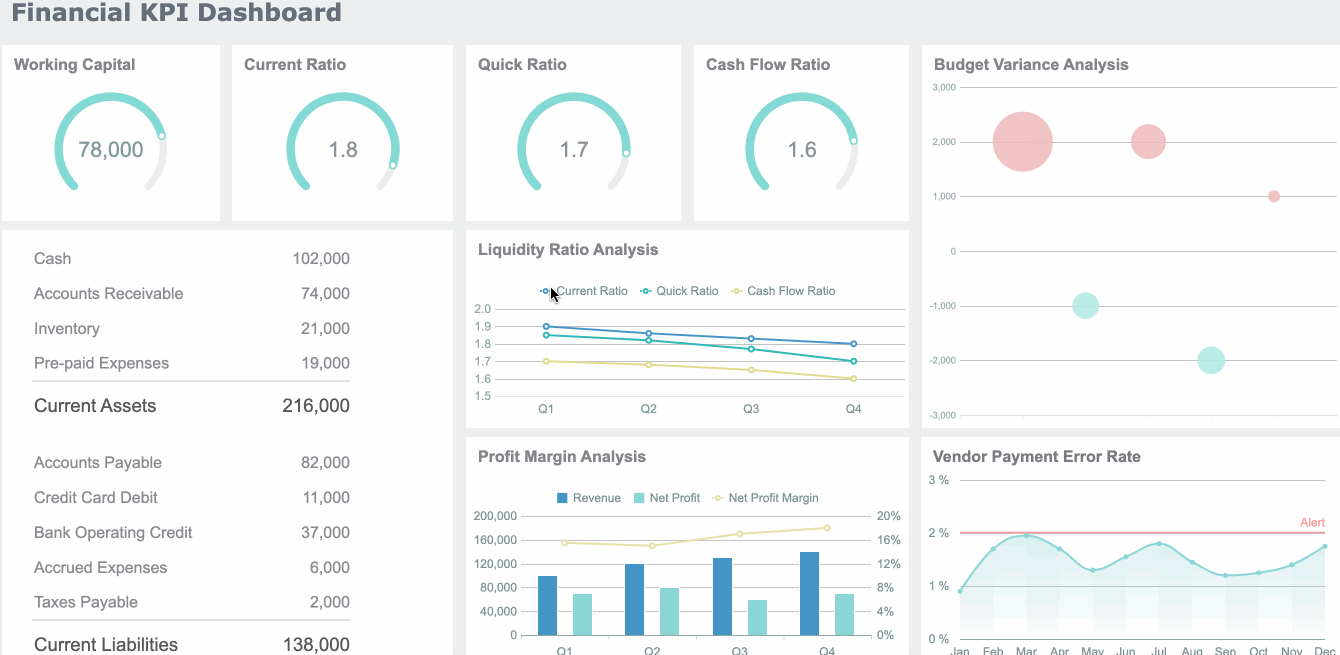
A kpi report for executive reviews is not just a prettier dashboard. It is a decision tool designed to help CEOs, CFOs, COOs, and business unit leaders assess business health, spot exceptions, understand trend movement, and decide what action is required next. If your current reporting process involves pulling numbers from multiple systems, debating definitions in every meeting, and sending slide decks that executives barely read, the problem is not only data quality. It is report design, metric governance, and workflow discipline.
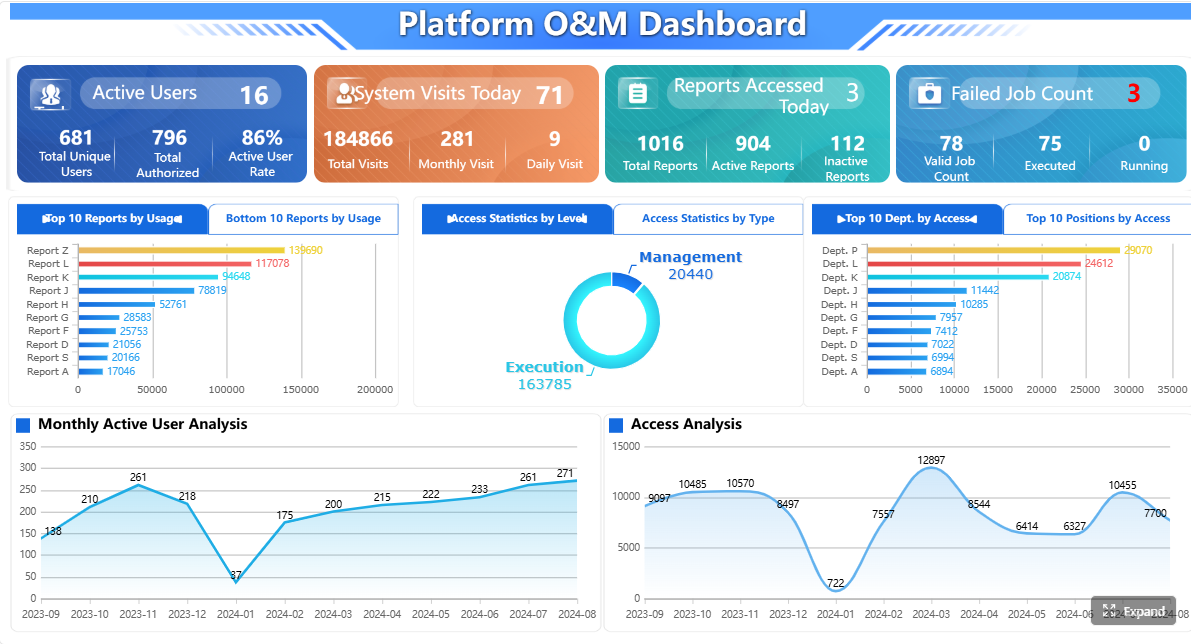
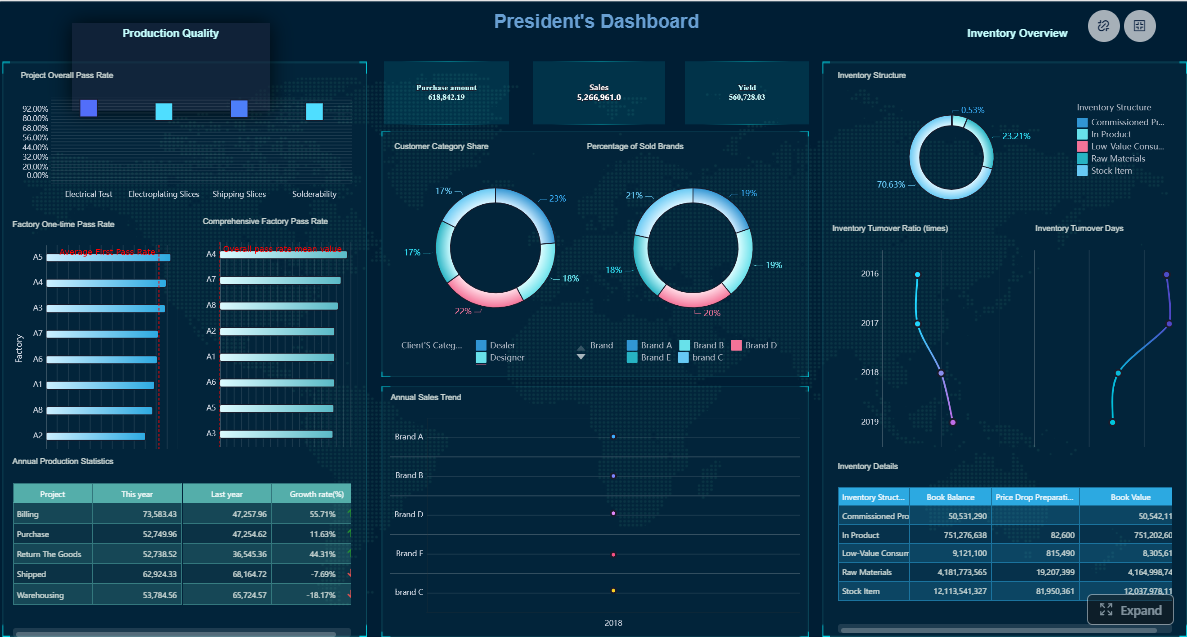
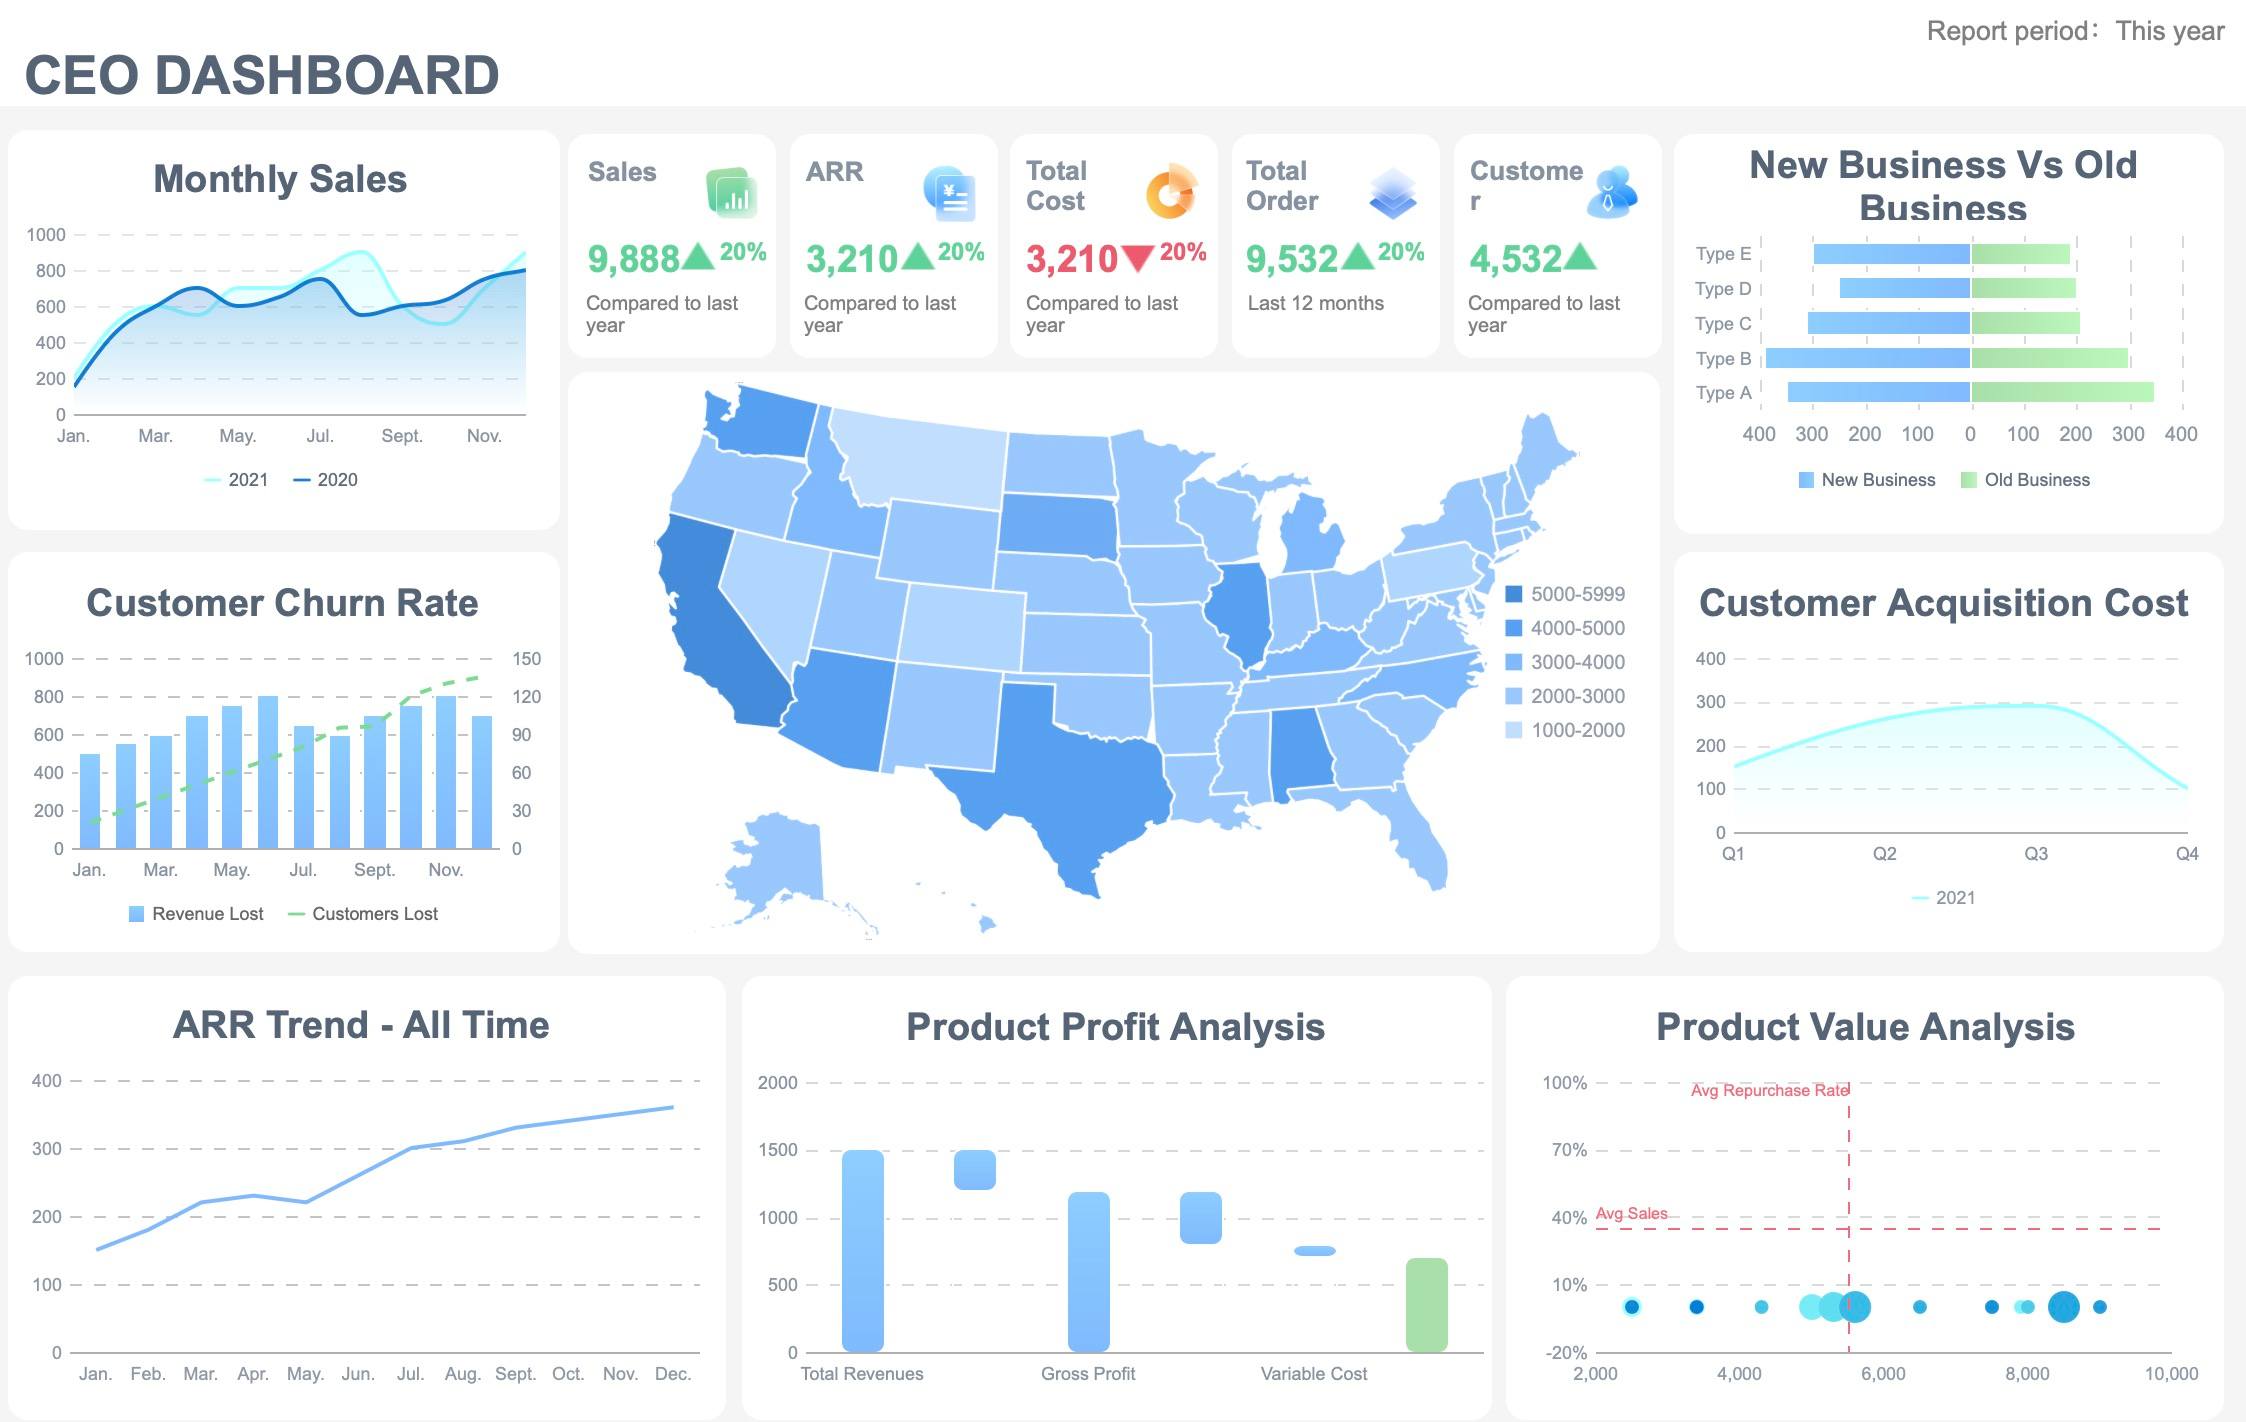
All reports in this article are built with FineReport
What a KPI report should accomplish in executive reviews
An executive kpi report should answer four questions in minutes: Are we on track, where are we off track, why did it happen, and what decision is needed now? That is very different from a working team dashboard, which often supports daily operations, granular monitoring, and drill-down analysis for managers and analysts.
A working dashboard may include dozens of live operational measures. An executive report should not. Senior leaders need a concise view of performance against strategy, not a complete data inventory. They need to see:
Overall business health
Major exceptions and risks
Trend direction over time
Performance against target
Actions, owners, and required decisions
KPI report vs. working team dashboard
The distinction matters because many organizations overload executive reviews with operational detail. A team dashboard is built for exploration. An executive kpi report is built for alignment and action.
Key differences include:
Purpose: Executive decisions versus daily task management
Time horizon: Monthly, quarterly, or strategic review periods versus near-real-time monitoring
Metric volume: A focused scorecard versus a broad operating view
Narrative depth: Decision commentary versus raw activity tracking
Audience: C-level and board-facing stakeholders versus department managers and analysts
What leaders need to see quickly
Executives scan before they read. Your report should surface priority information immediately so they can process the story at a glance.
Core elements executives expect:
Business health: A top-line view of revenue, margin, cash, customer outcomes, operational efficiency, and risk
Exceptions: Material underperformance, missed thresholds, or emerging issues
Trends: Whether results are improving, stable, or deteriorating
Decisions required: Clear actions, investment choices, escalations, or policy changes
KPIs vs. supporting metrics
One of the fastest ways to weaken a kpi report is to confuse core KPIs with all supporting metrics. KPIs are the few measures that directly represent strategic progress. Supporting metrics help explain movement in those KPIs.
For example:
KPI: Gross margin
Supporting metrics: Discount rate, production cost per unit, freight cost, product mix
If everything is labeled a KPI, nothing is truly key. Keep the top layer narrow and use supporting detail only when a KPI moves materially.
Choose the right metrics for an executive KPI report
The quality of an executive kpi report depends more on metric selection than visual design. Start with strategy, not available data. If a number does not inform an executive decision, it probably does not belong in the main report.
Start with business goals and decision-making needs
Every KPI should map to a strategic objective, a business owner, and a review cadence. This creates accountability and prevents reports from becoming static collections of numbers with no operational consequence.
A practical KPI design structure includes:
Strategic objective: What business outcome this KPI supports
KPI definition: The exact measure and formula
Owner: The accountable leader
Target: The expected threshold or goal
Cadence: Weekly, monthly, quarterly, or rolling review
Decision use: What management will do if the KPI changes
Key Metrics (KPIs)
For most executive reviews, the strongest KPI set is a balanced mix across growth, efficiency, risk, and customer outcomes.
Revenue growth: Measures topline expansion versus target or prior period
Gross margin: Tracks profitability after direct costs
Operating margin: Shows efficiency of the core operating model
Cash flow / operating cash flow: Indicates liquidity and sustainability
Customer retention rate: Reflects loyalty and recurring value
Customer acquisition cost: Measures efficiency of growth investment
On-time delivery / service level: Reveals operational execution quality
Cycle time: Tracks speed across sales, production, fulfillment, or service processes
Forecast accuracy: Shows planning reliability and demand visibility
Separate leading indicators from lagging indicators
Strong executive reporting includes both predictive and outcome measures. Lagging indicators tell leaders what has already happened. Leading indicators help them act before results deteriorate.
Lagging indicators often include:
Revenue
Profit
Churn
Net cash flow
Market share
Leading indicators often include:
Pipeline coverage
Conversion rate
Backlog quality
Inventory turns
Customer support response time
Employee capacity utilization
A balanced kpi report combines both. If you show only lagging metrics, executives discover problems too late. If you show only leading indicators, they lose confidence because outcomes are not confirmed.
Add targets, benchmarks, and context
A KPI without context forces executives to do interpretation work during the meeting. Your report should do that work in advance.
Each KPI should include:
Target threshold: What success looks like
Actual result: Current performance
Variance: Difference from target, budget, or forecast
Historical comparison: Prior month, quarter, or year
Benchmark if relevant: Internal peer, regional unit, or industry baseline
Brief commentary: Why the movement matters
Only highlight movement that is material. Executive attention is expensive. Use it on metrics that changed meaningfully or require intervention.
Design a clear layout executives can scan in minutes
Good executive report design is about speed of comprehension. If the audience has to hunt for what matters, the kpi report has already failed.
Use a one-page summary first
Start with an executive summary page that functions like a scorecard. Put the most important information at the top: top KPIs, performance status, and major takeaways.
A clean summary page should include:
5 to 10 top KPIs
Status indicators such as green, amber, red
Variance to target
Short trend indicators
Two to four key takeaways
Open decisions or escalations
Then group the rest of the report by business function or strategic theme, such as:
Financial performance
Sales and pipeline
Operations and delivery
Customer and service
Risk and compliance
Visualize performance without clutter
The best executive visuals are simple and consistent. Use charts that reduce interpretation time.
Recommended visuals:
KPI cards: For actual vs target snapshots
Line charts: For trend over time
Bar charts: For variance or comparison across units
Sparklines: For quick movement indicators
Traffic-light status: For threshold signaling
Avoid:
Too many chart types on one page
Overloaded tables
3D charts or decorative effects
Inconsistent time scales
Unlabeled variance logic
Consistency matters. If red means below threshold on one page, it must mean the same everywhere.
Add a short narrative for decisions and next steps
Numbers alone rarely close the loop. A strong kpi report includes a short narrative that turns data into decision support.
For each exception or high-priority section, add:
What happened
Why it happened
What the impact is
What action is recommended
Who owns the action
When follow-up is due
This narrative should be brief and plain-language. Executives do not need essay-length analysis. They need clarity.
Build the KPI report creation workflow from data collection to review
Most reporting pain does not come from visualization. It comes from fragmented data, weak ownership, and inconsistent reporting routines. To scale a reliable kpi report, you need a repeatable workflow.
Standardize data sources and definitions
Before automating anything, define the reporting foundation. Every KPI should have a documented standard.
Core elements to standardize:
Metric name: The agreed business label
Calculation logic: Formula and inclusion rules
Data source: ERP, CRM, finance system, spreadsheet, API, or warehouse
Refresh frequency: Daily, weekly, monthly
Owner: Team responsible for accuracy
Usage notes: Known limitations or interpretation rules
This reduces meeting-time disputes and establishes a common data language across teams.
Create a repeatable reporting process
A high-trust executive kpi report should follow a predictable production cycle. Define the process upfront so reporting does not depend on heroic manual effort.
A practical workflow looks like this:
Collect data from source systems on an agreed schedule
Validate numbers against prior periods, thresholds, and source owners
Generate scorecards and charts using a standard template
Draft commentary for material changes, wins, risks, and actions
Review and approve with KPI owners or department leaders
Distribute before the meeting so executives can pre-read
Track decisions and follow-ups after the review
This is where many organizations gain immediate efficiency. Once the process is defined, reporting shifts from ad hoc production to operational discipline.
Automate KPI report updates where possible
Automation is essential if your reporting cadence is weekly or monthly across multiple business units. It reduces manual effort, improves consistency, and shortens review cycles.
Key automation opportunities include:
Connecting ERP, CRM, finance, and operational systems directly to reporting tools
Scheduling data refreshes
Reusing KPI report templates
Auto-populating scorecards and charts
Triggering exception alerts when thresholds are breached
Generating recurring reports for monthly or quarterly reviews
Automation should not remove governance. Add quality checks such as:
Variance thresholds
Missing data alerts
Source refresh checks
Owner approval steps for sensitive metrics
Apply best practices and avoid common KPI report mistakes
A well-designed kpi report earns executive adoption because it respects attention, supports decisions, and stays tied to strategy. Below are practical recommendations from an implementation perspective.
Best practices that improve executive adoption
1. Keep the KPI set tight
Use a focused set of indicators. Most executive reviews perform best with roughly 5 to 10 core KPIs on the summary page.
2. Design for decisions, not decoration
Every KPI should support a management conversation. If a metric is interesting but not actionable, move it out of the executive layer.
3. Review KPI relevance regularly
As strategy changes, the report should change too. Retire outdated metrics and add new ones only when they matter.
4. Separate summary from deep-dive analysis
Give executives a one-page summary first, then supporting pages only for exceptions and critical movements.
5. Use standardized commentary
Create a simple format for notes: issue, cause, impact, action, owner, due date. This improves consistency across departments.
Common mistakes to avoid
The most common reporting failures are not technical. They are structural.
Reporting too many metrics at once
Mixing strategic KPIs with unrelated operational detail
Showing numbers without targets or historical context
Using inconsistent definitions across teams
Failing to identify owners and actions
Treating the report as a passive status document
Rebuilding the report manually every cycle
Actionable best practices for implementation
If you are building or redesigning an executive kpi report, follow this rollout sequence:
Align on executive decisions first
Interview stakeholders and identify which recurring decisions the report should support. Then choose KPIs accordingly.
Document KPI standards before visual design
Finalize definitions, formulas, owners, and refresh timing so the report is trusted from day one.
Prototype a one-page summary and test scan speed
Ask leaders to review it in under three minutes. If they cannot understand priorities quickly, simplify.
Create an exception-driven reporting cadence
Standard pages should remain stable while commentary and deep dives focus only on material changes.
Automate refresh and distribution in phases
Start with the highest-value recurring sections, then expand to full workflow automation after validation.
Board review: Fewer metrics, stronger narrative, strategic outcomes, major risks, and action priorities
The rule is simple: adapt detail, not direction. Everyone should see the same business story, just at the right level of abstraction.
Build it faster with FineReport
Building this manually is complex; use FineReport to utilize ready-made templates and automate this entire workflow.
Get Ready-to-Use Dashboard Templates in Fine Gallery
FineReport is well suited for executive kpi report scenarios because it supports the full reporting chain: multi-source data integration, standardized report templates, dashboard creation, automated scheduled distribution, and enterprise-grade control over access and maintenance. Instead of stitching together spreadsheets, presentation slides, and disconnected BI views, teams can build a more reliable reporting system in one platform.
An executive KPI report should show overall business health, performance against target, trend direction, major exceptions, and the actions or decisions required next. It should stay focused on the few measures that directly support strategic goals.
A KPI report is built for executive review and decision-making over a set period, usually with targets, trends, and commentary. A dashboard is often used for ongoing monitoring and deeper exploration of operational data.
Most executive reports work best with a small set of high-priority KPIs rather than a long list of metrics. Keeping the top layer narrow makes it easier for leaders to scan results quickly and focus on decisions.
Start with strategic objectives, then select KPIs that clearly measure progress toward those goals and support specific management decisions. Each KPI should also have a clear definition, owner, target, and review cadence.
Automate data collection from source systems, standardize metric definitions, schedule report refreshes, and distribute updates on a fixed cadence. Tools like FineReport can help reduce manual work and keep executive reporting consistent.
Product Trial
FineReport
Pixel-perfect reports · Interactive dashboards · Easy data entry · Digital twins