A business research report should do one job exceptionally well: help executive teams make a decision with more confidence and less delay. If your leadership team is drowning in slides, fragmented market updates, and disconnected data points, the problem is not a lack of information. It is a lack of decision-ready insight. The most useful reports reduce uncertainty, highlight strategic implications fast, and show what leaders should do next.
Click To Try The Dashboard
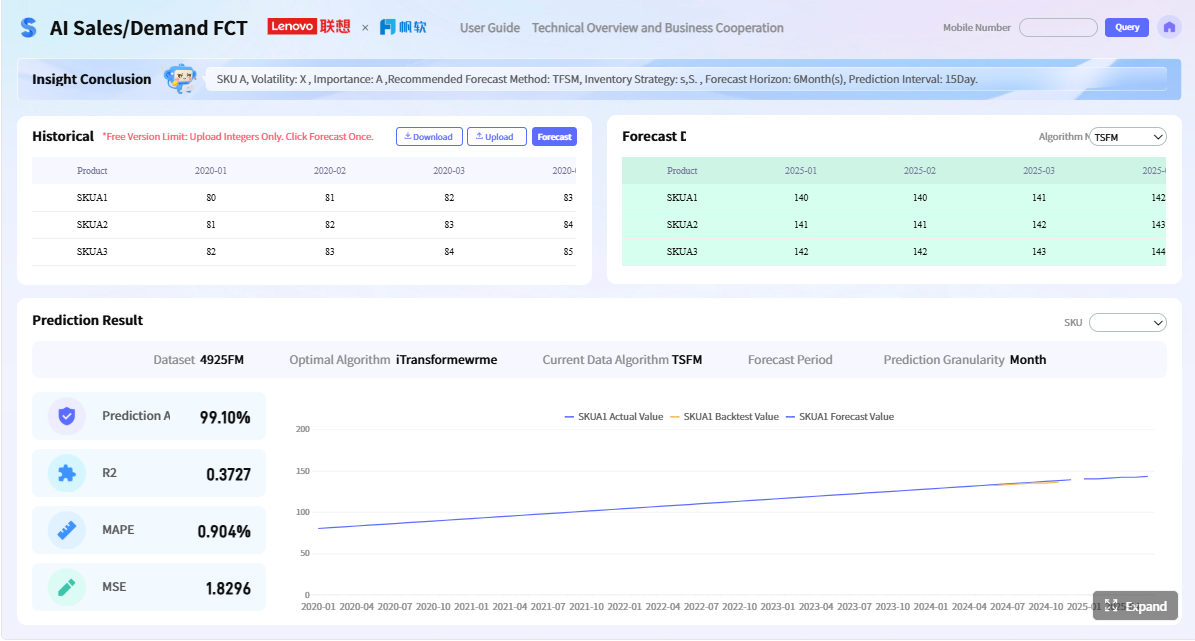
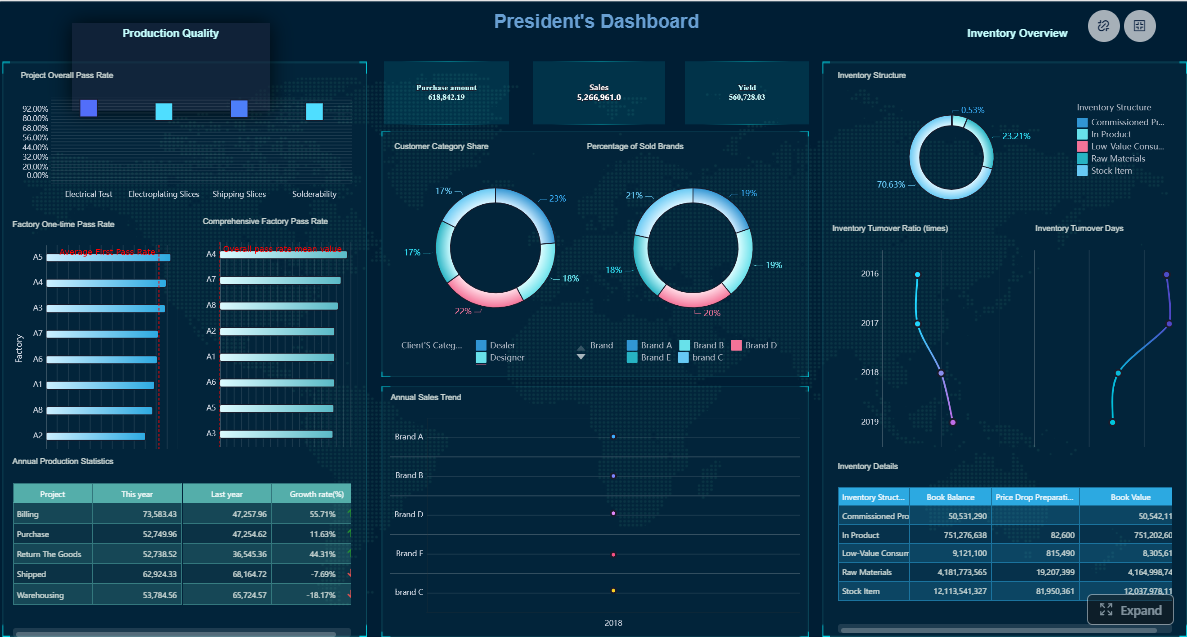
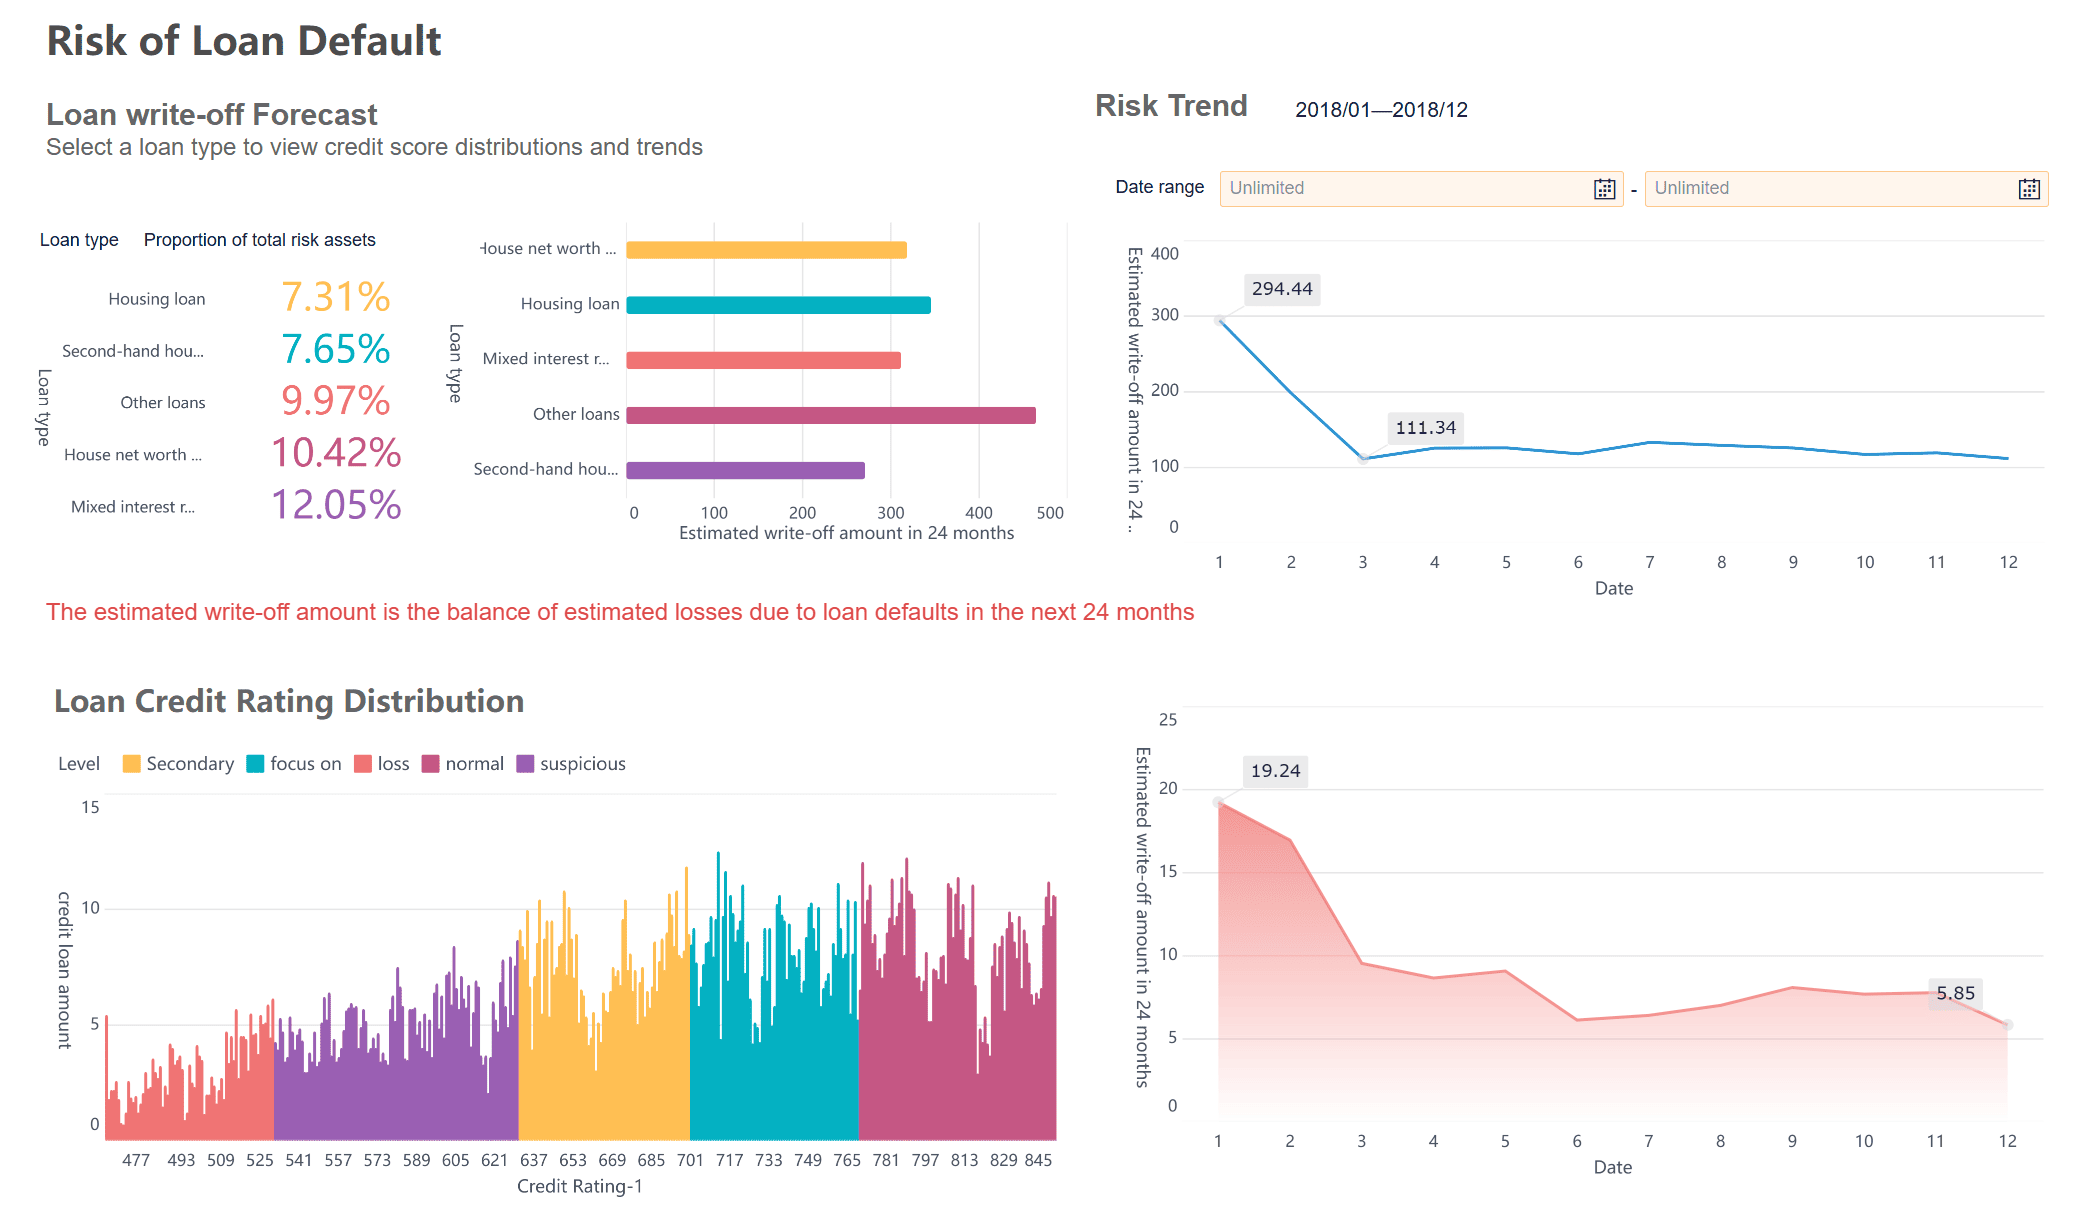
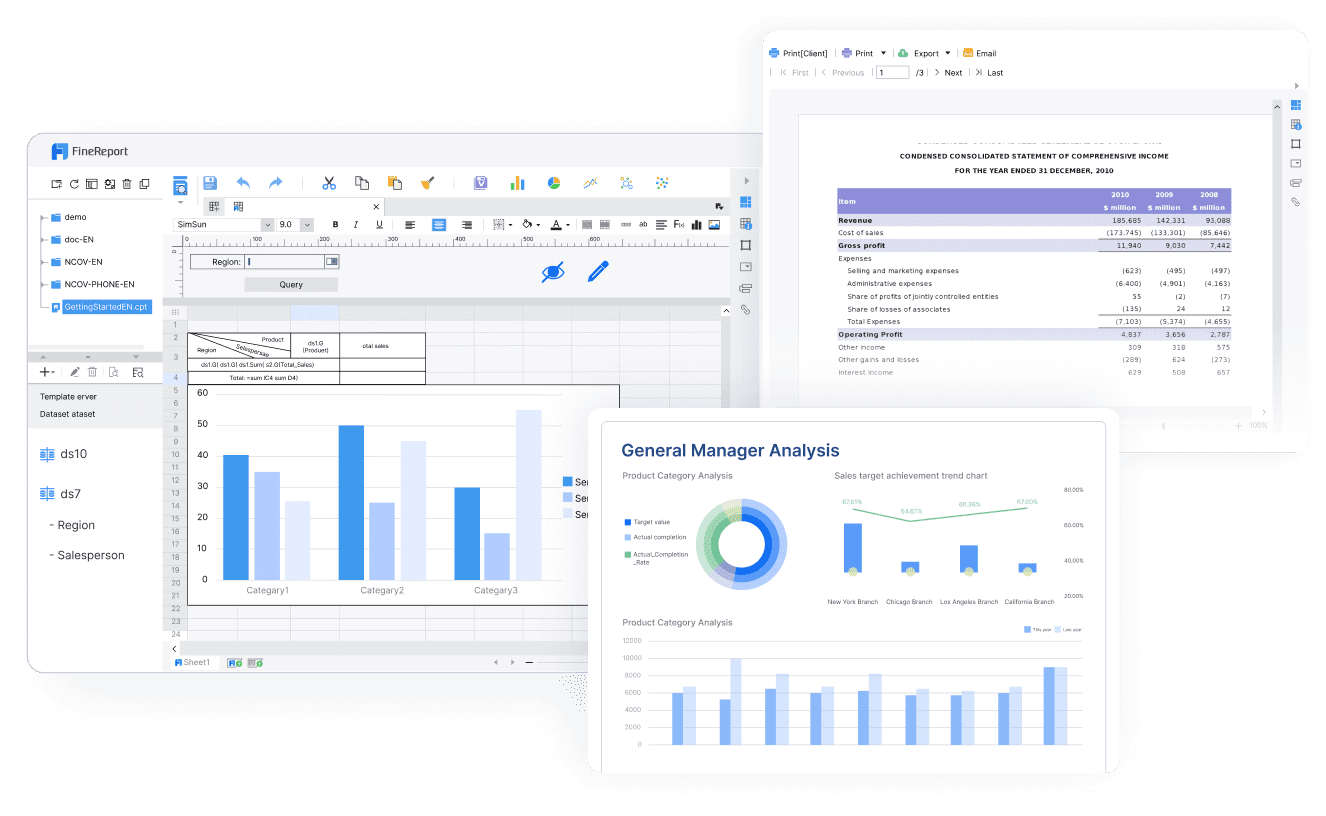
All reports in this article are built with FineReport
What makes a business research report useful to executive teams
A useful business research report is not a document that merely collects facts. It is a structured decision tool built to support a strategic move, evaluate alternatives, or reduce risk before a major investment, expansion, pricing shift, or operational change.
Executives usually read under pressure. They need four things immediately:
Clarity: what is happening, why it matters, and what action is recommended
Speed: key points surfaced early, without forcing them to dig through appendices
Evidence: credible data, transparent assumptions, and defensible logic
Business impact: direct implications for revenue, cost, risk, market position, or execution
A report becomes decision-ready when it goes beyond summarizing information and answers the questions leaders actually ask:
This guide walks through a practical seven-step process to create a business research report that executives will actually read, trust, and use.
The core framework executives expect in a business research report
Before writing, align on the core elements that make a report useful in leadership settings. These are the building blocks that separate a polished document from an actionable management tool.
Core elements of a decision-ready report
Business question: The specific decision or problem the report is designed to support
Decision context: Timing, stakeholders, constraints, and strategic relevance
Research scope: What is included, excluded, and why
Evidence base: Internal and external data sources used to support conclusions
Analysis logic: How raw data was compared, interpreted, and prioritized
Strategic implications: What findings mean for growth, cost, risk, or competitiveness
Recommendations: Clear actions tied to owners, timelines, and expected outcomes
Confidence and limitations: Where the evidence is strong, weak, or incomplete
Key Metrics (KPIs) to include in a business research report
The exact KPIs vary by industry and use case, but executive teams usually expect a compact set of high-value metrics that connect evidence to business outcomes.
Market size: The current revenue or volume potential of the target market
Market growth rate: Expected growth over time, signaling expansion potential or decline
Customer demand indicators: Measures such as inquiries, conversion intent, usage trends, or survey demand
Competitive share: Relative position of major competitors in the market
Price positioning: How your pricing compares with market alternatives
Customer acquisition cost: The estimated cost to win a new customer or account
Revenue impact: Projected upside from each strategic option
Margin impact: Expected effect on profitability, not just top-line growth
Time to value: How quickly the business can realize benefits after implementation
Risk exposure: Operational, financial, regulatory, or market threats tied to each option
Confidence level: A practical rating of how reliable the evidence is behind each finding
Resource requirement: Headcount, budget, systems, or partner support needed to execute
Step 1: Start with the business question and decision context
The first mistake most teams make is starting with data collection before defining the decision. That creates bloated reports that are technically correct but strategically weak.
Identify the decision the leadership team must make
Start by naming the decision in plain language. Examples:
Should we enter this market in the next 12 months?
Which customer segment should receive the next growth investment?
Should we build, buy, or partner?
Do competitor moves require a pricing response?
Then define the context around that decision:
Timing: When does leadership need to decide?
Stakeholders: Who will approve, influence, or execute the decision?
Constraints: Budget, regulatory issues, operational capacity, geography, or data limits
A strong research question narrows the work. “Analyze the market” is too broad. “Assess whether expanding into the mid-market segment in Southeast Asia can generate positive margin within 18 months” is far more useful.
Set scope, audience, and success criteria
Once the decision is clear, define what the report will and will not cover.
Include:
The markets, segments, competitors, and time periods in scope
The intended audience, such as CEO, CFO, COO, or business unit leaders
The expected output, such as a written report, executive summary, and board presentation
Exclude:
Nice-to-know data with no connection to the decision
Highly technical analysis that belongs in an appendix
Background detail executives already know
Success criteria should be practical. A report is successful if it helps leadership choose between options, not if it impresses people with volume.
Step 3: Analyze the evidence and turn it into insights
Data alone does not drive decisions. Insight does. The job here is to identify the few patterns that materially change what leadership should do.
Focus on patterns that affect decisions
Look for signals with direct strategic implications, such as:
Demand shifting toward a new segment
A competitor changing price or product mix
A market growing but becoming less profitable
Operational constraints limiting expansion speed
A regulatory factor increasing risk in one scenario but not another
Executives respond well to comparative analysis. Instead of stating one conclusion in isolation, show what changes under different assumptions.
For example:
If demand grows at the base-case rate, option A breaks even in 14 months
If acquisition cost rises by 20%, option B outperforms on margin
If implementation is delayed by one quarter, option C loses its first-mover advantage
Prioritize what matters most
Not every finding deserves a place in the main report. Rank your insights by:
Urgency: Does it affect a near-term decision?
Strategic value: Does it materially influence growth, cost, or competitive position?
Confidence: How strong is the supporting evidence?
Then cut aggressively. Many business research reports fail because they treat every detail as equally important. Executive readers need a hierarchy of importance, not a warehouse of facts.
Step 4: Structure the report so leaders can scan it fast
A well-researched report can still fail if the structure slows people down. Executive teams scan first and study second.
Build a clear business report format
A high-performing structure usually includes:
Executive summary
Key findings
Analysis
Recommendations
Risks and limitations
Appendices
This format works because it surfaces conclusions before detail. Leaders can get the answer quickly, then move into supporting evidence only if needed.
Use formatting to improve usability:
Descriptive headings
Short paragraphs
Tables for comparisons
Charts for trends and variance
Callouts for strategic implications
Appendices for methodology and deeper detail
Write each section for action
Every section should answer a business question.
For example:
Executive summary: What should we know and decide?
Findings: What did the research show?
Analysis: Why does it matter?
Recommendations: What should we do now?
Risks: What could change the conclusion?
Use the conclusion-first approach. Lead with the point, then back it up with data. This is especially effective for senior leaders who need to understand the takeaway in seconds.
Step 5: Write recommendations executives can act on
This is where most reports weaken. They present good analysis but stop short of operationally useful recommendations.
Connect findings to decisions and next steps
A strong recommendation should include:
Action: What exactly should the company do?
Owner: Who is responsible?
Timeline: By when?
Expected outcome: What result should the business expect?
Dependencies: What must happen first?
Trade-offs: What is gained and what is sacrificed?
Weak recommendation:
Explore growth opportunities in the mid-market segment
Strong recommendation:
Launch a 90-day pilot targeting mid-market accounts in two priority regions, owned by the VP of Sales and Head of Product Marketing, with success measured by pipeline generation, acquisition cost, and gross margin viability
Address risk and confidence openly
Executives trust reports more when uncertainty is acknowledged clearly.
Be explicit about:
Data gaps
Assumptions that materially affect outcomes
Unknowns that require further testing
Confidence level for each major recommendation
A simple confidence scale can help:
High: supported by strong internal and external evidence
Medium: directionally sound, but sensitive to assumptions
Low: preliminary view requiring validation before major investment
Best practices for implementing a business research report process
If you want consistently strong reports, standardize the process rather than reinventing it each time. Here are practical best practices I would recommend to any strategy, operations, or research team.
1. Use a decision brief before research begins
Create a one-page brief that defines:
The decision to be made
Executive audience
Scope and exclusions
Timeline
Key hypotheses
Required KPIs
This prevents scope creep and keeps the report anchored to business value.
2. Build an evidence map before drafting
List each key claim you expect to make, then attach supporting sources, relevant charts, and assumptions. If a claim cannot be supported clearly, remove or revise it before writing.
3. Design the executive summary last, but place it first
Write the full analysis first. Then compress the most important points into a sharp executive summary with:
Decision statement
3 to 5 key findings
Recommended action
Key risks
Immediate next steps
4. Pressure-test the recommendations with stakeholders
Before finalizing, review the recommendations with functional leaders from finance, operations, sales, or legal. This helps expose execution gaps early and makes the report more realistic.
5. Prepare both a full report and a short discussion version
Executives often need two formats:
A full report for reference and governance
A presentation version for live decision meetings
The second should mirror the first, not contradict it.
Step 6: Review, refine, and present the report effectively
A credible report is edited as rigorously as it is researched. Small inconsistencies can damage confidence quickly in executive settings.
Edit for clarity and credibility
Review every section for:
Unsupported claims
Jargon or vague language
Inconsistent metrics
Duplicated points
Overly long explanations
Charts that do not answer a business question
Do a final cross-check on all numbers, especially if data appears in more than one place. Revenue, market size, margin, and growth rates must stay consistent across narrative, tables, and visuals.
Prepare for executive discussion
A business research report is rarely the end product. It is usually the start of a leadership discussion.
Prepare for likely questions such as:
What assumption changes this recommendation most?
What are we not seeing in the data?
What happens if we delay?
What resources would execution require?
What is the downside case?
Have appendix slides or backup pages ready for deeper detail. That allows the main report to stay concise while giving decision-makers confidence that the work is robust.
Step 7: Use a practical checklist to improve every future report
The best way to improve report quality over time is to use a repeatable checklist. This reduces inconsistency across teams and makes it easier to train analysts, strategy managers, and business partners.
Use this checklist before any report is finalized:
Does the report answer a real business question?
Is the decision context stated clearly?
Is the scope narrow enough to stay useful?
Are the strongest findings presented early?
Are facts, assumptions, and interpretation clearly separated?
Are the most important KPIs included and defined?
Does each chart answer a specific business question?
Are recommendations specific, realistic, and measurable?
Are owners, timelines, and dependencies identified?
Are risks, limitations, and confidence levels stated openly?
Can an executive understand the core message in under five minutes?
Is there a short presentation version for leadership discussion?
A strong business research report is not just a writing exercise. It is a repeatable operating capability that improves strategic alignment, decision speed, and accountability.
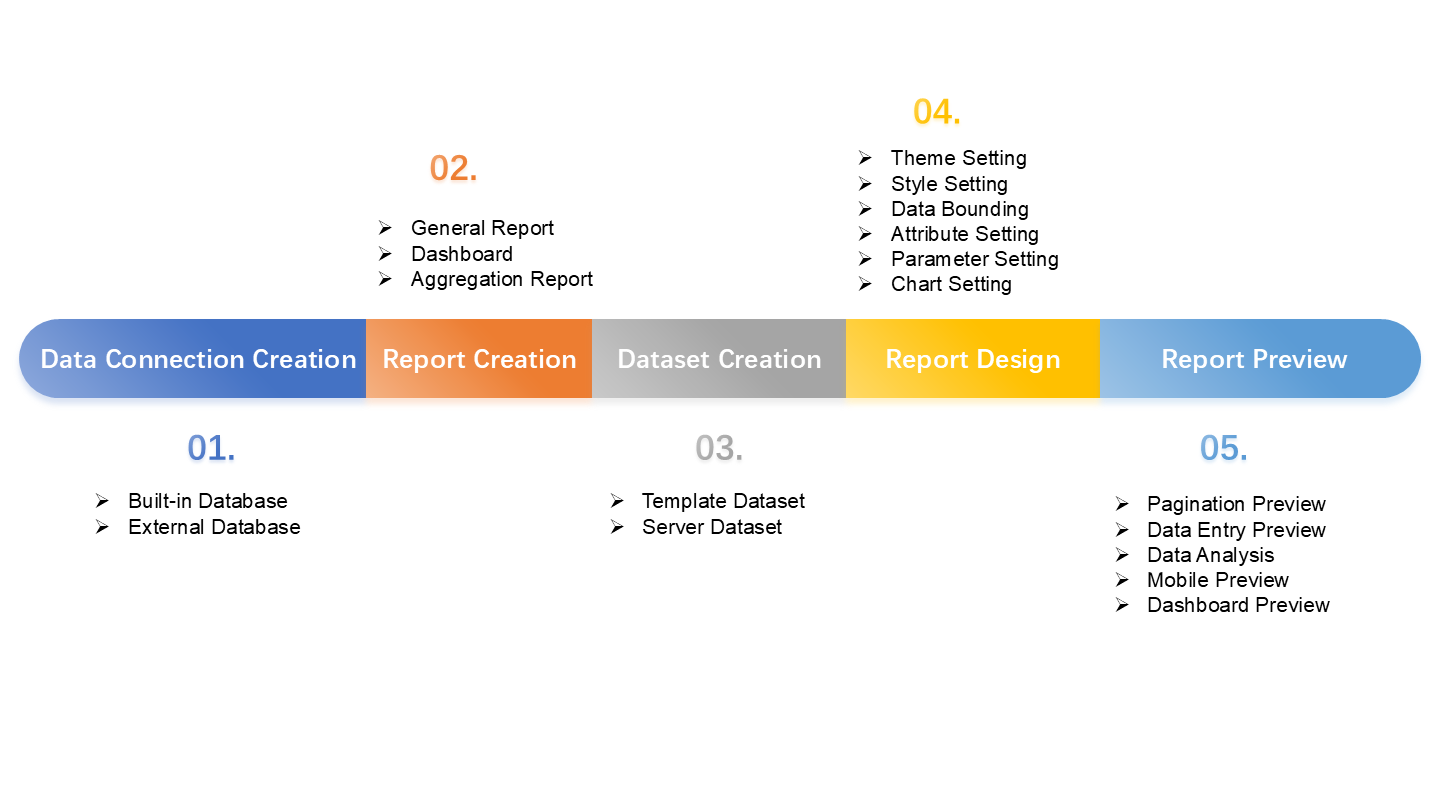
Build the report faster with FineReport
Building this manually is complex; use FineReport to utilize ready-made templates and automate this entire workflow. For teams producing recurring executive reports, competitive intelligence dashboards, market research summaries, or decision packs, manual assembly across spreadsheets, slides, and disconnected systems is slow and error-prone.
FineReport helps teams turn research and analysis into executive-ready output with far less friction. Instead of rebuilding the same report logic every cycle, you can standardize and automate the process.
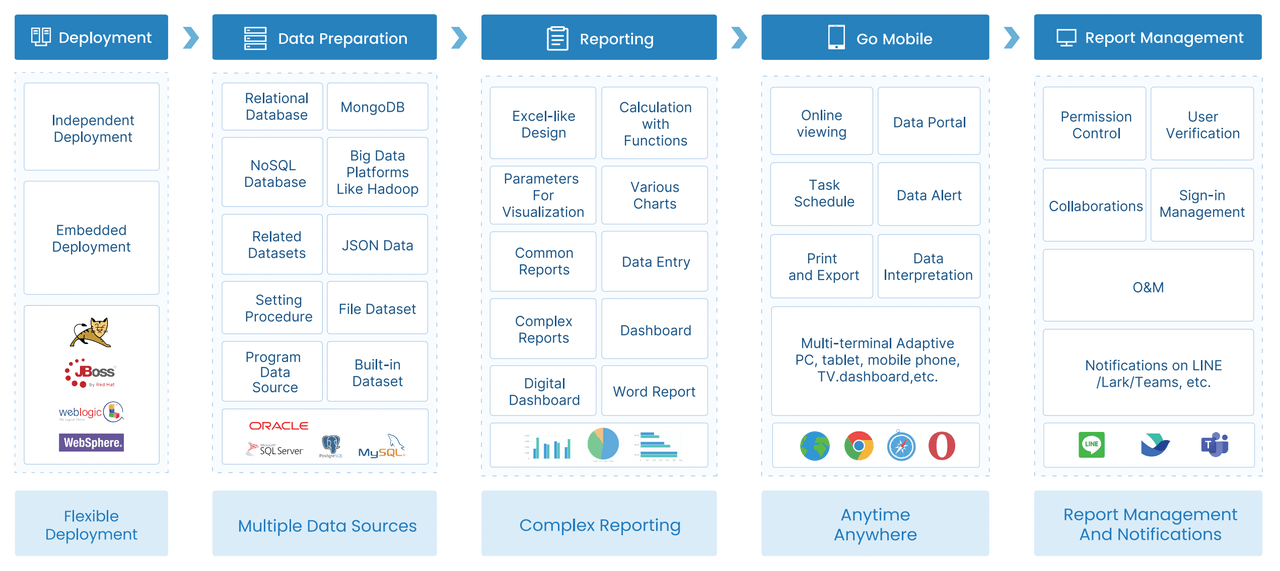
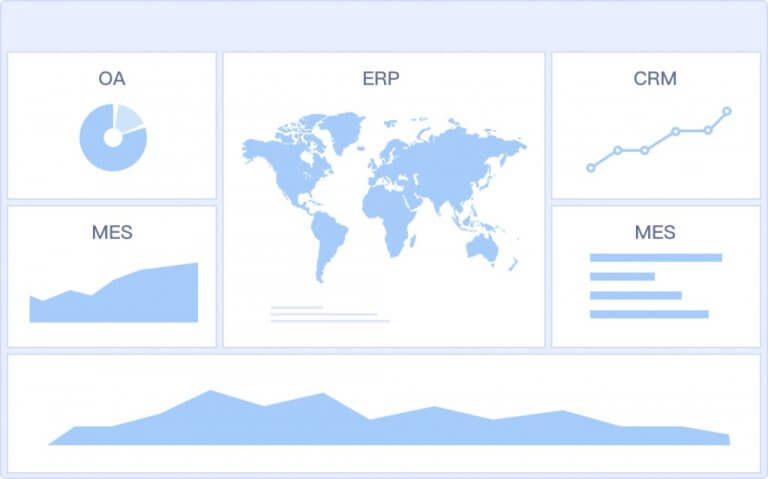
Connect data from multiple sources into one reporting workflow
Build executive dashboards for market research and competitive analysis
Standardize KPI definitions across teams
Create drill-down views for leadership and analysts
Reuse templates for recurring business research reports
Automate refreshes so decision-makers always see current information
Present findings visually in a format executives can scan quickly
For enterprise teams, that means less time wrangling spreadsheets and more time interpreting what the evidence means. It also means better governance, faster updates, and more consistent reporting quality across departments.
If your current process depends on manual formatting, static charts, and late-night revisions before leadership meetings, this is exactly where a reporting platform adds value.
Its purpose is to help leaders make a specific decision with greater clarity, speed, and confidence. Instead of just summarizing data, it connects evidence to strategic implications and recommended actions.
A strong report should include the business question, decision context, scope, evidence, analysis, implications, recommendations, and key limitations. Executives also expect a concise summary that highlights what matters most right away.
Choose KPIs that directly support the decision being made, such as market size, growth rate, margin impact, competitive share, and risk exposure. The best metrics link findings to revenue, cost, feasibility, or strategic risk.
It should be as short as possible while still giving enough evidence to support the recommendation. Most executive audiences prefer a brief summary upfront with deeper analysis available only if needed.
Executives trust reports that are clear, data-backed, transparent about assumptions, and focused on business impact. A report becomes more useful when it shows trade-offs, confidence levels, and specific next steps.
Product Trial
FineReport
Pixel-perfect reports · Interactive dashboards · Easy data entry · Digital twins