A lead generation dashboard gives you a real-time view of how your marketing and sales efforts turn prospects into leads. You need to track and visualize lead generation to understand what works and where to improve. With modern BI tools like FineBI, you can simplify data analysis and make smarter decisions using a single dashboard.
Lead Generation Dashboard Overview
A lead generation dashboard is a visual tool that helps you track, analyze, and optimize your lead generation activities, giving marketing and sales teams a clear view of performance and opportunities for improvement.
What Is a Lead Generation Dashboard
You use a lead generation dashboard to monitor how your marketing and sales efforts turn prospects into leads. This dashboard displays key metrics that show the effectiveness of your lead generation strategies. You see real-time data on how many leads you generate, where they come from, and how they move through your sales funnel. The dashboard helps you spot trends, identify bottlenecks, and make quick decisions to improve your lead generation results.
FineBI makes it easy to build a lead generation dashboard by connecting data from different sources. You can combine information from social media, email campaigns, website forms, and more. FineBI’s drag-and-drop interface lets you create dashboards without coding, so you can focus on analyzing your lead generation data.
Tip: A lead generation dashboard gives you a unified view of your marketing and sales data, making it easier to find what works and what needs attention.
Core Functions for Lead Generation
A lead generation dashboard provides several core functions that help you manage and improve your lead generation process:
- Track the total number of leads generated over time.
- Analyze the sources of your leads, such as social media, email, or website forms.
- Monitor conversion rates to see how many leads become customers.
- View the current status of each lead in your sales funnel.
- Measure response times to ensure quick follow-up.
| Metric | Description |
|---|---|
| Lead Volume | The total number of leads generated over a specific period. |
| Source Breakdown | Analysis of where leads are coming from (e.g., social media, email, etc.). |
| Conversion Rates | The percentage of leads that convert into customers. |
| Lead Status | Current status of leads in the sales funnel (e.g., new, contacted, qualified). |
| Response Times | Average time taken to respond to leads, which can impact conversion rates. |
FineBI supports unified data integration, so you can bring all your lead generation data together. You can visualize these metrics in interactive dashboards, helping you make informed decisions and improve your lead generation strategy.

How a Lead Generation Dashboard Works with FineBI
A lead generation dashboard in FineBI connects your data, processes it for analysis, and lets you build interactive dashboards that track every lead from prospect to conversion—all in one place.
Data Integration and Processing
You start by connecting your data sources to FineBI. You can pull in information from your CRM, website forms, email campaigns, and social media channels. FineBI supports over 60 connectors, so you can unify all your lead generation data, no matter where it lives. You do not need to worry about technical barriers. FineBI’s interface guides you through each step.
Once your data is connected, you prepare it for analysis. You can clean up your data, join tables, and create custom fields. This step ensures your lead data is accurate and ready for reporting. You can filter out duplicates, standardize values, and merge data from different sources. This process gives you a single, reliable view of your lead generation efforts.
Tip: Clean data helps you avoid mistakes and makes your lead dashboard more trustworthy.
Visual Exploration and Dashboard Creation
After preparing your data, you move to dashboard creation. FineBI’s drag-and-drop interface makes this step simple for everyone. You do not need coding skills to build a lead generation dashboard. You can choose from a wide range of charts and tables to visualize your lead data.
- You can quickly design dashboards by dragging fields onto the canvas.
- You can create interactive reports that update in real time.
- You can analyze leads from multiple sources and spot trends fast.
- You can build dashboards that help you answer questions like how to build a lead dashboard or which channel brings the most prospects.
FineBI also offers real-time filtering and cross-platform access. You can view your dashboards on your computer, tablet, or phone. This flexibility means you can check your lead generation performance anytime, anywhere.
| Feature | Benefit |
|---|---|
| Real-time data processing | Make decisions with up-to-date lead information. |
| Mobile accessibility | Track leads and dashboards on the go. |
| User-friendly interface | Build dashboards without technical skills. |
| Scalability | Grow your analysis as your lead data increases. |
| Fast response times | Get instant answers, even with complex lead queries. |

A lead generation dashboard in FineBI gives you the tools to track, analyze, and improve every stage of your lead process. You can turn raw data into clear insights and take action to boost your results.
Key Metrics to Measure Lead Generation
To measure lead generation effectively, you need to track conversion rate, cost per lead, lead quality, total lead value, customer acquisition cost, and return on ad spend. These metrics help you understand how well your dashboard supports your marketing and sales goals.
Essential KPIs for Lead Generation
You need to focus on the most important KPIs when you measure lead generation. These indicators show how well your campaigns turn a prospect into a valuable lead. Here are the key metrics you should track on your lead generation dashboard:
- Conversion Rate: Shows the percentage of leads that become paying customers.
- Cost Per Lead (CPL): Calculates the average cost to acquire each lead.
- Lead Quality: Measures how likely a lead is to convert based on engagement and fit.
- Total Lead Value: Estimates the potential revenue from all leads.
- Customer Acquisition Cost (CAC): Tracks the total cost to gain a new customer.
- Return on Ad Spend (ROAS): Evaluates the effectiveness of your advertising campaigns.
You can use FineBI to track these KPIs in real time. The dashboard lets you pull data from multiple sources, so you always have an up-to-date view of your lead generation performance.
Tip: Tracking these KPIs helps you spot trends, adjust your strategy, and achieve higher conversion rates.
Why These Metrics Matter
Each metric on your dashboard tells a different story about your lead generation efforts. You need to understand what each one means and why it matters.
| Metric | Description |
|---|---|
| Lead Conversion Rate | Indicates the effectiveness of lead generation strategies by showing the percentage of leads that convert into customers. |
| Cost per Lead | Reflects the efficiency of lead generation efforts by dividing total marketing spend by the number of leads generated. |
| Lead Quality | Assesses how well leads match the ideal customer profile, often evaluated by their engagement and readiness to buy. |
A strong lead conversion rate means your campaigns and sales process work well. If you see a low conversion rate, you may need to improve your lead nurturing or check if your marketing targets the right audience. Cost per lead helps you measure lead generation efficiency. A high CPL can signal that you need to refine your targeting or creative approach. Lead quality shows if your leads are likely to become customers. Focusing on high-quality leads can improve your long-term ROI, even if you generate fewer leads overall.
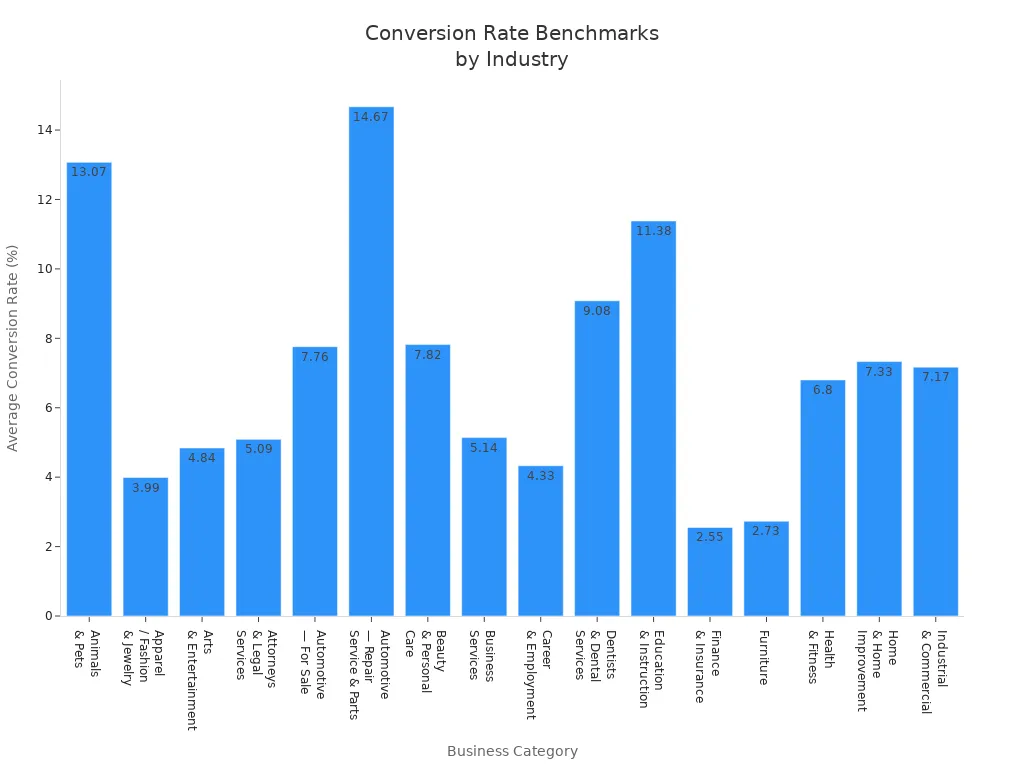
You can see how these metrics compare across industries. For example, the average conversion rate for Automotive Repair is 14.67%, while Finance & Insurance sits at 2.55%. These differences reflect how user intent and purchase complexity affect results.
Tracking these KPIs on your lead generation dashboard is essential. You can quickly see if your campaigns reach the right people and if your sales team follows up with the best prospects. If you notice that many leads do not convert, you may need to adjust your strategy or focus on lead qualification.
FineBI makes it easy to measure lead generation. You can set up dashboards that show all your key metrics in one place. You can filter data by channel, campaign, or sales rep. This flexibility helps you find what works and improve your lead generation strategy.
Note: When you measure lead generation, you gain insights that help you optimize your marketing spend and boost your results.

Lead Generation Dashboard Benefits for Business
A lead generation dashboard gives you real-time insights, improves targeting, and helps you make better decisions by unifying your marketing and sales data in one place.
Practical Advantages of Using FineBI
You gain several practical advantages when you use a lead generation dashboard powered by FineBI. You save time because automated dashboards reduce manual reporting by over 80%. You make faster decisions since you see real-time data and spot trends or issues quickly. You track marketing ROI with dashboards that connect activities to revenue, helping you optimize your budget. You align your team because everyone sees the same data, which builds trust and improves collaboration. FineBI’s lead generation tools let you personalize your dashboard, so you focus on the metrics that matter most for your lead generation process.
Tip: Use your dashboard to set clear call-to-action goals and monitor how each lead responds. This helps you improve personalization and boost conversion rates.
Use Cases and Success Stories
Many businesses have improved their lead generation results with dashboards. UnionPay Data Services used FineBI to unify fragmented data and increase customer value identification accuracy to 90%. The company tracked lead performance, identified bottlenecks, and optimized its lead generation process. Retailers also benefit from dashboards that support membership management. You can see how retail analytics dashboards help you track engagement and performance data for a competitive edge.
| Source | Description |
|---|---|
| Retail Analytics Dashboard | Tracks engagement and performance data, helping you gain a competitive advantage. |
| Retail Lead Management CRM | Integrates with business functions to support effective membership management. |
You can use lead generation dashboards with tools like LeadSquared CRM, Lightspeed Retail, ZohoRetail CRM, Freshsales Retail CRM, Salesforce, and Netsuite by Oracle. These dashboards help you manage leads, personalize marketing, and improve customer loyalty. FineBI gives you the flexibility to adapt your dashboard to any industry, making it a powerful tool for driving business growth.
Setting Up a Lead Generation Dashboard in FineBI
To set up a lead generation dashboard in FineBI, you connect your data sources, prepare and clean your datasets, then use drag-and-drop tools to build interactive dashboards that track every stage of your lead generation process.
Step-by-Step Setup Guide
You can create a lead generation dashboard in FineBI by following these steps:
- Connect Your Data Sources
Start by linking FineBI to your CRM, website forms, email campaigns, and social media platforms. FineBI supports over 60 connectors, so you can unify all your lead generation data for complete data tracking. - Prepare and Clean Data
Use FineBI’s self-service tools to join tables, filter out duplicates, and standardize values. This ensures your lead data is accurate and ready for analysis. You can create custom fields to track lead qualification or call-to-action responses. - Build Your Dashboard
Drag and drop charts, tables, and filters onto your dashboard. Visualize key metrics like conversion rates, lead volume, and source breakdown. FineBI’s interface makes it easy to answer questions like how to build a lead dashboard and measure the impact of your lead generation strategy. - Publish and Share
Share your dashboard with your team. Everyone can access the same information, which improves collaboration and accountability. You can view dashboards on any device for real-time insights.

Tip: Use personalization features to highlight the metrics that matter most for your customer journey.
Best Practices for Ongoing Use
You should follow these best practices to keep your lead generation dashboard effective and relevant:
- Schedule regular training sessions so users know how to interpret and interact with the dashboard.
- Monitor dashboard usage to see who accesses which data.
- Review the dashboard monthly to check if it answers key business questions.
- Redesign the dashboard quarterly to match changing business priorities.
A shared dashboard enhances visibility into lead volume, quality, and conversion metrics. Access to the same data fosters teamwork and supports continuous improvement. Real-time analytics and AI-powered insights help you optimize your lead generation tools and strategies.
| Aspect | Description |
|---|---|
| Collaborative Tool | Allows different departments to access lead generation data for optimization. |
| Key Metrics | Outlines essential metrics for effective analysis and improvement. |
| Real-time Analytics | Supports ongoing improvement with up-to-date insights and AI-driven analytics. |
Note: Continuous improvement in your lead generation dashboard ensures your lead generation process stays aligned with business goals and delivers the best results.
You can transform your marketing and sales results with a lead generation dashboard. FineBI helps you connect data, automate analysis, and turn every lead into an opportunity. You gain better resource allocation, higher conversion rates, and clear performance tracking. Start building your dashboard today. Explore real customer stories and industry solutions to inspire your next steps.


FAQ

The Author
Lewis
Senior Data Analyst at FanRuan
Related Articles

How to Build an Investment Portfolio Reporting Dashboard for Executives: KPIs, Benchmarks, and Drill-Down Views
Investment portfolio reporting for executives is not about showing every holding, transaction, and chart your investment team can produce. It is about giving CEOs, CFOs, CIOs, boards, and investment committees a fast, re
Yida YIn
Jun 25, 2026

12 KPI Reporting Examples for Executive Dashboards: What to Show in Weekly, Monthly, and Quarterly Reviews
Executive leaders do not need more data. They need decision ready $1 examples that match how often they review the business and what actions they are expected to take. A weekly $1 should surface fast moving risks and per
Yida YIn
Jun 25, 2026

How to Build a Digital Marketing Reports Dashboard: Executive Examples, KPIs, and Templates
A $1 is the control layer that helps executives and marketing leaders turn scattered channel data into fast, confident decisions. If you are a CEO, CMO, operations director, or marketing analytics lead, the real problem
Yida Yin
May 07, 2026