A sales dashboard shows you real-time sales data, trends, and team performance in one place. You need sales dashboards because they help you spot what works, fix what doesn’t, and hit your targets faster. The right sales dashboard, like those powered by FineReport, lets you track key metrics and boost results.
You’ll find platforms like FineBI by FanRuan and Salesforce Sales Cloud lead the way for sales teams in 2026.
Sales Dashboard Essentials for 2026
What Is a Sales Dashboard?
A sales dashboard is your command center for all things sales. You see every important number in one place—revenue, deals closed, leads, and more. With a dashboard, you don’t have to dig through endless spreadsheets or emails. You get a clear view of your sales pipeline, team performance, and revenue progress. FineReport makes this even easier. You can connect data from different sources and see real-time updates. This means you always know where your sales stand and what needs your attention.
Why Sales Dashboards Matter
You want to hit your targets and grow revenue. Sales dashboards help you do that. They show you key performance indicators, so you know what’s working and what’s not. You can track sales trends, spot problems early, and adjust your strategy fast. When you use a dashboard, you make smarter decisions. You can share results with your team, set goals, and celebrate wins together. FineReport lets you customize your dashboard for your team’s needs. You can focus on the metrics that matter most, like revenue forecasts or conversion rates. This keeps everyone on the same page and moving toward the same goals.
Tip: A good sales dashboard doesn’t just show numbers—it tells you a story about your sales.
Trends in Sales Dashboard Design
Sales dashboards in 2026 look different from the old days. You see more clarity and real-time data. Dashboards now have user-friendly interfaces, so anyone on your team can use them. You get micro-analytics, which means you can answer small questions quickly without waiting for a big report. Real-time insights help you act fast and stay ahead of the competition. In hybrid work environments, dashboards give everyone a shared view of sales performance, no matter where they work. FineReport leads the way with these trends, offering dashboards that are clear, fast, and easy to use. You get the tools you need to boost revenue and keep your sales team winning.

Choosing the Best Sales Dashboard
Key Features to Look For
You want a sales dashboard that does more than just show numbers. The best dashboards in 2026 give you real-time data, advanced analytics, and mobile access. You can track your sales pipeline, monitor team performance, and get instant updates wherever you are. Sales teams often ask for dashboards that are customizable, support collaboration, and use AI to spot trends. Here’s a quick look at the most requested features:
| Key Feature | Description | Benefits |
|---|---|---|
| Customizable Dashboards | Tailor dashboards to show the metrics that matter to you. | Quick insights into pipeline and team performance. |
| Advanced Reporting and Analytics | Track goals and KPIs with powerful reporting tools. | Make informed decisions and optimize performance. |
| Collaboration Tools | Work together on sales strategies and share data easily. | Boost teamwork and communication. |
| AI and Machine Learning | Use AI to analyze data and suggest next steps. | Improve forecasting and strategy development. |
| Mobile Access | Check dashboards on your phone or tablet anytime. | Stay flexible and monitor sales on the go. |
You need these features to keep your sales team agile and informed.
Integration and Customization
You don’t want your dashboard stuck in a silo. FineReport stands out because it connects to almost any database and pulls in data from all your sources. You can generate reports using SQL, create custom templates, and link charts for deeper analysis. FineReport lets you access dashboards on mobile devices, annotate, comment, and share insights with your team. Other tools might offer basic customization, but FineReport gives you the flexibility to build dashboards that fit your sales process perfectly.

| Feature | FineReport | Other Tools |
|---|---|---|
| Database Connection | Seamless with many databases | Varies |
| Report Generation | Efficient with SQL | Limited |
| Customization | Advanced templates and chart linkage | Basic |
| Mobile Access | Full support for mobile dashboards | Limited |
| User Interaction | Annotate, comment, share, extract data | Varies |
You get a dashboard that grows with your sales needs.
User Experience
You want a dashboard that feels easy from day one. A clean interface helps you find what you need fast. When your dashboard fits into your daily workflow, you use it more and get better results. Mobile accessibility means you can check sales numbers on the go. A low learning curve means your team gets up to speed quickly. User experience makes a huge difference—great dashboards see higher adoption and drive better sales outcomes.
| User Experience Factor | Impact on Adoption Rates | Notes |
|---|---|---|
| Interface Design | High | Easy to use, encourages frequent use |
| Workflow Integration | Very High | Fits into your current sales process |
| Mobile Accessibility | Moderate | Lets you check sales anywhere |
| Learning Curve | High | Quick to learn, fast team adoption |
| Overall Impact | 41% | User experience drives dashboard success |
Tip: Choose a sales dashboard that your team actually enjoys using. Adoption leads to results.
Top 10 Sales Dashboard Examples

You want to see how the best sales dashboards look in action? Here are the top 10 sales dashboard examples you can use to elevate your team in 2026. Each dashboard example solves a unique sales challenge and helps you get the most out of your data. Let’s dive in.
1.Real-Time Sales Performance Dashboard
A real-time sales performance dashboard gives you instant visibility into your team’s results. You can track every sale as it happens and spot trends before they become problems. With FineReport, you get real-time data from all your sources, so you never miss a beat.
- Improved sales performance visibility lets you see patterns and trends quickly.
- Enhanced sales strategy adaptability means you can change tactics on the fly.
- Faster, data-driven decisions help you react to sales trends right away.
- Automation boosts your team’s productivity by handling repetitive tasks.
- Optimized resource allocation ensures you use your stock and time wisely.
You can set up this dashboard to show KPIs like total sales, win rates, and average deal size. FineReport’s real-time data sync means you always have the latest numbers, whether you’re at your desk or on your phone.
2.Pipeline Management Dashboard
A pipeline management dashboard keeps your sales pipeline organized and moving. You see every deal’s stage, value, and owner in one place. This dashboard example uses real-time data updates, actionable metrics, and alerts for stalled deals.
- Real-time visibility into deals helps you focus on what matters.
- Actionable metrics show you where to push and where to wait.
- AI-driven insights give you clarity and precision.
- Alerts for stalled deals keep your pipeline healthy.
FineReport lets you customize your pipeline dashboard, so you can track every opportunity and forecast revenue with confidence. You get clean, consistent data for reliable projections.

3.Sales Forecasting Dashboard
A sales forecasting dashboard uses predictive analytics to help you plan ahead. You can see where your sales are headed and adjust your strategy before problems arise. This dashboard example is all about accuracy and proactive planning.
| Aspect | Description |
|---|---|
| Accuracy | Predictive analytics minimizes guesswork and biases, leading to more accurate sales forecasts. |
| Proactive Decision-Making | Transforms forecasting into a proactive process, allowing for strategic planning and adjustments. |
| Resource Allocation | Provides a clearer view of future revenue, enabling precise resource planning. |
| Team Alignment | Ensures all teams work from the same forward-looking picture, reducing surprises and enhancing speed. |
FineReport’s real-time data integration means your forecasts update automatically. You can share these dashboards with your team, so everyone stays on the same page.
4.Lead Conversion Dashboard
A lead conversion dashboard tracks how well you turn leads into customers. You can see which sources bring the best leads and where you lose prospects. This dashboard example helps you boost conversion rates and hit your targets.
| Example/Statistic | Description |
|---|---|
| 85% conversion rate | Achieved by a client making 170,000 outbound and 70,000 inbound calls annually, surpassing the industry average due to advanced call tracking and analytics. |
| 20% boost in conversion rates | Observed by an e-commerce platform after adopting real-time dashboards. |
| 53% higher conversion rate | Companies that actively manage their funnels experience this increase from lead to opportunity. |
| 9.3% higher sales quota achievement | Companies with advanced lead management practices see this improvement. |
FineReport lets you build a custom sales dashboard to track every step in your funnel. You can set up alerts for hot leads and see which reps close the most deals.
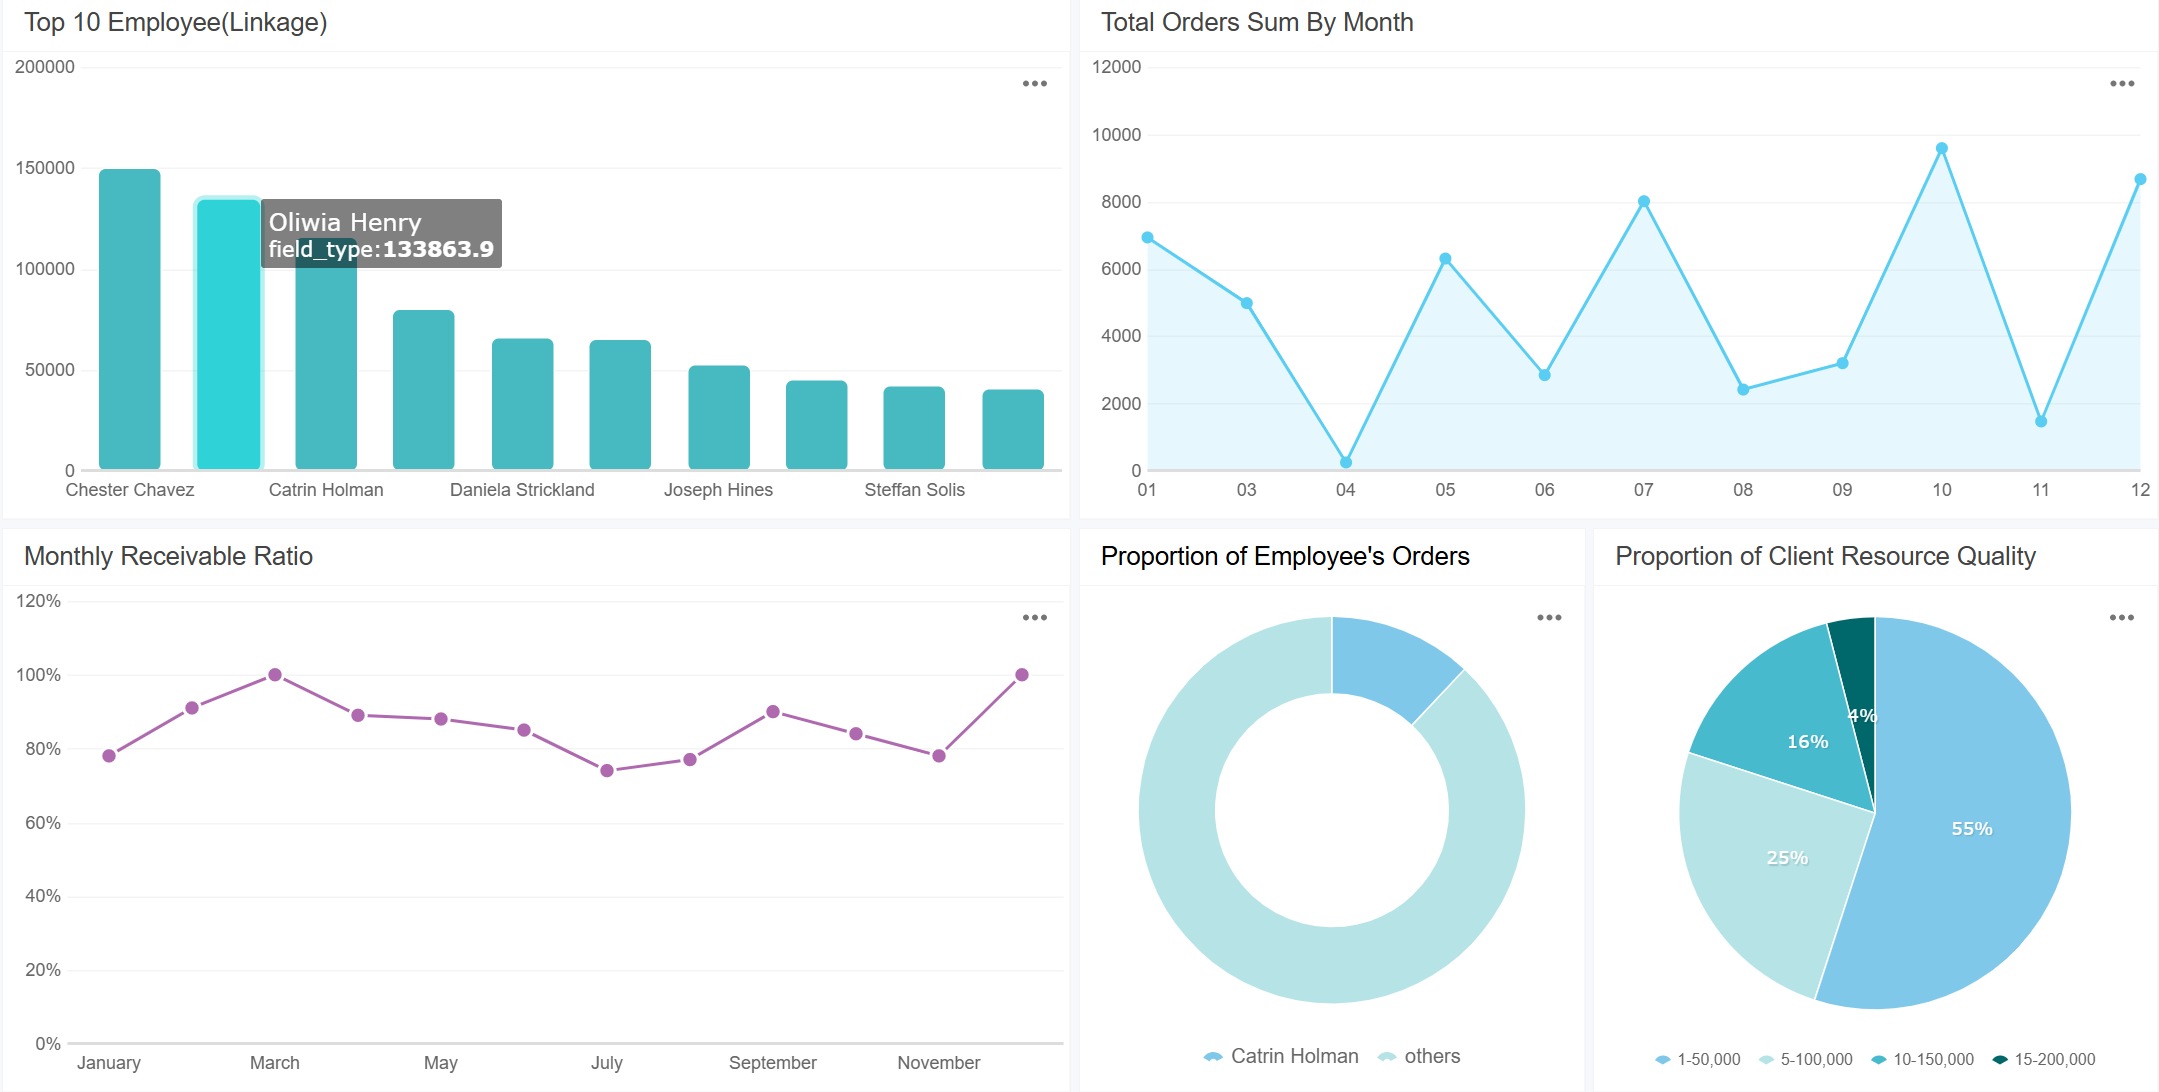
5.Regional Sales Dashboard
A regional sales dashboard breaks down your sales by location. You can see which cities, states, or countries perform best. This dashboard example helps you spot trends and target your efforts where they matter most.
A sales by region dashboard is essential if you have multiple teams. It shows you which regions are winning and which need more support. You can track sales by city, revenue by product group, and sales by representative. For example, the Southwest might have fewer stores but higher revenue per customer. Other regions may need more resources.
- Provides insights into sales performance by region.
- Helps identify high-potential areas for growth.
- Allows for effective resource allocation based on regional performance.

FineReport’s mapping features make it easy to visualize your data and share insights with your team.
6.Product Performance Dashboard
A product performance dashboard tracks how each product contributes to your sales growth. You can see which items drive revenue and which need attention. This dashboard example uses key metrics to measure success.
| Metric Name | Type | Formula |
|---|---|---|
| Total Sales Revenue | Growth and Outcome | Number of items sold x Price of each unit |
| Net Revenue Retention (NRR) | Quality and Outcome | [(Starting MRR + Expansion MRR – Contraction MRR – Churned MRR) / Starting MRR] x 100% |
| Average Revenue Per Account (ARPA) | Growth and Outcome | Monthly recurring revenue / Total number of active accounts |
| Quarterly Sales Growth | Growth, Input, Outcome | (Current quarter sales – last quarter sales) / Last quarter sales |
| Year-Over-Year Growth | Growth and Outcome | (Current year sales – Last year sales) / Last year sales |
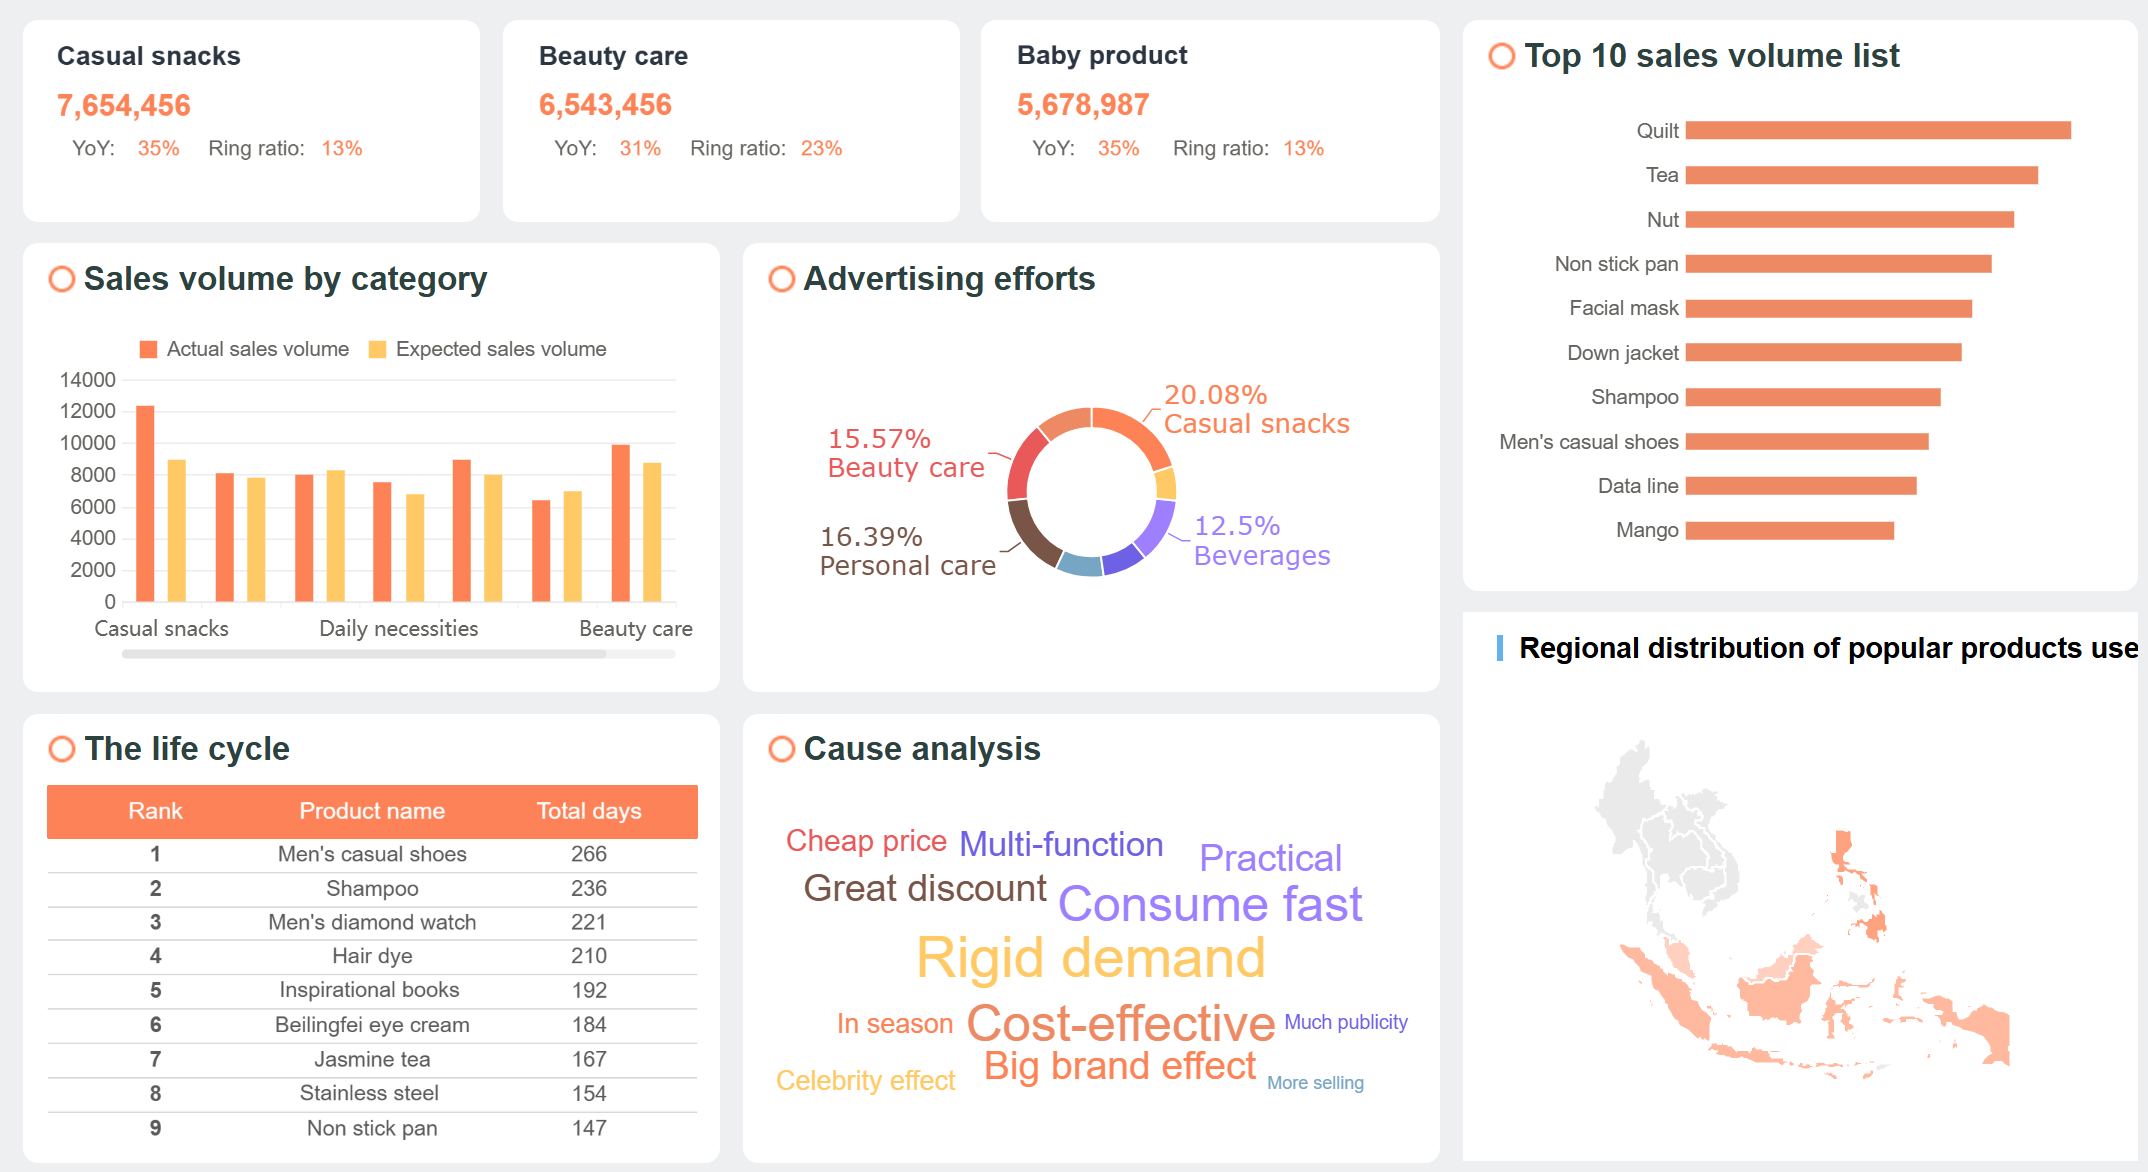
FineReport lets you create dashboards that compare products side by side. You can drill down into real-time data and adjust your strategy fast.
7.Customer Retention Dashboard
A customer retention dashboard helps you keep your best customers and reduce churn. You can track retention rates, churn rates, and customer behavior over time. This dashboard example brings all your data together for a full view of your customer base.
- Tracking retention and churn rates helps you spot trends early.
- Integrating data sources gives you a complete picture of customer behavior.
- Promoting accountability across teams keeps everyone focused on customer experience.
FineReport’s real-time data integration means you always know where you stand. You can set up alerts for at-risk customers and take action before they leave.
8.Sales Activity Dashboard
A sales activity dashboard tracks what your team does every day. You can see emails sent, meetings booked, calls made, and deals created. This dashboard example helps you boost productivity and keep your team on track.
| Metric | Description |
|---|---|
| Deals closed this month | The most important metric indicating sales success for the month. |
| Product demos given | Tracks the number of product demonstrations conducted. |
| Follow-up activities | Includes emails and calls made to prospects for follow-up. |

You can also track emails logged, meetings booked, calls logged, new deals created, open deals by rep, closed deals by rep, and close rate. FineReport makes it easy to customize your sales activity dashboard for your team’s workflow.
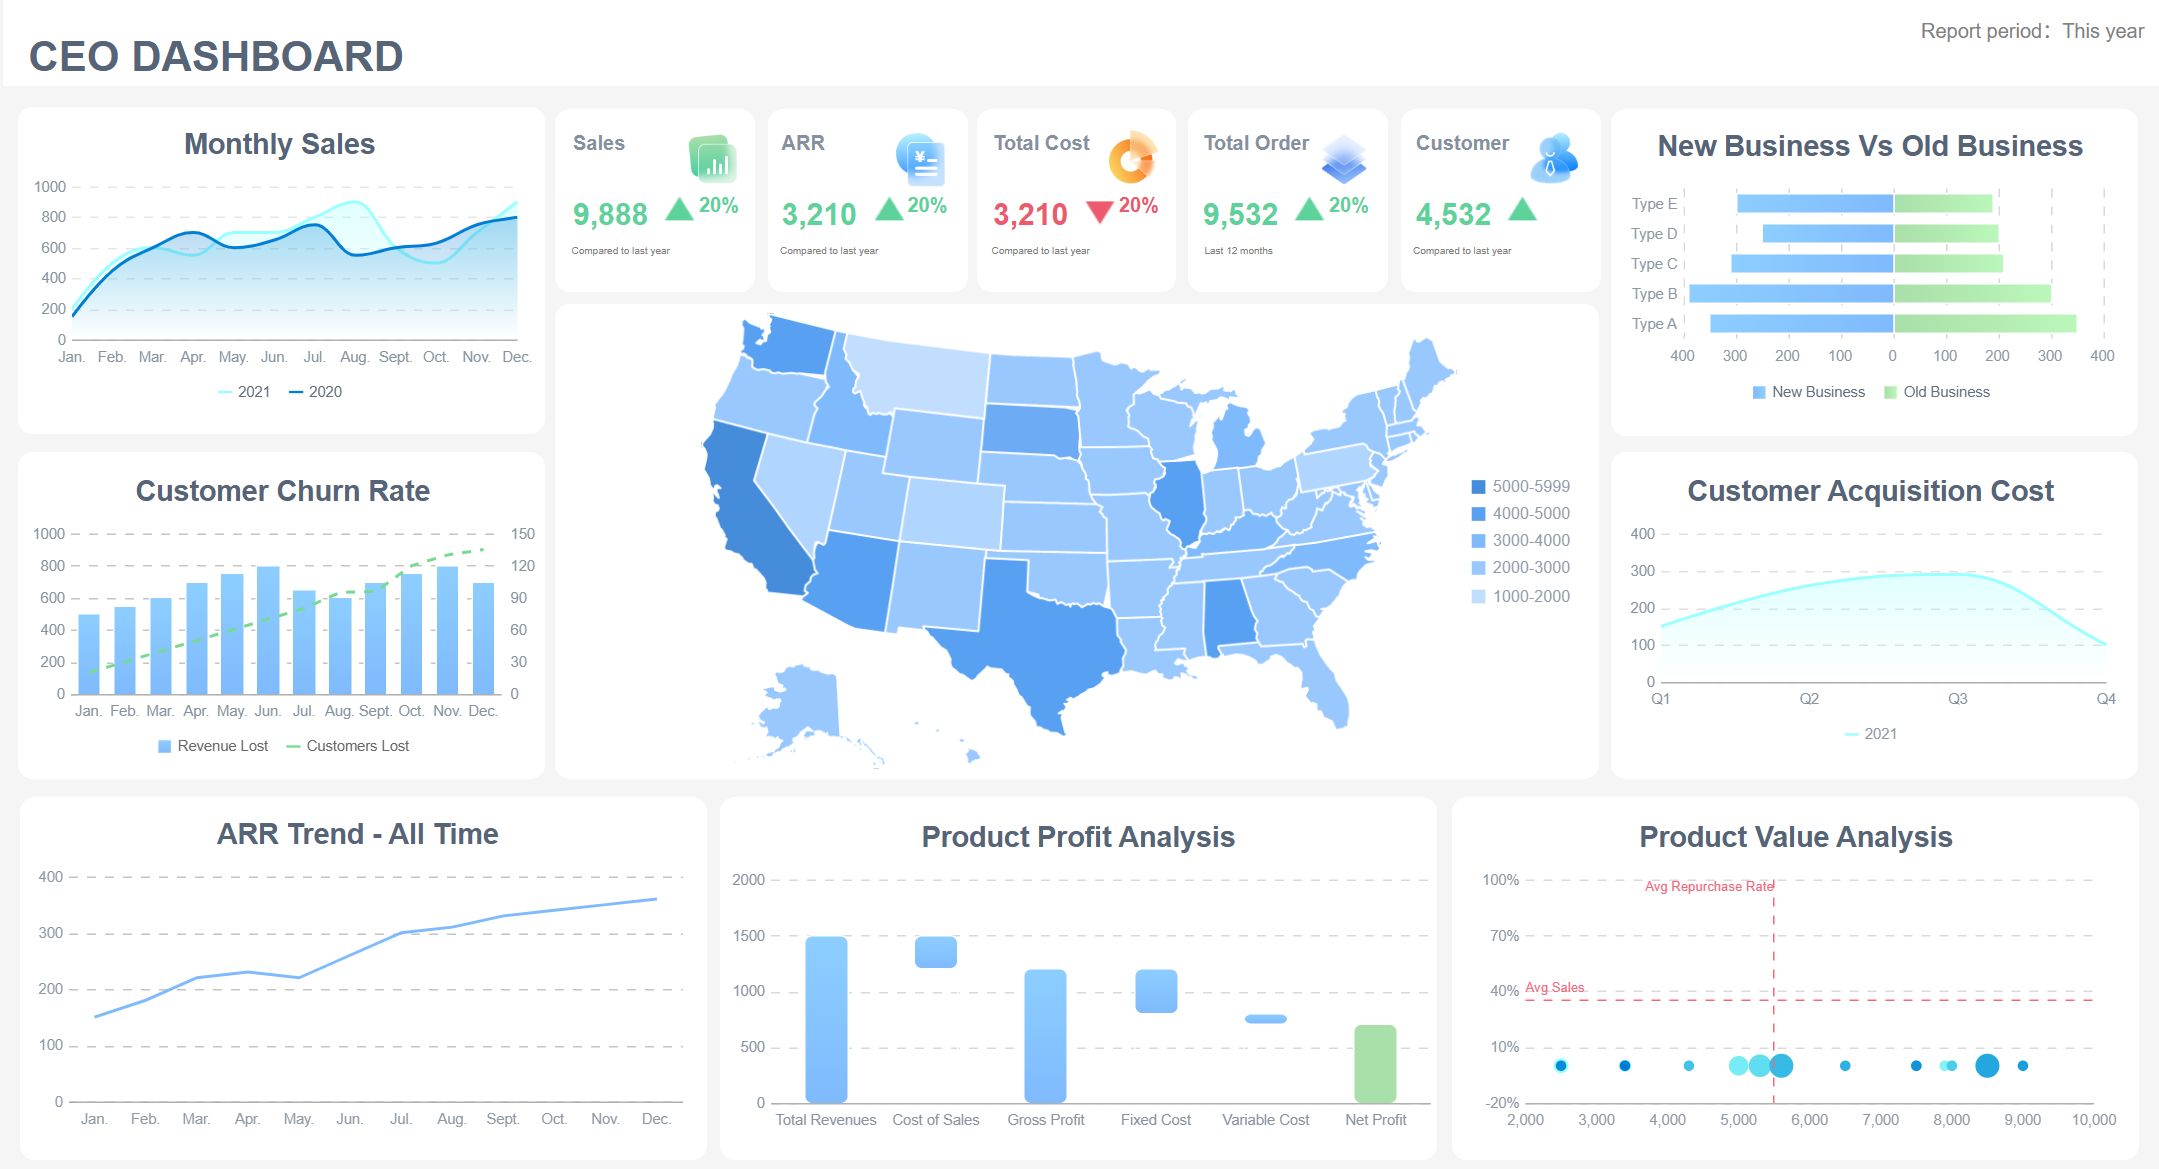
9.Executive Overview Dashboard
The ultimate goal of an executive dashboard is to facilitate faster, more accurate, and more confident decision-making. By presenting data in a visual context, it helps executives quickly spot trends, patterns, and anomalies.
An executive overview dashboard gives leaders a high-level view of all sales performance metrics. You can track progress toward strategic goals like revenue growth and market share. This dashboard example helps you answer critical business questions in seconds.
- Facilitates faster and more accurate decision-making.
- Enables quick identification of trends and anomalies.
- Helps answer critical business questions in seconds.
FineReport’s executive dashboards are fully customizable and mobile-friendly, so leaders can check performance metrics anytime, anywhere.
10.Custom KPI Dashboard
A custom KPI dashboard lets you choose the metrics that matter most to your team. You can build dashboards for different departments, roles, or even individual users. This dashboard example gives you total control over your data.
- Department-focused dashboards let you tailor views for sales, marketing, or support.
- Role-based customization means agents, staff, and managers see only what they need.
- KPI selection lets you pick the most relevant performance metrics for each role.
- User management control restricts access based on user roles.
FineReport makes it easy to build a custom sales dashboard that fits your workflow. You can update KPIs as your goals change and keep your team focused on what matters.
These top 10 sales dashboard examples show you what’s possible when you use the best sales dashboards. With FineReport, you get real-time data, mobile access, and endless customization. You can build a dashboard for every sales challenge and drive your team to new heights.

Implementing Sales Dashboards for Impact
Steps to Successful Implementation
You want your sales dashboard rollout to drive real results. Start by preparing your team for change. Get leadership involved early and secure buy-in from your CEO. Define your project strategy and set clear goals for sales performance. Next, pick the right sales performance metrics. Focus on the numbers that matter most for revenue and sales enablement. Involve your sales team in the process so everyone feels invested. Choose a user-friendly tool like FineReport. You can connect all your data sources and customize dashboards for your sales enablement platform. Validate your data before launch to ensure accuracy. Remember, dashboard adoption is a journey. Roll out features gradually and expand as your team grows more comfortable.

Implementation Checklist:
- Engage leadership and set strategy.
- Identify key sales performance metrics.
- Involve users and provide training.
- Select flexible, integrated tools.
- Validate data and assumptions.
- Roll out in phases and adjust as needed.
Tip: FineReport’s support team can help you with setup, integration, and ongoing optimization.
Avoiding Common Pitfalls
Many teams stumble when they launch sales dashboards. Don’t forget the story behind your numbers. Make sure your team understands what each metric means for sales performance. Avoid using the wrong chart types or inconsistent designs. Keep your dashboard simple at first. Don’t overload it with gadgets or widgets that distract from actionable insights. Use the same visual style for similar sales performance metrics to make things easy to read. Always design with accessibility in mind so everyone can use your sales analytics tools.
- Watch out for static dashboards that limit user interaction.
- Avoid complexity at the start—keep things simple and focused.
- Make sure your dashboard provides actionable insights, not just data.
Training and Adoption
Training makes or breaks your sales dashboard project. Get leaders to use the dashboard daily and show their commitment. Use live data in meetings to discuss sales performance and revenue trends. Track adoption rates and talk about them in leadership meetings. Offer visible support for training and share best practices. Link dashboard usage to performance reviews to encourage consistent use.
| Strategy | Description |
|---|---|
| Use dashboards daily | Leaders log in and update sales opportunities regularly. |
| Discuss live data in meetings | Teams review sales analytics and actionable insights together. |
| Track adoption in leadership meetings | Review usage trends and set new goals. |
| Provide visible training support | Leaders join sessions and share tips. |
| Link usage to performance reviews | Make dashboard adoption part of evaluations. |
You can also use in-app guidance and role-based learning paths. Offer continuous coaching to keep your team sharp. FineReport’s intuitive interface and support services make training and adoption smooth, so your sales enablement efforts pay off fast.

Customizing Sales Dashboards for Your Team
Personalizing Metrics
Every sales team is unique. You need a sales dashboard that fits your team’s style, goals, and industry. FineReport makes this easy. You can pick the metrics that matter most for your team—like win rates, deal size, or customer retention. If you work in manufacturing, you might want to track regional sales or product performance. In finance, you may focus on revenue growth and cost control. FineReport lets you build dashboards for different roles, so sales reps, managers, and executives each see what’s important to them. You can even set up role-based access, so everyone gets the right view.
Tip: When you personalize your dashboard, your team pays more attention to the numbers that drive results.
Aligning with Sales Goals
Your dashboard should help you reach your sales goals, not distract you with random data. Start by choosing KPIs that match your company’s strategy. For example, if your goal is growth, track new customer acquisition and revenue. If you want to improve efficiency, focus on sales cycle length and conversion rates. Use KPI dashboards to show these vital metrics. Make sure your metrics reflect your top priorities, like customer retention or market expansion. Here’s a quick look at methods for aligning your dashboard with your goals:
| Method | Description |
|---|---|
| KPI Dashboards | Show key metrics like revenue and customer growth, giving everyone visibility on progress. |
| Strategic Metrics | Pick metrics that match your main goals, so your dashboard stays clear and relevant. |
- Prioritize sales activities that support your objectives.
- Don’t ignore other important tasks, but keep your main focus clear.
Continuous Improvement
A great dashboard grows with your team. You should always look for ways to make it better. Hold regular meetings with your sales and marketing teams to review goals and performance. Define shared KPIs, like lead conversion rates or revenue targets, so everyone works together. Set up a feedback loop—ask your team what’s working and what’s not. Use their ideas to update your dashboard. Track key metrics like sales cycle length, win rates, and customer acquisition costs. Try A/B testing new strategies and see what works best. Run regular audits to spot areas for improvement. Stay up-to-date with the latest trends and tools. FineReport makes it easy to adjust your dashboard as your business changes, so you always stay ahead.
Note: Continuous feedback and small tweaks can turn a good sales dashboard into a powerful tool for growth.
Sales Dashboard Success Stories

Manufacturing Sales Management
You want to see real results from your sales dashboards. In manufacturing, companies use FineReport solutions to transform how they manage sales and boost revenue. When you track sales performance in real time, you can spot problems early and fix them fast. Many manufacturers have seen huge gains by switching to digital dashboards. You can cut production loss by 75% and reduce downtime by half. That means more revenue and less waste. You also get a 15% jump in productivity and operational efficiency. These numbers show what’s possible when you use the right tools.
| Outcome | Result |
|---|---|
| Production Loss Reduction | 75% |
| Productivity Gains | Up to 15% |
| Downtime Reduction | 50% |
| Quality Issue Prevention | 75% |
| Operational Efficiency Boost | 15% |
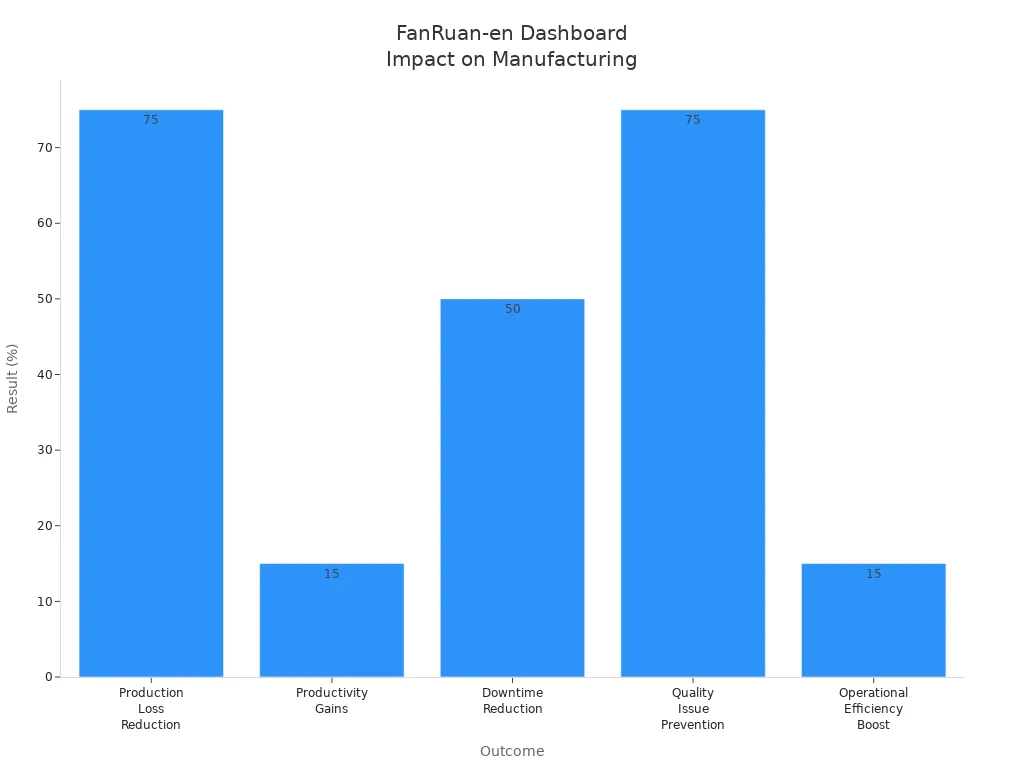
You can see how these dashboards help you drive more sales and increase revenue across your entire operation.
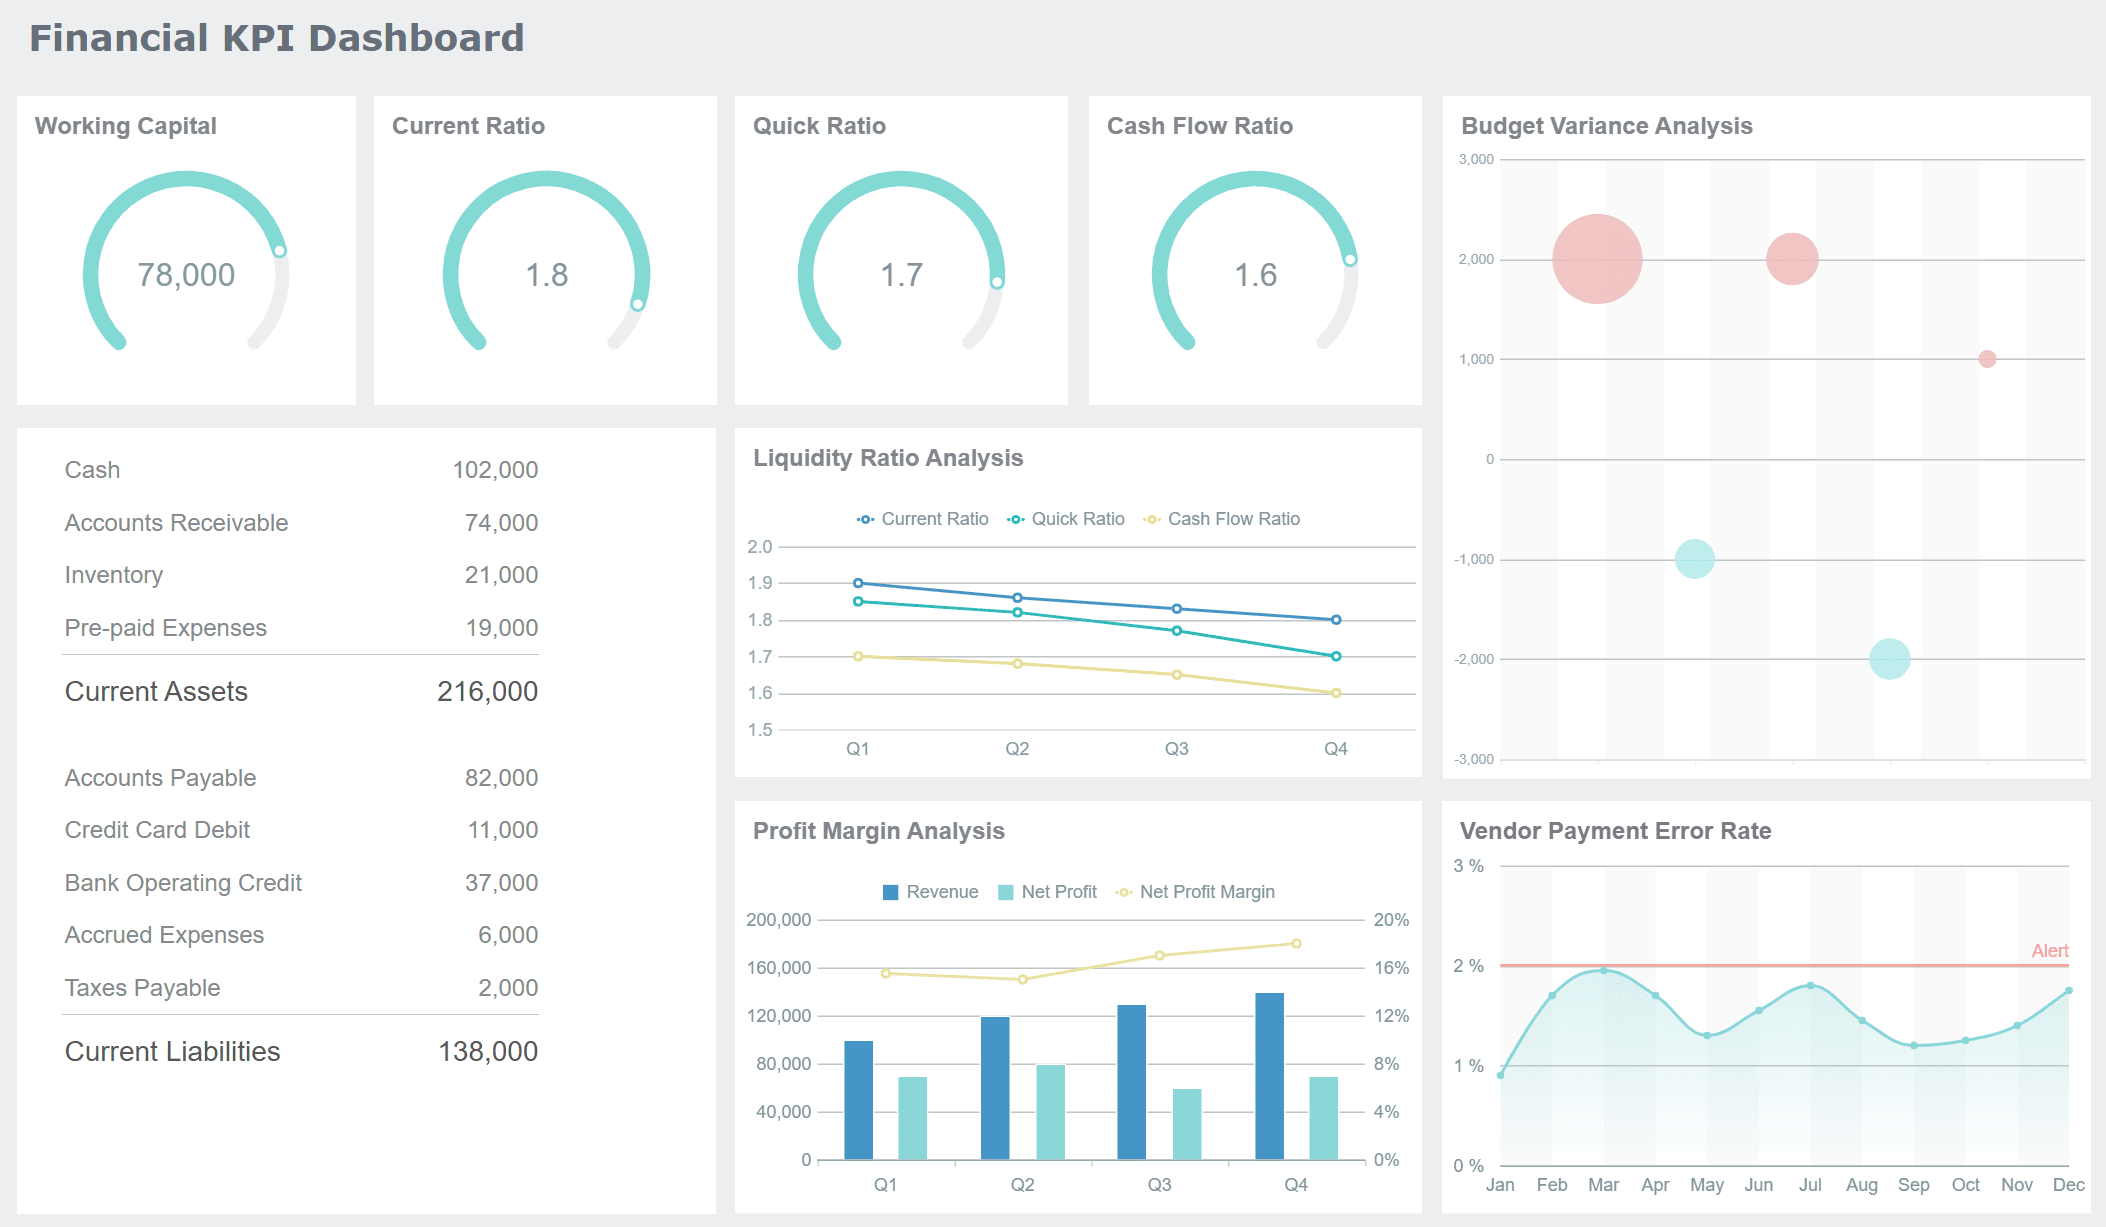
Financial Management Dashboards
If you work in finance, you know how important clear reports are for tracking sales and revenue. FineReport lets you design complex reports that meet strict standards. You can connect to many data sources and deploy dashboards with little disruption. This flexibility helps you keep your sales data organized and your revenue numbers accurate. FineReport also saves you money with a cost-effective licensing model. You get all the features you need without paying for every user. That means more budget for growing your sales team and increasing revenue.
| Benefit | Description |
|---|---|
| Comprehensive report design | Create pixel-perfect reports for financial statements and compliance. |
| Flexible deployment | Connect to multiple data sources with minimal disruption. |
| Cost-effective licensing model | Save money with concurrent user licensing, not per user fees. |
You can trust your dashboards to deliver the insights you need for better sales and revenue decisions.
When you use FineReport solutions, you set your team up for more sales wins and higher revenue.
Choosing the right sales dashboard sets your team up for success in 2026. You get real-time visibility, tailored metrics, and AI-powered insights that help you act fast. FineReport make it easy to prepare data, analyze sales, and share results. Here’s what you gain:
| Key Takeaway | Description |
|---|---|
| Real-time visibility | See current sales activities and respond instantly. |
| Tailored metrics | Give each role the data they need for better decisions. |
| Easy dashboard creation | Build dashboards quickly with drag-and-drop tools. |
You can start by simplifying your dashboard, focusing on the most important KPIs, and aligning metrics with your sales goals. Keep improving your dashboards to stay ahead and drive more sales wins.
Continue Reading About Sales Dashboard
10 Must-Have Marketing Dashboard Tools for Agencies
What is a Digital Marketing Dashboard and Why Does it Matter
Key Marketing KPIs to Track for Smarter Dashboard Insights
Top 12 Marketing Analytics Dashboard Templates for Smarter Campaigns
Business Intelligence Marketplace Growth and Emerging Trends for 2026


FAQ

The Author
Lewis
Senior Data Analyst at FanRuan
Related Articles

How to Build an Investment Portfolio Reporting Dashboard for Executives: KPIs, Benchmarks, and Drill-Down Views
Investment portfolio reporting for executives is not about showing every holding, transaction, and chart your investment team can produce. It is about giving CEOs, CFOs, CIOs, boards, and investment committees a fast, re
Yida YIn
Jun 25, 2026

12 KPI Reporting Examples for Executive Dashboards: What to Show in Weekly, Monthly, and Quarterly Reviews
Executive leaders do not need more data. They need decision ready $1 examples that match how often they review the business and what actions they are expected to take. A weekly $1 should surface fast moving risks and per
Yida YIn
Jun 25, 2026

How to Build a Digital Marketing Reports Dashboard: Executive Examples, KPIs, and Templates
A $1 is the control layer that helps executives and marketing leaders turn scattered channel data into fast, confident decisions. If you are a CEO, CMO, operations director, or marketing analytics lead, the real problem
Yida Yin
May 07, 2026