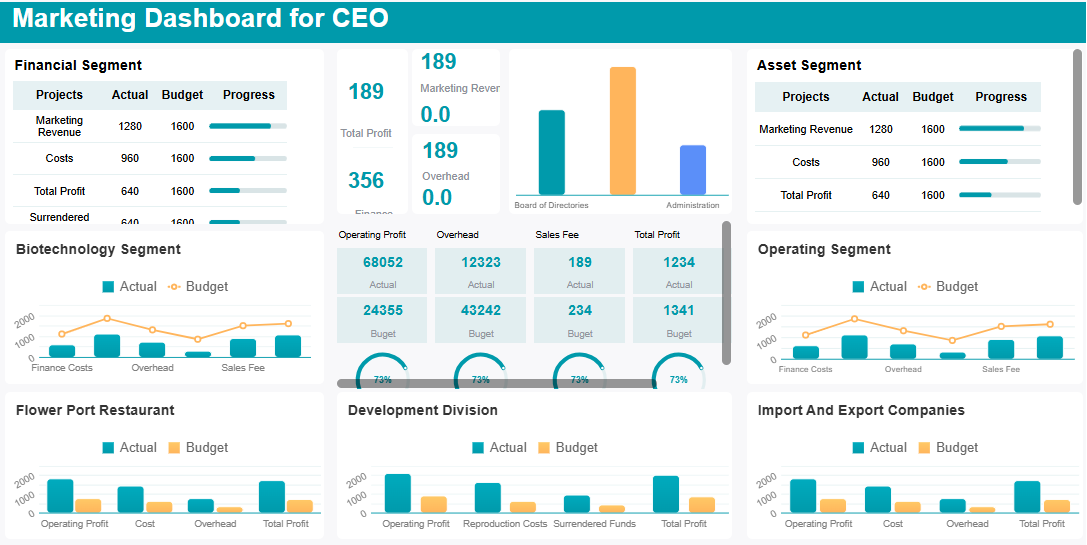
An online marketing dashboard is a visual tool that collects and displays your marketing data in one place. You use it to track important numbers, spot trends, and measure the success of your campaigns. With a dashboard, you see real-time updates and clear charts that help you make fast decisions.
Tracking the right metrics matters for your business growth. Metrics show how well your marketing works, guide your decisions, and help you set goals. A good dashboard lets you evaluate performance, see where you need to improve, and compare your results to industry standards.
Many teams face information overload or struggle to connect their efforts to results. You can solve these problems by focusing on the most important data and organizing your dashboard for clarity. Collaboration becomes easier when everyone uses the same dashboard, which brings your team together and helps you respond quickly to changes.
Online Marketing Dashboard: Set Marketing Goals and Metrics
Setting clear goals and choosing the right metrics form the foundation of an effective online marketing dashboard. You need to know what you want to achieve before you start tracking numbers. This section will guide you through defining your objectives, selecting key performance indicators, and making sure your metrics support your business strategy.
Define Objectives for Your Online Marketing Dashboard
Start by asking yourself what you want your marketing dashboard to accomplish. Do you want to increase website traffic, generate more leads, or improve conversion rates? Each objective should be specific and tied to your overall business goals. For example, you might want to boost sales by 20% in the next quarter or grow your social media audience by 1,000 followers each month.
Tip: Make your objectives SMART—specific, measurable, actionable, relevant, and time-bound. This approach helps you focus on results you can actually achieve and measure.
Here are some common objectives organizations set when building an online marketing dashboard:
| Metric | Description |
|---|---|
| Website Traffic | Measures the number of visitors to the website. |
| Lead Generation | Tracks the number of potential customers interested in a product or service. |
| Conversion Rates | Indicates the percentage of visitors who complete a desired action. |
| Social Media Engagement | Assesses interactions on social media platforms. |
When you use FineReport, you can customize your objectives and metrics to match your unique business needs. The platform supports complex goal tracking, so you can monitor progress on multiple fronts at once.
Select Key Performance Indicators (KPIs)
Once you have your objectives, you need to decide which metrics will show your progress. These metrics are called key performance indicators. They help you measure success and spot areas for improvement. Choose KPIs that align with your goals and provide actionable insights.
Businesses often use the SMART criteria to pick the right KPIs. Each KPI should be:
- Specific
- Measurable
- Actionable
- Relevant
- Time-bound
For example, if your goal is to increase lead generation, your KPI might be the number of new leads captured each week. If you want to improve conversion rates, you might track the percentage of visitors who complete a purchase.
FineReport makes it easy to track and visualize your chosen KPIs. You can set up dashboards that display real-time data, compare results across campaigns, and adjust your strategy based on what you see.
Align Metrics with Business Strategy
Your marketing dashboard should do more than just display numbers. It should connect your marketing efforts to your company’s larger strategy. When you align your metrics with business goals, you can measure the true impact of your work.
- Metrics enable you to see how marketing activities affect overall business outcomes.
- They provide clear evidence of what works and what does not, so you can make meaningful improvements.
- Metrics help you show the value of your marketing to stakeholders and secure resources for future campaigns.
Many organizations find that alignment is a critical factor for marketing success. However, it can be challenging to achieve. A systematic approach to measurement and analysis helps you drive strategic growth and build a cycle of continuous improvement.
FineReport supports this process by allowing you to integrate data from multiple sources and customize your dashboard for different teams or management levels. You can create dashboards that highlight the metrics most relevant to each department, making collaboration and decision-making easier.
Note: Focus on metrics that align with your business objectives and provide actionable insights. This will help you get the most value from your online marketing dashboard.
By following these steps, you set a strong foundation for your marketing dashboard. You ensure that every metric you track has a purpose and supports your business strategy.
Online Marketing Dashboard: Collect and Integrate Data Sources
Building an effective online marketing dashboard starts with gathering accurate data from all your marketing channels. You need to collect information from databases, files, CRM systems, and other platforms to get a complete view of your marketing performance. When you bring all your data together, you can see how your campaigns work across different channels and make better decisions.
Gather Data for Your Marketing Dashboard
You should follow best practices when collecting marketing data. Start by standardizing data entry so everyone uses the same formats and rules. Automate deduplication to remove repeated records. Enrich your data by adding missing details. Assign ownership so each team member knows their responsibilities. Sync your systems in real time to keep information up to date. Monitor data quality metrics to catch errors early. Enable self-service access so your team can find the data they need without delays.
Poor data quality can lead to lost revenue and a poor customer experience. Clean data supports personalized marketing and helps your team work more efficiently.
Integrate Multiple Data Sources with FineReport
You can unlock the full power of your online marketing dashboard by integrating multiple data sources. This approach gives you a centralized view of all your campaigns. You no longer need to switch between platforms to check results. FineReport makes this process simple. The platform connects to a wide range of databases, files, and CRM systems. You can use its drag-and-drop interface to combine data from different sources into one dashboard. This integration streamlines your workflow and enhances your ability to spot trends.
- Centralized data improves decision-making.
- Consolidated information leads to deeper insights.
Ensure Data Accuracy and Real-Time Updates
You need accurate and current data for your online marketing dashboard to be effective. Set up continuous data updates so you always see the latest numbers. Use alerts and notifications to respond quickly to important changes. FineReport supports real-time data integration, which means your dashboard always reflects the most recent information. This feature helps you act fast and stay ahead in your marketing efforts.
Real-time access to accurate data gives you the confidence to make informed decisions and adjust your strategy as needed.
Choose the Right Online Marketing Dashboard Tool
Selecting the right tool is a crucial step when you want to create an effective marketing dashboard. The right platform helps you bring all your marketing data together, visualize trends, and make informed decisions. You need a solution that fits your team’s needs and supports your business goals. This section will guide you through comparing digital marketing dashboard platforms, show you how to create an effective marketing dashboard with FineReport, and help you evaluate usability and customization.
Compare Digital Marketing Dashboard Platforms
When you compare digital marketing dashboard platforms, you should focus on features that support your marketing objectives and make your workflow easier. The best platforms allow you to integrate real-time data from all your channels, automate reporting, and use interactive charts for deeper analysis. You want a dashboard that helps you track performance over time, compare results against targets, and annotate your findings for team discussions.
Here are some key criteria to consider:
- Real-time data integration across all channels
- Automated reporting and custom templates
- Visual analytics and interactive charts
You should also look at how each platform measures volume, quality, value, and cost. The table below summarizes these criteria:
| Criteria Type | Examples |
|---|---|
| Volume measures | Unique visitors, visits, pageviews |
| Quality measures | Conversion rate, bounce rate, duration |
| Value measures | Goal value per visit, revenue per visit, overall revenue |
| Cost measures | Overall cost, Google Ads costs |
| Customer satisfaction | Annual surveys, feedback from non-transactional websites |
A strong digital marketing dashboard platform lets you compare performance through time, measure results against your goals, and analyze both new and existing customers. You gain a complete view of your marketing efforts and can quickly identify what works best.
Create an Effective Marketing Dashboard with FineReport
You can create an effective marketing dashboard by choosing a tool that combines powerful features with ease of use. FineReport stands out as a top choice for marketing teams who want to build a digital marketing dashboard that delivers real value. With FineReport, you can connect to multiple data sources, including databases, files, and CRM systems. The drag-and-drop designer lets you build dashboards without coding, so you can focus on insights instead of technical details.
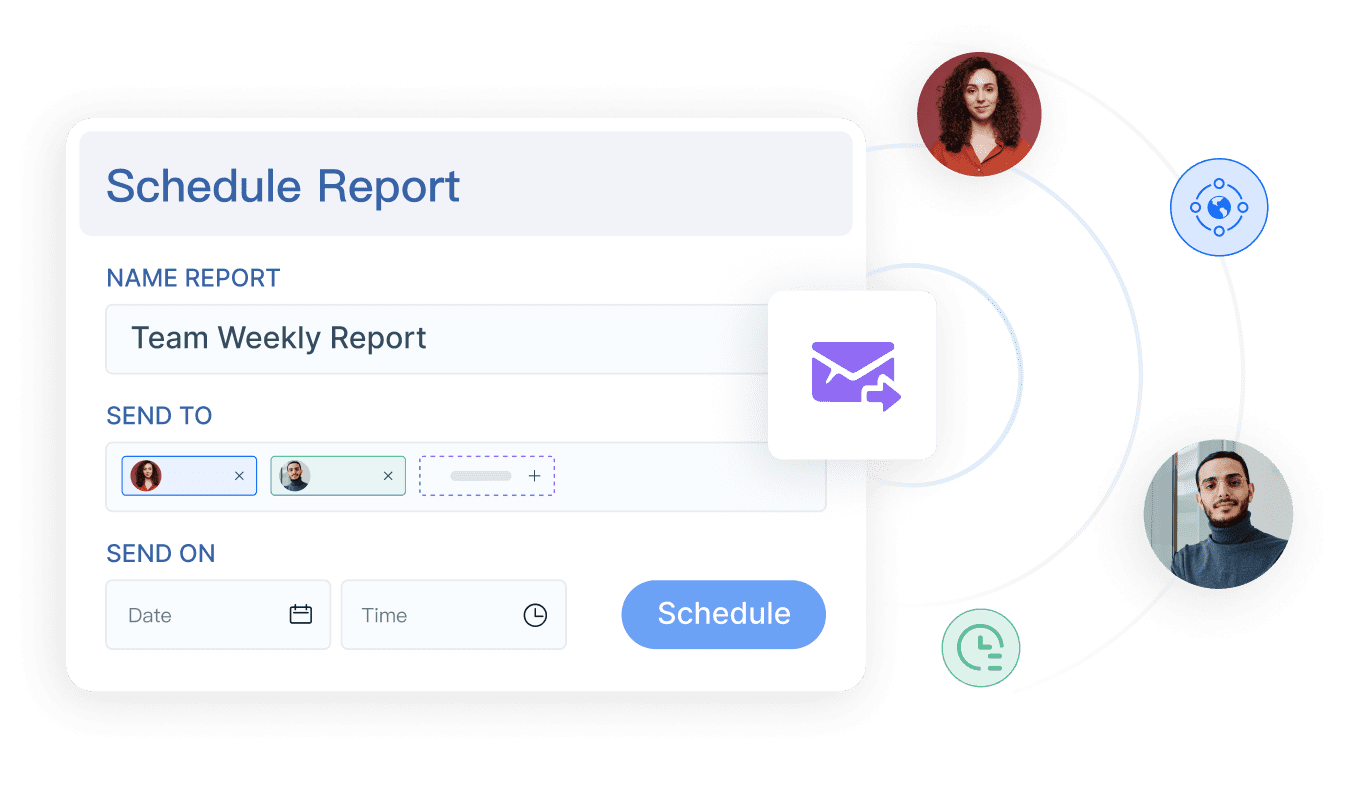
FineReport supports real-time data integration, which means your dashboard always shows the latest numbers. You can use customizable widgets to display charts, tables, and key metrics in a way that makes sense for your team. Automated reporting features allow you to schedule and send reports to stakeholders, saving you time and reducing manual work. Collaboration tools let your team discuss data directly within the dashboard, helping everyone stay aligned and make faster decisions.
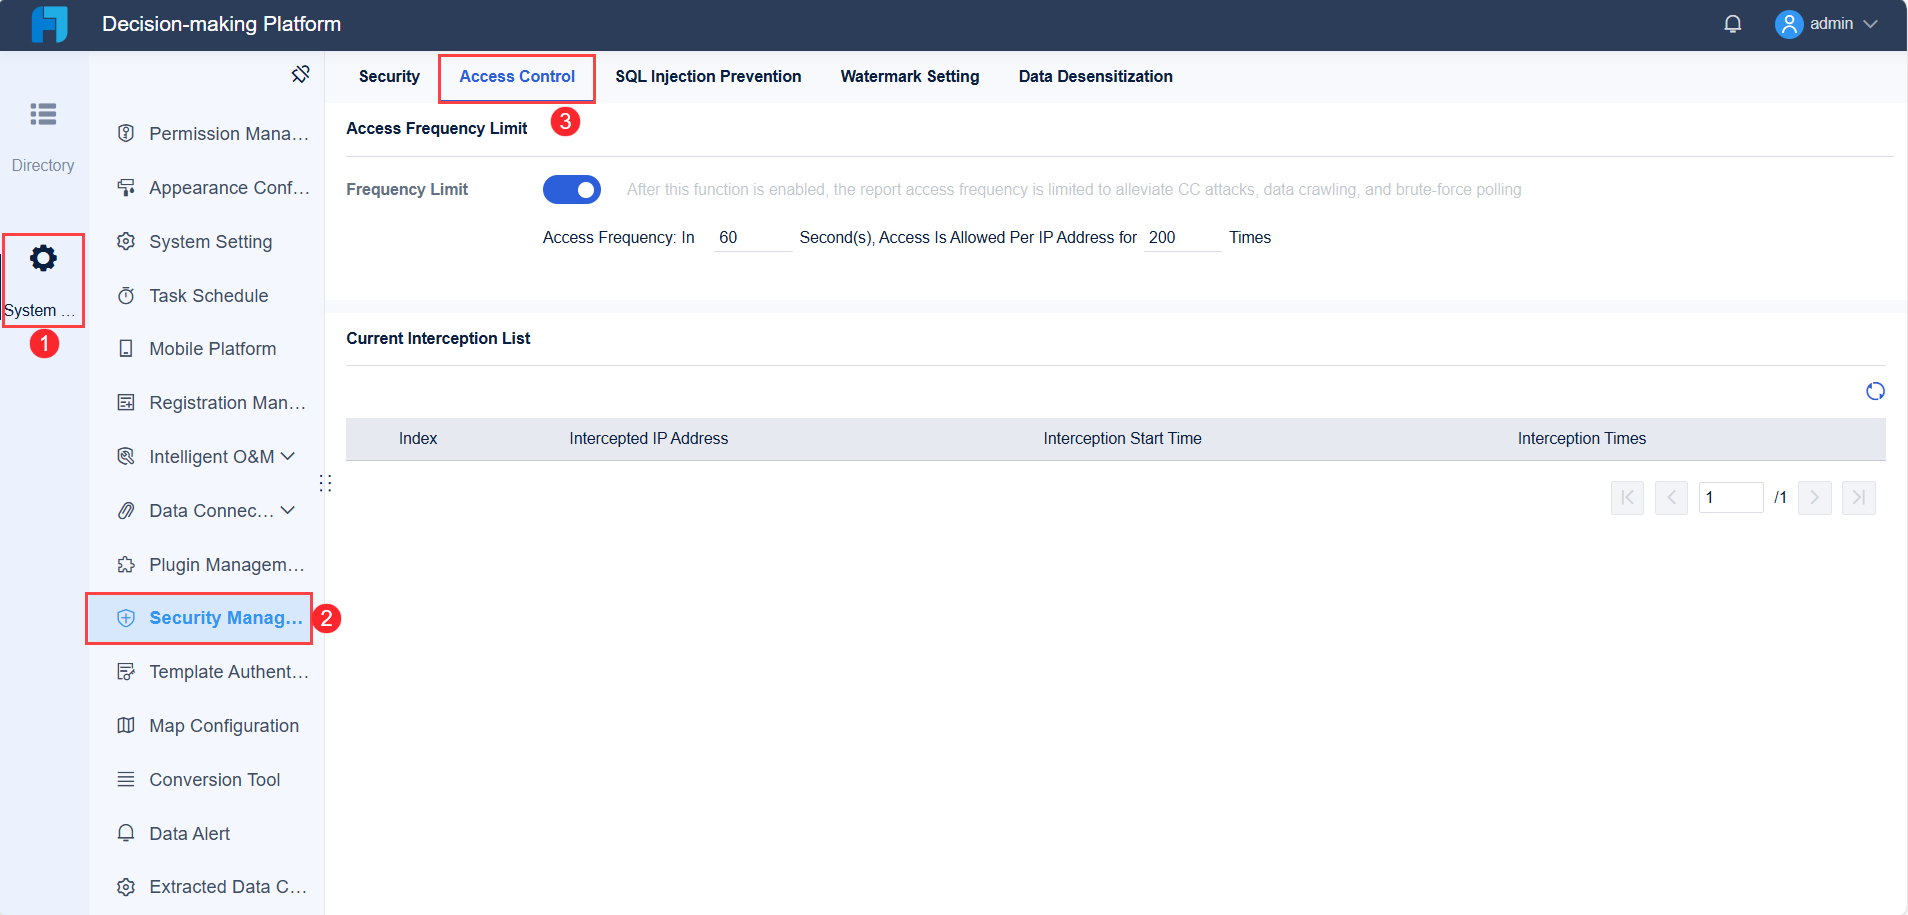
The decision-making platform in FineReport brings all your dashboards and reports together in one place. You can manage user accounts, set permissions, and ensure data security. This centralized approach makes it easy to share insights across departments and keep everyone focused on your marketing goals.
Consider Usability and Customization
Usability and customization play a major role in how well your team adopts a dashboard tool. A user-friendly interface reduces frustration and encourages everyone to use the dashboard regularly. Customizable dashboards let you focus on the metrics that matter most to your business, making your data more relevant and actionable.
Research shows that ease of use can directly improve adoption and utilization rates. Organizations that use customizable dashboards see better campaign optimization because they can analyze targeted data more effectively. The table below highlights the impact of usability and customization:
| Feature | Impact on Adoption |
|---|---|
| Usability | A user-friendly interface increases utilization and adoption rates. |
| Customization | Custom dashboards help teams focus on key metrics, improving decision-making. |
FineReport excels in both areas. The drag-and-drop designer makes it easy for anyone to build and update dashboards. You can customize layouts, choose from a wide range of visualization styles, and adapt the dashboard for different teams or management levels. FineReport also offers mobile access, so you can view and interact with your dashboards on any device, anytime.
When you choose a tool like FineReport, you empower your team to create an effective marketing dashboard that supports collaboration, drives better decisions, and adapts as your business grows. You gain a flexible solution that keeps your marketing efforts on track and helps you respond quickly to changes in the market.

Design and Build Your Online Marketing Dashboard
Designing an effective online marketing dashboard requires careful planning and attention to user experience. You want your dashboard to present information clearly, guide users to the most important insights, and support team collaboration.
Layout for Clarity and Usability
A clear layout helps users find information quickly and make better decisions. You should focus on these core design principles:
| Principle | Explanation |
|---|---|
| Clarity | Avoid clutter so users can focus on key data. |
| Visual Hierarchy | Place the most important metrics in prominent positions. |
| Appropriate Visualizations | Use bar charts for comparisons and line charts for trends. |
| Minimalism | Limit visual elements to prevent information overload. |
You can also group related information together and use consistent layouts to make your dashboard predictable and easy to navigate. FineReport offers flexible dashboard layout options, including tiled and full-screen views, so you can organize your data for maximum clarity.
Visualize Data for Actionable Insights
The right visualizations turn raw data into actionable insights. Select metrics that align with your marketing goals and use a mix of charts and tables to provide a complete view. For example, bar charts highlight campaign comparisons, while line charts reveal trends over time. Regularly update your dashboard to reflect current data, ensuring stakeholders always see the latest results.
FineReport supports a wide range of visualization styles, including interactive charts and 3D dashboards. These tools help you track key metrics, measure conversion rates, and demonstrate the value of your marketing efforts.
Customize Dashboard for Team Collaboration
Customizing your dashboard for different teams improves collaboration and efficiency. FineReport allows you to adjust portal content, set up favorites for quick access, and receive dynamic notifications about new reports or updates. The drag-and-drop designer makes it easy to build dashboards that match your team’s workflow.
| Feature | Description |
|---|---|
| Customizable Portals | Tailor dashboard content to user preferences. |
| Quick Data Access | Use favorites and recent visits for efficiency. |
| Dynamic Notifications | Stay informed about important changes. |
| Drag-and-Drop Components | Build dashboards quickly without coding. |
A well-designed dashboard can drive better marketing performance. Teams that use clear, actionable dashboards see improved decision-making and stronger results.
Share, Collaborate, and Optimize Your Online Marketing Dashboard
Sharing your online marketing dashboard with your team ensures everyone stays informed and aligned. You can boost collaboration, gather valuable feedback, and keep your dashboard effective by following a few best practices.
Share Your Marketing Dashboard with Teams
To maximize teamwork, you should:
- Clarify roles and workflows before sharing your dashboard. This step prevents confusion and keeps everyone accountable.
- Align on shared KPIs. When your team focuses on the same goals, your dashboard becomes a central tool for tracking progress.
- Use collaboration tools that fit your team size. Start with simple sharing and scale as your needs grow.
- Schedule regular meetings to review your dashboard together. Consistent communication helps your team avoid misunderstandings.
- Build a shared understanding of data by encouraging cross-training.
FineReport makes sharing easy. You can manage permissions with group authority control, so each department sees only the data they need. Scheduled reporting lets you automate dashboard updates and send insights to the right people at the right time. Mobile sharing means your team can access the dashboard anywhere.
Enable Feedback and Continuous Improvement
You should always encourage feedback on your dashboard. When team members share their thoughts, you can uncover ways to improve the dashboard’s design and usefulness. Customizing the dashboard based on user input ensures it meets everyone’s needs. This approach helps your team make better decisions and spot new opportunities quickly.
Tip: Set up a simple feedback channel so users can suggest changes or report issues with the dashboard.
Review and Update Dashboard Regularly
Regular reviews keep your online marketing dashboard relevant and effective. Use the table below to see the benefits of ongoing updates:
| Benefit | Description |
|---|---|
| Improved Team Alignment | Dashboards create transparency and reinforce collaboration across departments. |
| Enhanced Accountability | Visible metrics motivate teams to meet targets and maintain standards. |
| Reduced Manual Reporting Effort | Automated dashboards free up time for deeper analysis and strategic work. |
| Regular Review and Updates | Reviewing metrics ensures your dashboard reflects current priorities and market conditions. |
FineReport’s task scheduling feature helps you automate these reviews and updates, making sure your dashboard always delivers the most relevant insights.
You can create an effective online marketing dashboard by following these steps:
- Align marketing to business outcomes.
- Choose your metrics.
- Document the data chain.
- Acquire the data.
- Validate and review.
Choosing the right metrics and integrating data ensures your online marketing dashboard delivers real-time insights. Use a robust tool like FineReport to centralize information and support team collaboration. Simplify layouts, update dashboards regularly, and gather feedback to keep your dashboard relevant. Data-driven insights help you target audiences, improve ROI, and boost engagement.
| Benefit | Description |
|---|---|
| Precision Targeting | Tailor messaging and experiences to the right audience. |
| Improved ROI | Optimize budget allocation with detailed analytics. |
| Enhanced Engagement | Increase customer engagement with personalized content. |
Keep your dashboard clear and actionable to make better marketing decisions.

Continue Reading About Online Marketing Dashboard
Best Dashboard Apps for Business Insights
What is a Call Center Dashboard and Why Does It Matter
What is a Reporting Dashboard and How Does it Work
What is An Interactive Dashboard and How Does It Work
What is a Call Center Metrics Dashboard and How Does It Work


FAQ

The Author
Lewis
Senior Data Analyst at FanRuan
Related Articles

How to Build an Investment Portfolio Reporting Dashboard for Executives: KPIs, Benchmarks, and Drill-Down Views
Investment portfolio reporting for executives is not about showing every holding, transaction, and chart your investment team can produce. It is about giving CEOs, CFOs, CIOs, boards, and investment committees a fast, re
Yida YIn
Jun 25, 2026

12 KPI Reporting Examples for Executive Dashboards: What to Show in Weekly, Monthly, and Quarterly Reviews
Executive leaders do not need more data. They need decision ready $1 examples that match how often they review the business and what actions they are expected to take. A weekly $1 should surface fast moving risks and per
Yida YIn
Jun 25, 2026

How to Build a Digital Marketing Reports Dashboard: Executive Examples, KPIs, and Templates
A $1 is the control layer that helps executives and marketing leaders turn scattered channel data into fast, confident decisions. If you are a CEO, CMO, operations director, or marketing analytics lead, the real problem
Yida Yin
May 07, 2026