A marketing dashboard is a digital tool that brings together your marketing data from different sources, letting you track and visualize key performance indicators in one place. You use a dashboard to unify fragmented data, see real-time insights, and reduce manual reporting tasks.
| Feature | Benefit |
|---|---|
| Unification of Data | Combines data from all your platforms for a clear overview |
| Real-time Insights | Lets you make quick decisions using current information |
| Reduction of Manual Work | Automates reporting, saving you time for deeper analytics |
With a marketing dashboard, you can track ROI daily, link campaigns to revenue, and keep your team aligned with live metrics. Marketing dashboard generation helps you respond faster and make smarter decisions.
A marketing dashboard is a visual tool that brings together your marketing data from different channels, letting you track key performance indicators and measure the impact of your marketing efforts in one place.
| Term | Definition |
|---|---|
| Marketing Dashboard | A visual representation of key performance indicators (KPIs) and relevant data about or connected to your company’s marketing efforts. |
You use a marketing dashboard to centralize your data and gain a clear view of your marketing performance. This tool helps you see what works and what needs improvement. You can measure website traffic, conversion rates, and campaign results without switching between platforms. The dashboard also increases accountability by making results visible to your team and stakeholders.
| Purpose | Description |
|---|---|
| Data Centralization | Centralizes data for a comprehensive view of marketing performance. |
| Real-Time Insights | Provides near real-time insights into marketing efforts. |
| KPI Measurement | Tracks key performance indicators like website traffic and conversion rates. |
| Accountability | Enhances accountability among team members and stakeholders. |
| Data-Driven Decision-Making | Supports making informed decisions based on data analysis. |
Strong dashboards remove barriers between platforms by consolidating data into one view. Social performance, email engagement, paid media spend, website traffic, and CRM activity become part of a connected narrative instead of isolated metrics.
A marketing dashboard gives you agility and clarity. You can optimize your strategies, allocate resources wisely, and share insights with your team. This shared access helps everyone monitor progress and adjust plans quickly.
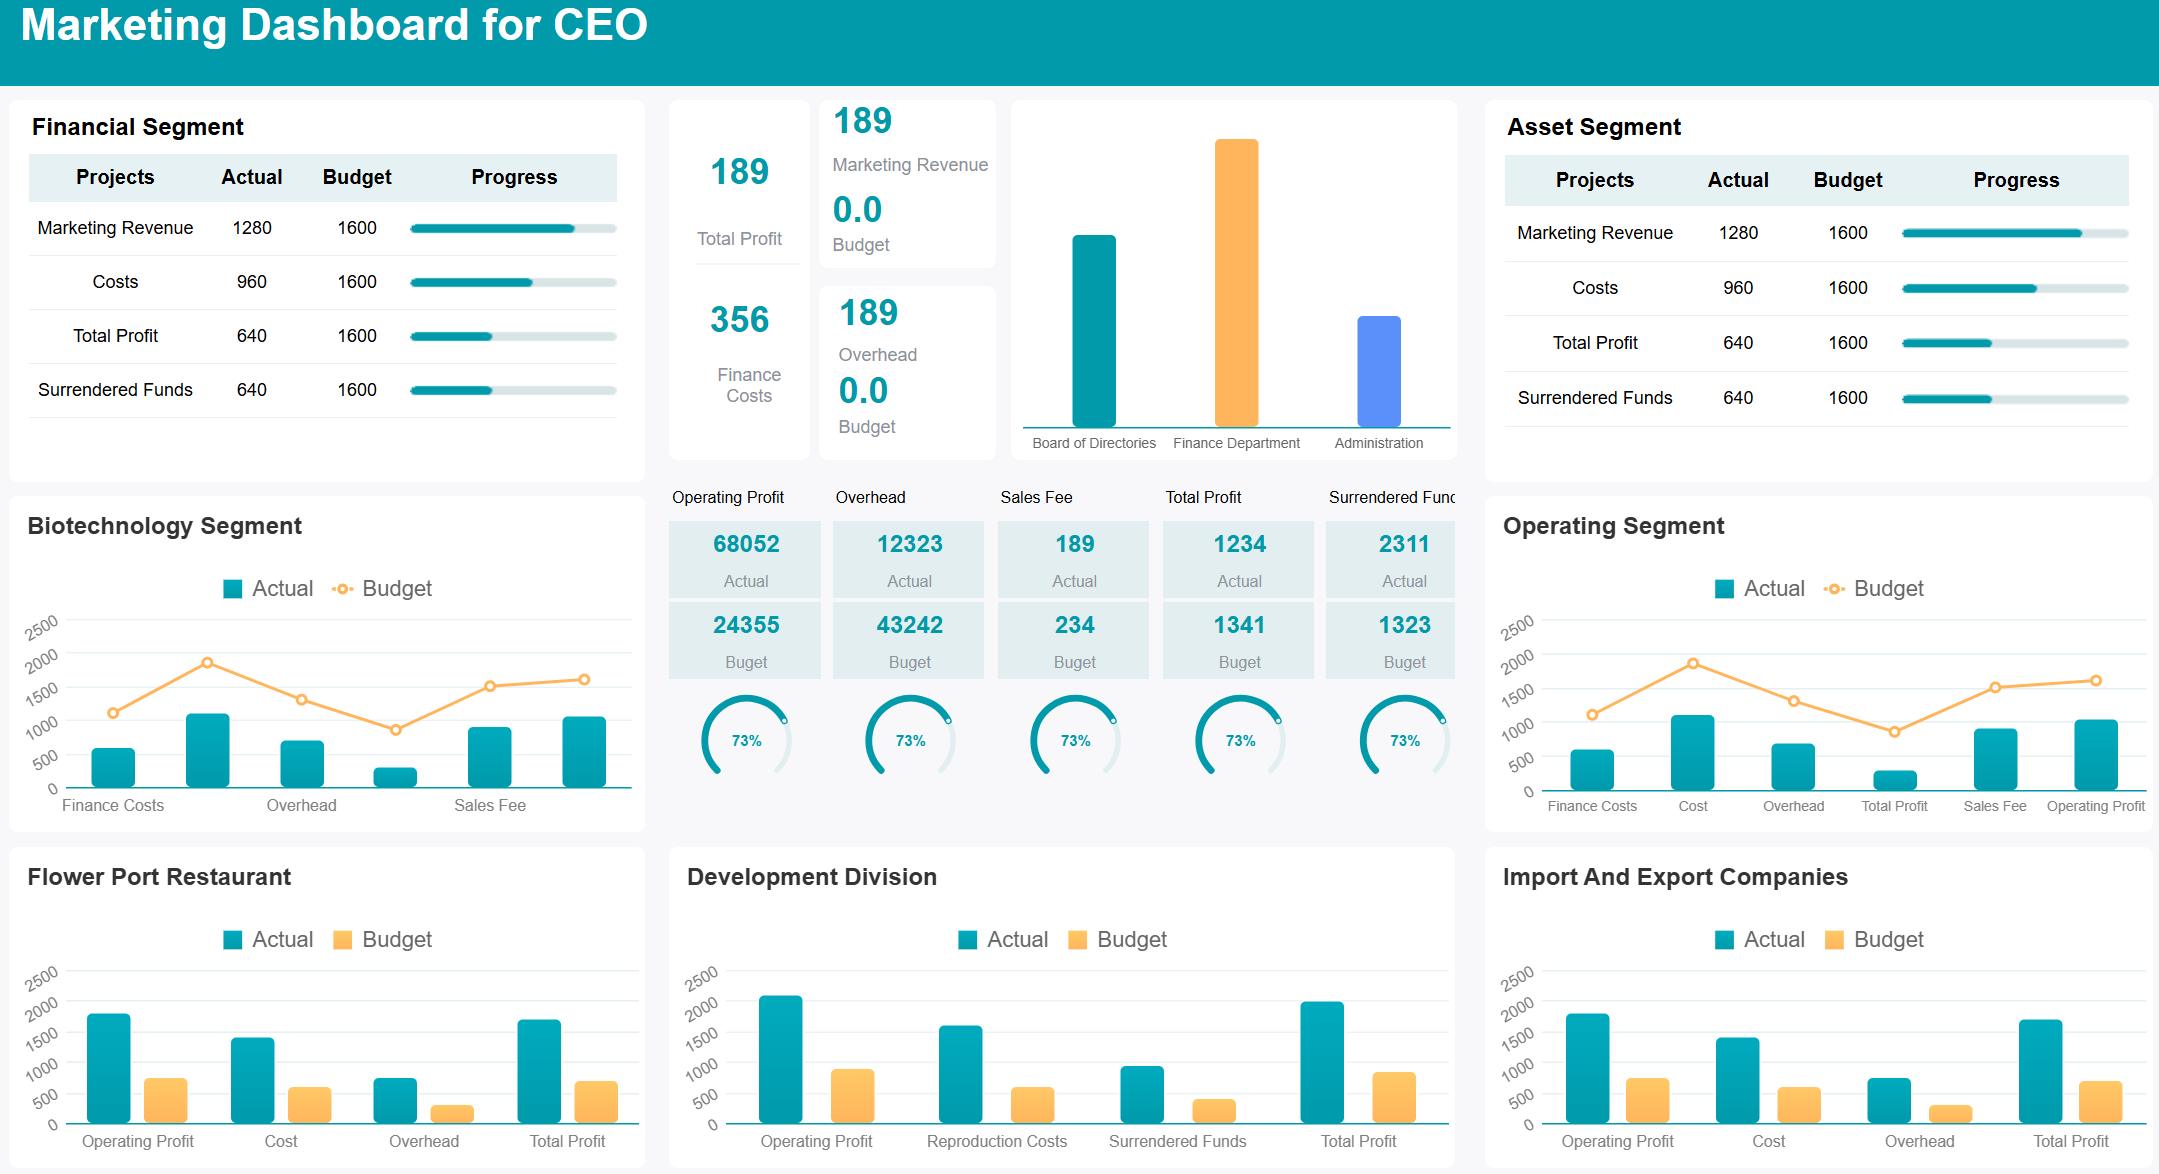
A marketing dashboard works by collecting, aggregating, and visualizing marketing data from multiple sources. You connect your dashboard to tools like Google Analytics, Facebook Ads, HubSpot, or Salesforce. The dashboard pulls in data from each platform and displays it in charts, graphs, and tables.
| Feature | Description |
|---|---|
| Aggregation | Combines metrics from various platforms like Google Ads, Facebook, LinkedIn, and TikTok into a single view. |
| Real-time Data | Provides up-to-date information for quick decision-making. |
| Visualization | Transforms raw data into meaningful insights, making complex analytics actionable. |
You can see all your marketing activities in one place. The dashboard acts as a command center for tracking KPIs across channels. You do not need to log in to each platform separately. Instead, you get a unified view that helps you spot trends and make decisions faster.
Common data sources you might integrate include:
Recent trends in marketing dashboard technology include tighter integration of marketing tools, real-time intelligence, and automated decision-making. Many dashboards now use artificial intelligence to predict consumer behavior and create content. You also see more cross-functional data collaboration, which means teams from different departments can share insights. The focus on first-party data has grown as privacy concerns rise and third-party cookies decline.
A marketing dashboard supports your marketing strategy by making data easy to access, understand, and use. You can track results, adjust campaigns, and improve performance—all from one place.
A marketing dashboard is a digital tool that displays your marketing data and key metrics in one unified view.
You use a marketing dashboard to track performance, spot trends, and make quick decisions. It brings together analytics from different sources, helping you see the big picture and act on real-time insights. This tool saves time, reduces errors, and supports smarter business strategies.
A marketing dashboard gives you a clear overview of your marketing data. You can automate data collection and visualization, which saves valuable time. You get consistent and accurate reports, so you can trust your insights. With organized analytics, you make better decisions and respond quickly to changes.
| Benefit | Description |
|---|---|
| Time Efficiency | Automating data collection and visualization saves time for strategy and analysis. |
| Consistency and Accuracy | Report automation minimizes human error, ensuring reliable and accurate insights. |
| Better Decision Making | Access to key metrics in a well-organized dashboard enables informed, data-driven decisions. |
A well-designed dashboard lets you monitor performance with real-time updates. You can tie analytics to business goals, making your marketing data more valuable. When you measure outcomes that matter to your customers, you clarify which metrics drive business results.
You empower your team to make confident decisions. Everyone sees the same data, which keeps your strategy focused and aligned.
You often face challenges like data silos, reporting delays, and manual errors. A marketing dashboard helps you overcome these problems by automating reporting and integrating data from multiple sources.
This shift turns your analytics from reactive to proactive. You identify trends early and make strategic decisions with confidence. Your marketing data becomes a powerful asset for growth.
A marketing dashboard is a digital tool that lets you track, visualize, and analyze key marketing metrics from multiple sources in one place, helping you make smarter decisions and improve your marketing performance.
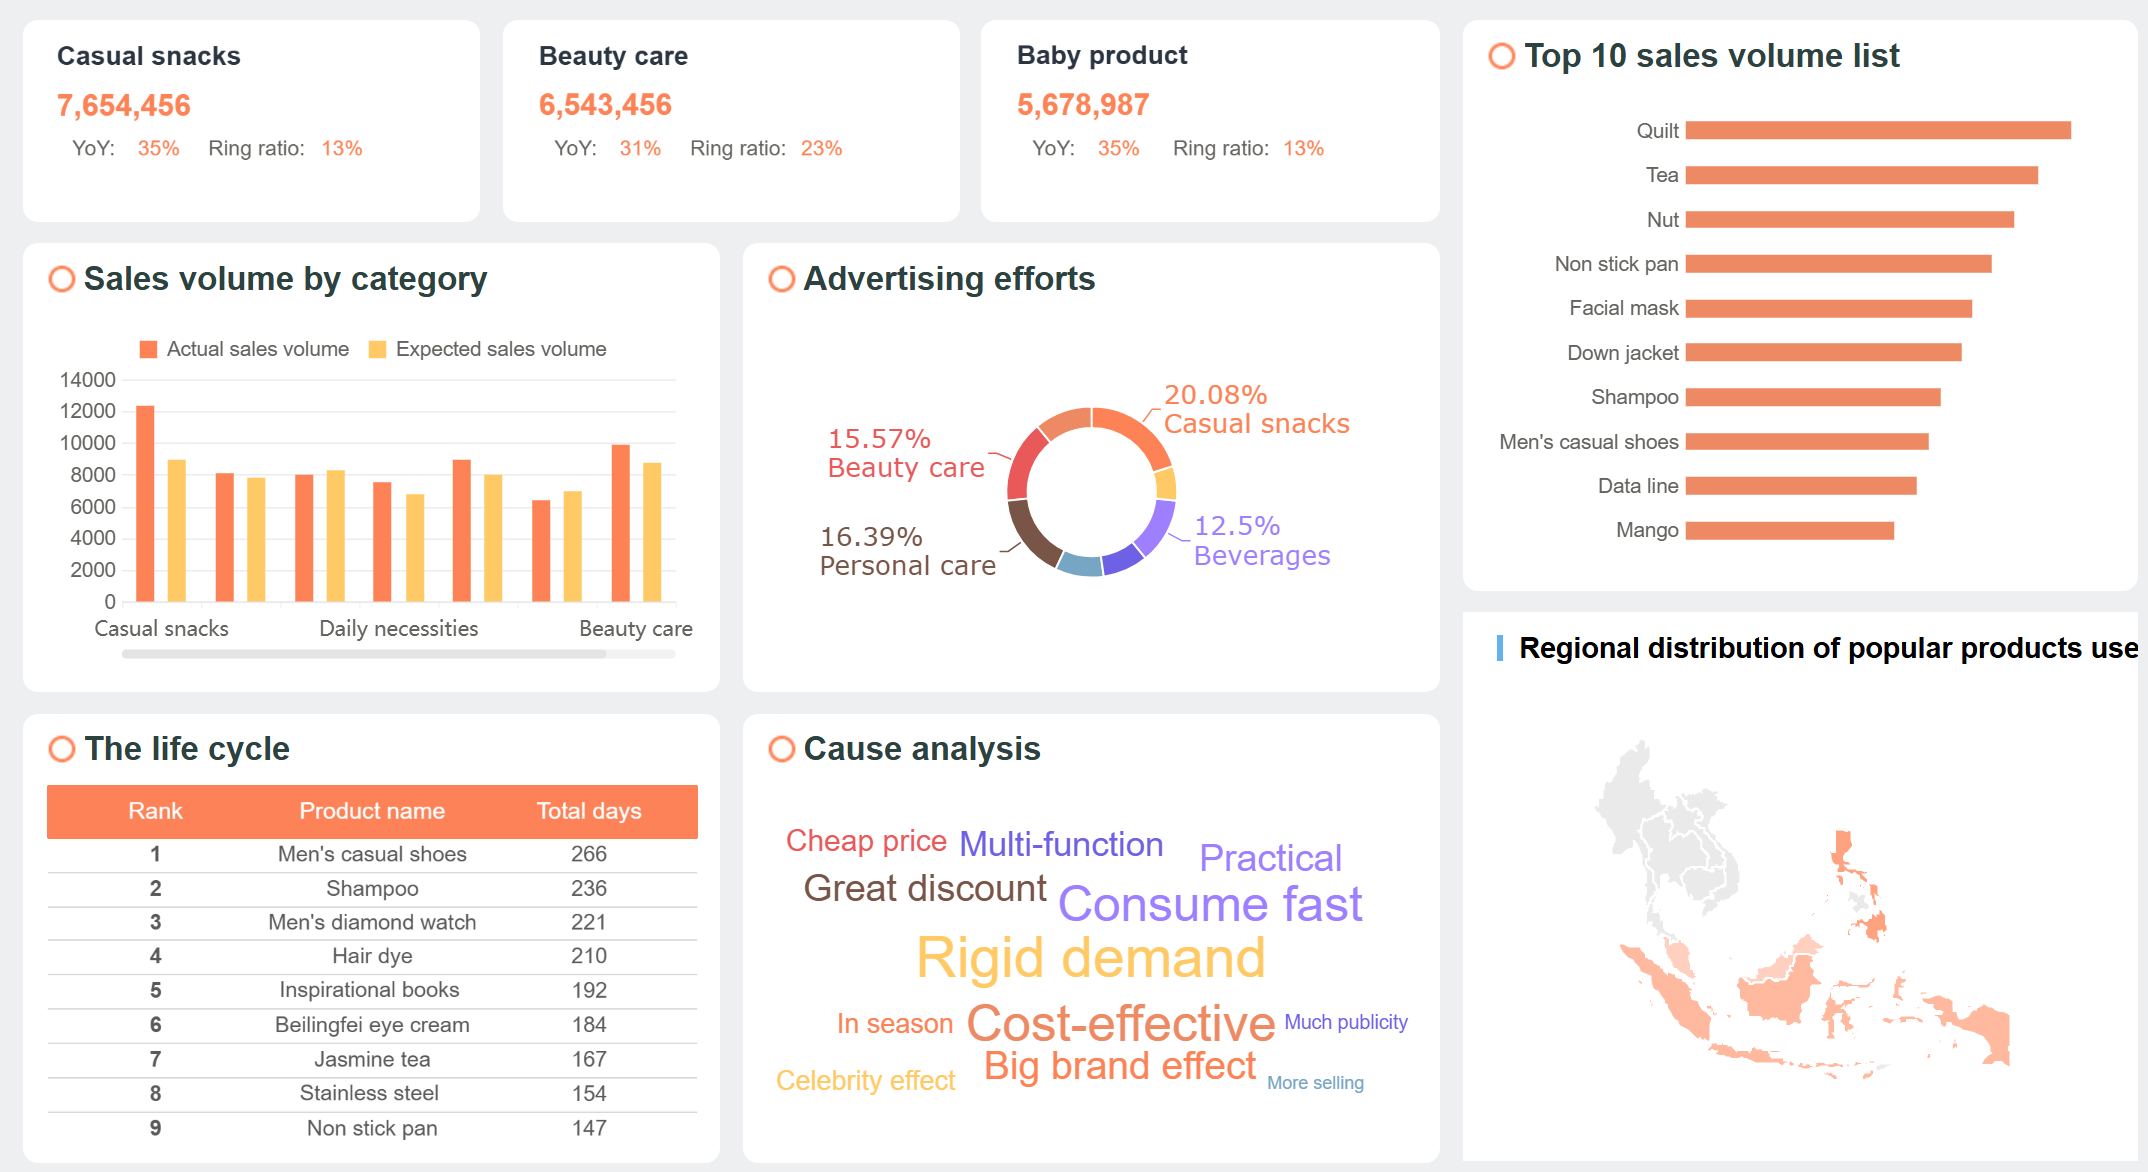
You need to monitor the right data to understand your marketing impact. A digital marketing dashboard brings together key marketing metrics that show how well your campaigns perform. Some of the most important metrics and KPIs you should track include:
Tracking these metrics helps you see what works and where you can improve. You get a clear view of your marketing data, making it easier to adjust your strategy.
Custom marketing dashboards let you choose which metrics matter most to your business. You can use visual tools like charts, graphs, and tables to make complex analytics easy to understand. Visual dashboards help you spot trends quickly and make better decisions. When you see your data in a clear format, you can focus your resources on the campaigns that deliver the best results.
FineReport gives you powerful features to build and use a digital marketing dashboard. You can connect data from many sources and view it all in one place. FineReport’s mobile dashboard supports remote teams with fast loading, interactive operations, and easy navigation on any device.
| Feature | Benefit |
|---|---|
| Optimized rendering | Quick access to dashboards, even on slow networks, for faster decisions. |
| Interactive operations | Better data visualization and analysis on the go, supporting team collaboration. |
| Self-adaptation and gesture | Smooth user experience on mobile devices for easy data interaction. |
| Reduced data transmission | Faster loading times, even on 3G networks, for real-time insights. |

FineReport also offers a decision-making platform and data entry capabilities, letting you manage and update your marketing data efficiently. You can create dashboards that support real-time analytics, multi-source integration, and advanced visualizations. This makes it easy to keep your team informed and your marketing strategy on track.

You need to select the right metrics and KPIs before you start designing a marketing dashboard. The best dashboards focus on data that matters most to your business goals. You should consider several criteria when making your choices:
| Criteria | Description |
|---|---|
| Data accuracy and relevance | Use clean, up-to-date data for reliable insights. |
| Customization and flexibility | Tailor the dashboard to your business needs and user roles. |
| Usability and accessibility | Make sure the dashboard is easy to read and understand for everyone. |
| Audience consideration | Choose metrics that match the needs of the people who will use the dashboard. |
| Alignment with strategic goals | Pick metrics that support your company’s main objectives, like lead generation or customer engagement. |
You should always start with your business questions. For example, ask what you want to learn about your campaigns or which actions drive the most sales. This approach helps you avoid clutter and keeps your dashboard focused.
You have many options for dashboard tools, but FineReport stands out for its flexibility and ease of use. FineReport gives you a drag-and-drop designer, so you can build dashboards without writing code. You can connect to multiple data sources, create interactive charts, and access your dashboards on any device.

| Feature | Description |
|---|---|
| Smart Report | Design and generate reports easily. |
| Visualizations & Dashboards | Create interactive dashboards and visual data displays. |
| Decision-making Platform | Make informed business decisions with integrated tools. |
| Mobile BI | Access dashboards and analytics on your phone or tablet. |
| Visual Chart | Build a variety of charts for different data types. |
| Data Collection | Integrate and collect data from many sources. |
| Deployment & Integration | Add dashboards to your existing systems with ease. |
FineReport’s zero-code operation and adaptive layout let you customize dashboards for any screen size. Real-time data updates keep your information current, so you always see the latest results.
You can follow these best practices to make your dashboard accurate and easy to use:
You may face challenges like unclear goals, crowded dashboards, or data integration issues. You can solve these by setting clear objectives, simplifying your design, training users, and automating data integration. FineReport helps you overcome these problems with its user-friendly interface and strong data management features.

Tip: Always test your dashboard with real users. Their feedback will help you make it better and more useful.
FineReport supports many industries, including retail and manufacturing. You can use it for reporting, data management, and business analytics. Here are some examples:
| Use Case | Description |
|---|---|
| Reporting Tool | FineReport works as a universal reporting and visualization tool for large datasets and teams. |
| Data Management | Connect to big data platforms and manage information better than with spreadsheets. |
| Business Reports | Create financial, sales, and marketing reports for different business needs. |
In retail, you can use FineReport to track membership management and customer engagement. You can segment customers, analyze buying patterns, and adjust your marketing strategies in real time. In manufacturing, you can monitor sales performance, set clear targets, and improve team coordination. For example, BOE Technology Group used FineReport to build KPI dashboards and unify data from different factories. This helped them cut inventory costs and boost operational efficiency.

FineReport’s drag-and-drop designer, mobile access, and automated reporting make it easy for you to build dashboards that drive results. You can focus on your goals, share insights with your team, and make smarter decisions every day.
A marketing dashboard is a digital tool that displays your key marketing metrics in one place, helping you track performance, analyze trends, and make informed decisions quickly.
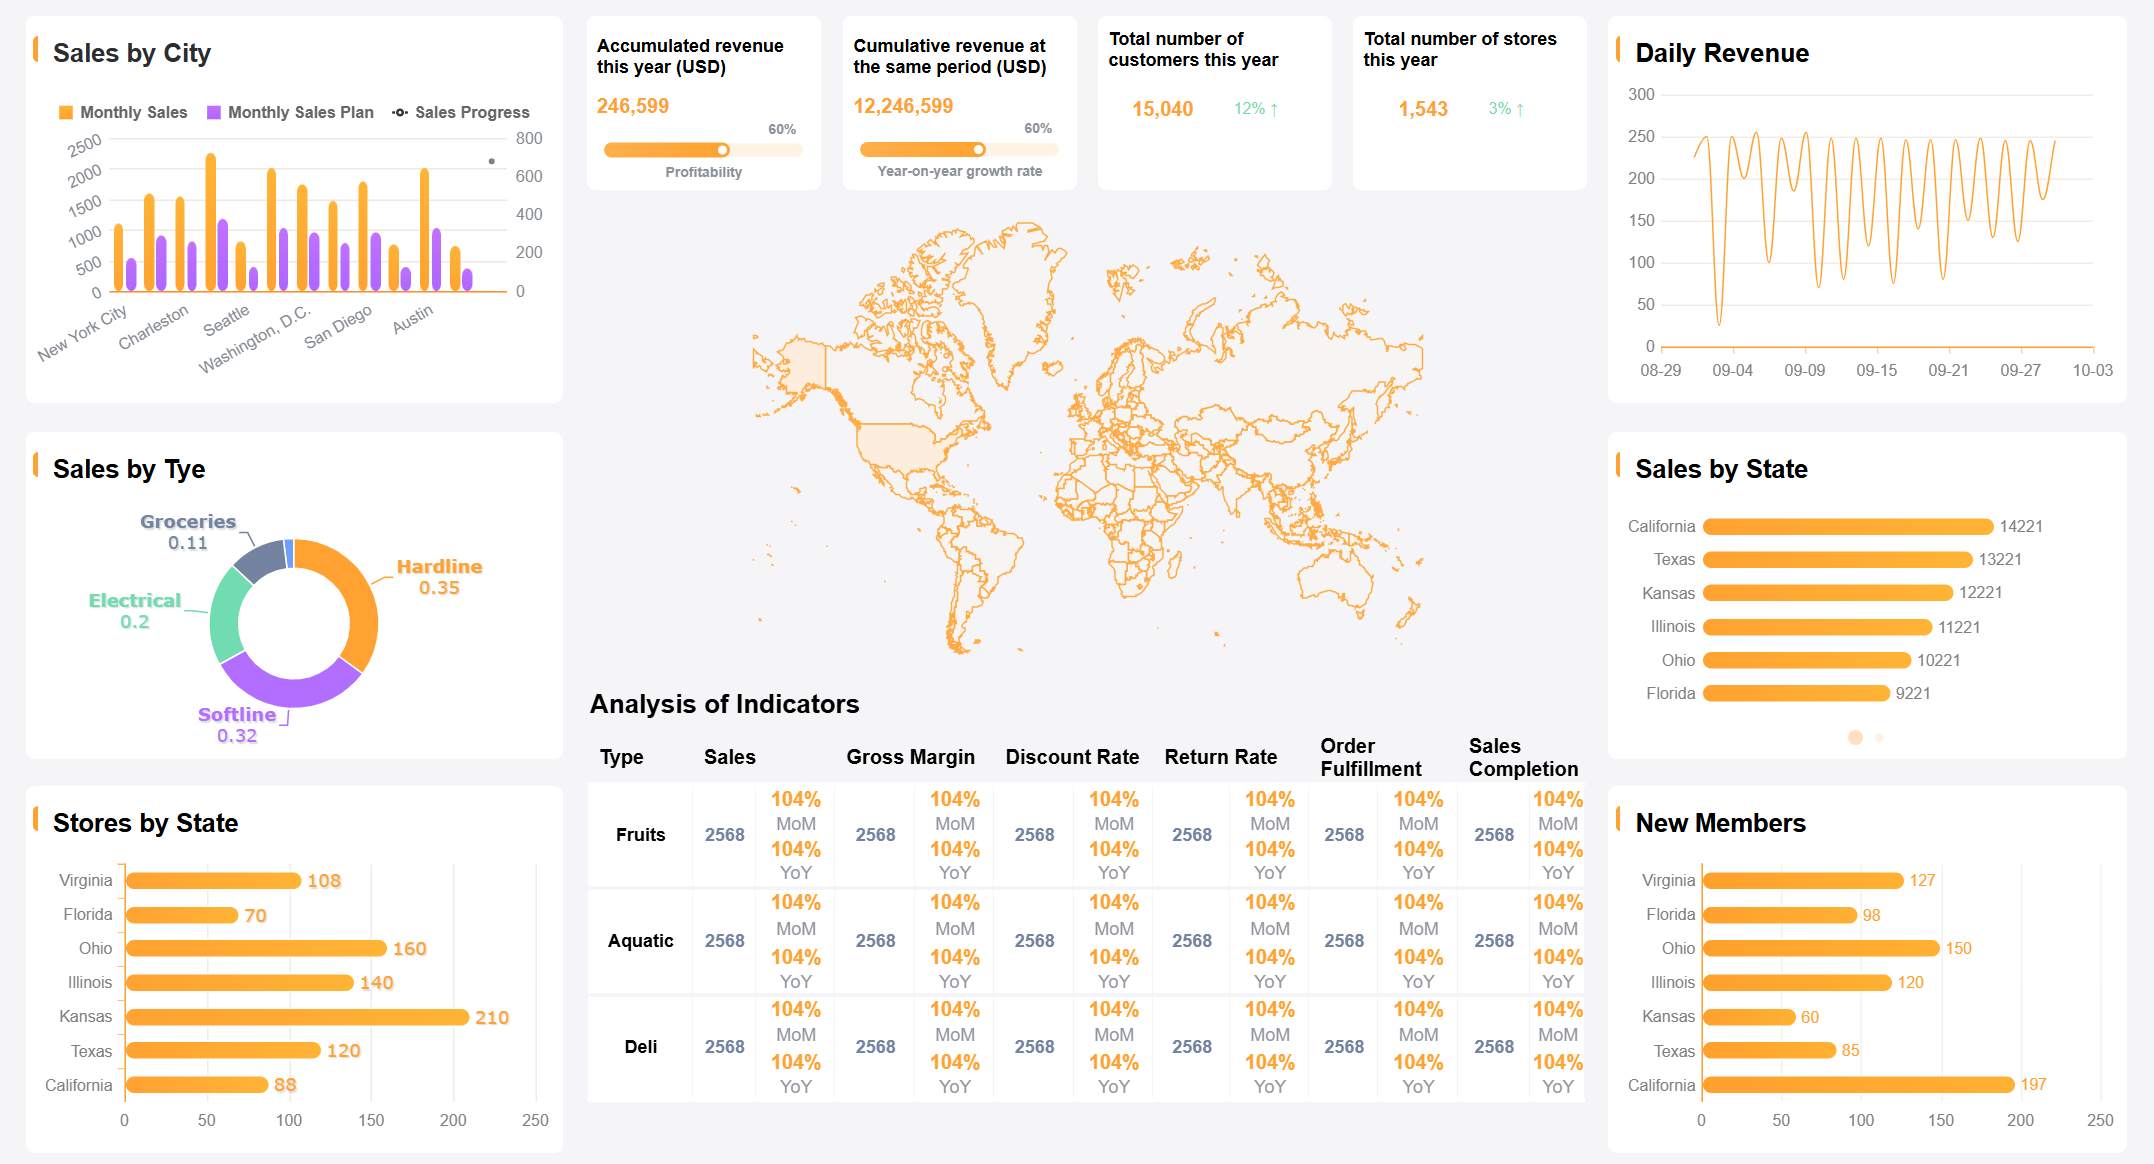
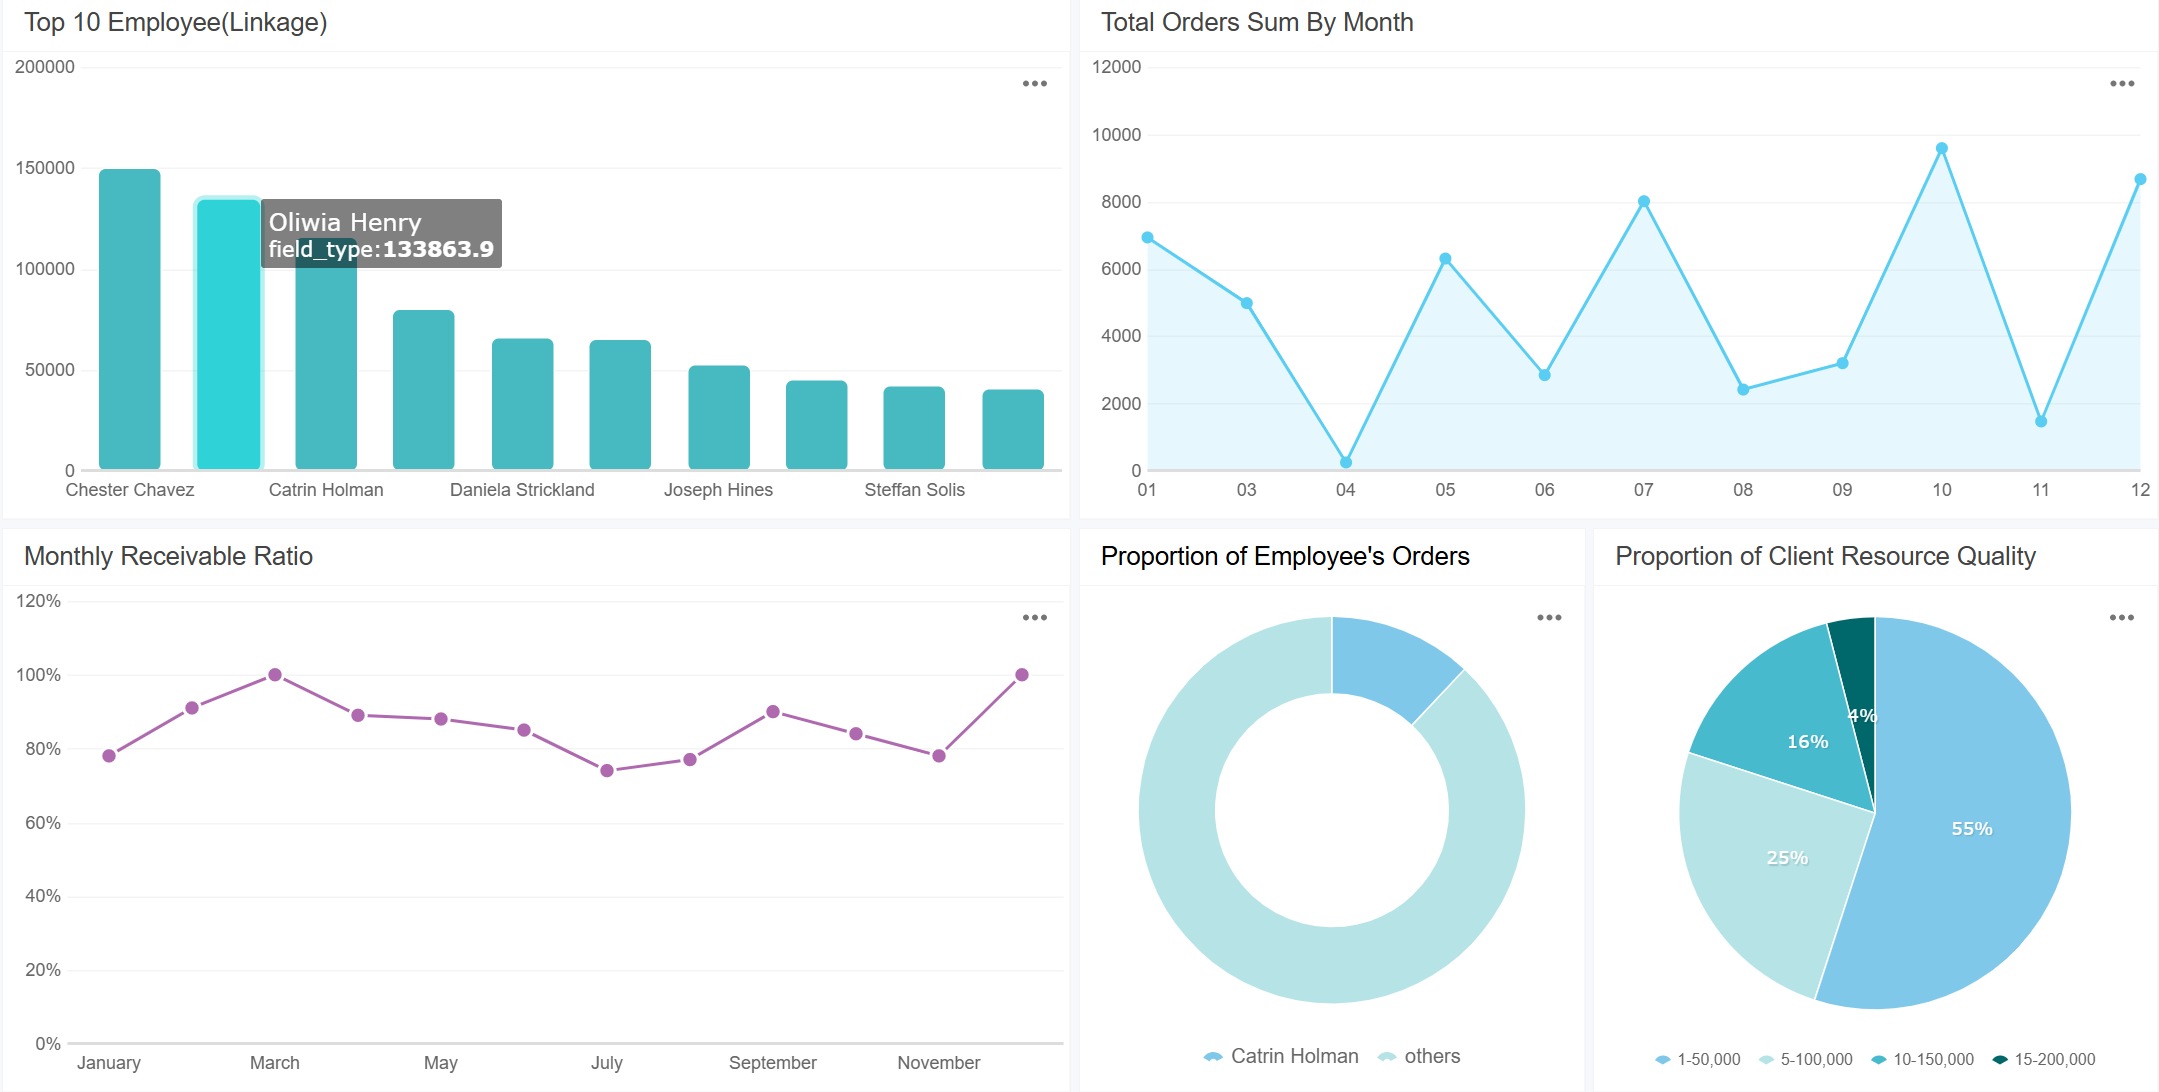
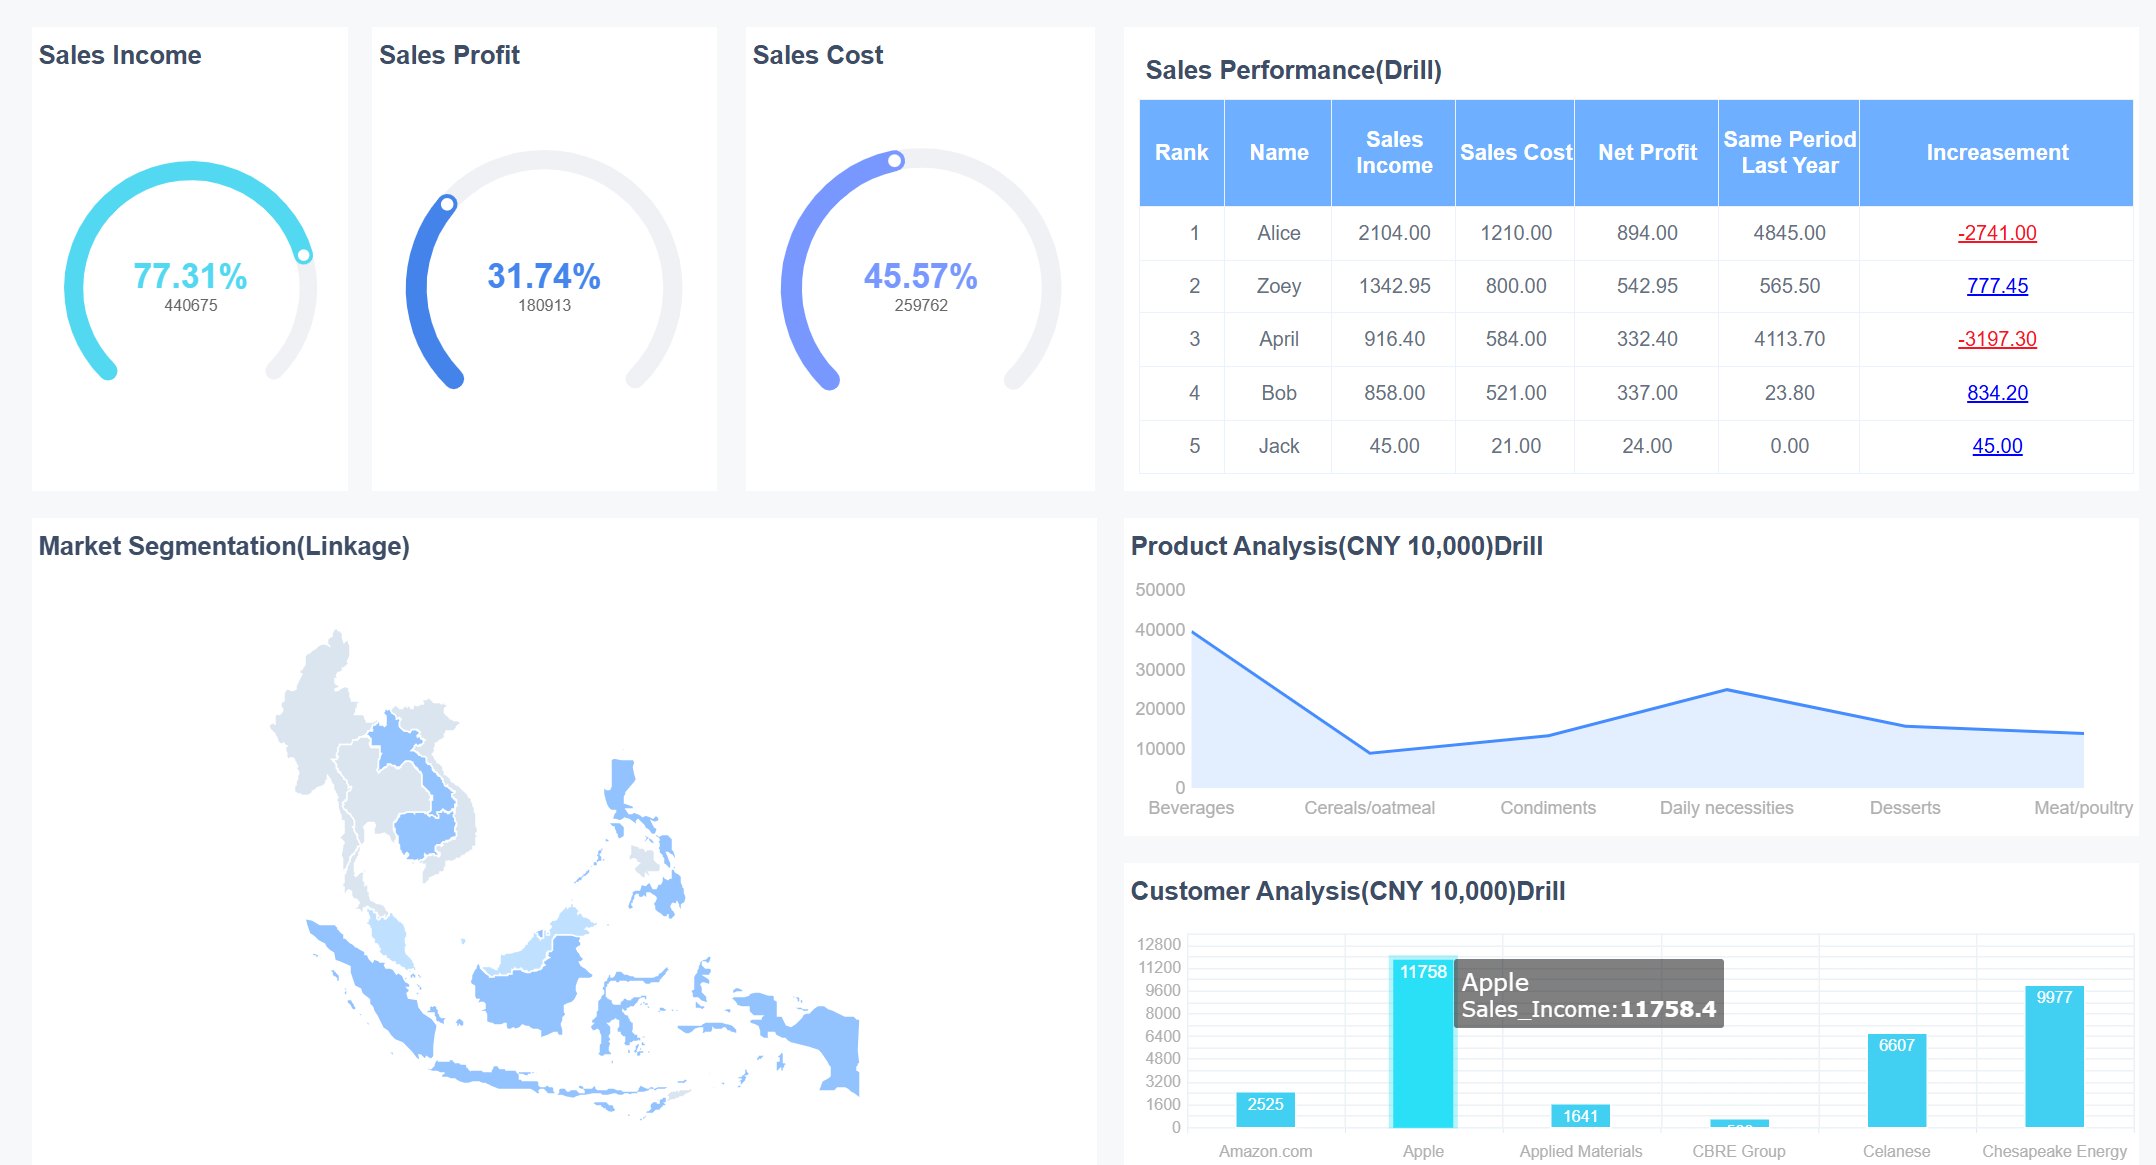
You can use FineReport to create marketing performance dashboards that transform raw data into actionable insights. For example, in sales management, you see real-time sales figures, conversion rates, and team rankings. Membership management dashboards let you monitor customer engagement, segment users, and track loyalty program results. FineReport supports operational efficiency by combining data from multiple sources and presenting it in clear visual charts.
| Feature | Description |
|---|---|
| Intuitive Visual Analysis | You gain insights into operations through visual representations of data. |
| Integration of Data Sources | You combine multiple data sources to maintain a connected business data ecosystem. |
| Report Management Platform | You manage users, reports, and permissions easily, improving operational efficiency. |
| Abundant Visual Charts | You use various visualizations to reflect the business value of data. |
| Data Entry Functions | You enter data simply, ensuring well-formed and manageable data collection. |
| Application in Sales Management | You support sales management scenarios with specialized dashboards. |
Tip: You can customize your dashboard layout with FineReport’s drag-and-drop designer. This makes it easy to focus on the metrics that matter most to your business.
You see FineReport dashboards in action across many industries. In retail, membership management dashboards help you analyze customer behavior and optimize marketing campaigns. You segment customers by purchase frequency and value, then target them with personalized offers. In manufacturing, marketing performance dashboards track sales targets, monitor team activities, and highlight areas for improvement. BOE Technology Group uses KPI dashboards to unify data from different factories, compare performance, and reduce inventory costs. These dashboards help you spot trends, improve efficiency, and support data-driven decisions.
You can apply these marketing dashboard examples to your own business. Whether you want to boost sales, manage memberships, or streamline operations, FineReport gives you the tools to build dashboards that deliver results.
A marketing dashboard is a digital tool that shows your key marketing data in one place for easy analysis and decision-making. You gain faster insights, improve teamwork, and boost results. Companies like Casper and Schneider Electric saw sales and campaign efficiency rise after using dashboards. FineReport helps you design flexible dashboards, connect data sources, and automate analytics. You can explore FineReport’s solutions to grow your business.
Tip: Start with clear goals and let your dashboard guide smarter decisions.
10 Must-Have Marketing Dashboard Tools for Agencies
What is a Digital Marketing Dashboard and Why Does it Matter
Key Marketing KPIs to Track for Smarter Dashboard Insights
Top 12 Marketing Analytics Dashboard Templates for Smarter Campaigns
Business Intelligence Marketplace Growth and Emerging Trends for 2026

The Author
Lewis
Senior Data Analyst at FanRuan
Related Articles

Payment Analytics Dashboard: 12 KPIs Every Operations Leader Should Track to Cut Revenue Leakage
Losing revenue to declines? Discover 12 essential KPIs to track in your payment analytics dashboard to stop leakage and manage disputes.
Lewis Chou
May 05, 2026

SOC Dashboard Explained: 12 Essential KPIs, Views, and Workflows Security Teams Use
Learn about SOC dashboards, the 12 essential KPIs for security teams, and how they centralize alerts and workflows for faster threat detection and response.
Lewis Chou
May 05, 2026

EMR Dashboard Guide: 12 Metrics to Track for Faster Clinical and Operational Decisions
Learn the 12 essential EMR dashboard metrics to track for faster clinical and operational decisions, improving patient flow and revenue cycle management.
Lewis Chou
May 05, 2026


