A business intelligence dashboard gives you a clear view of your organization’s most important data. You see facts instead of guesses, making it easier to choose the right strategy. Dashboard business intelligence tools show key metrics in real time, helping you spot trends and fix problems quickly. You work better with your team because everyone shares the same information. FineBI stands out as a top choice, offering powerful features that help you make smart decisions every day.
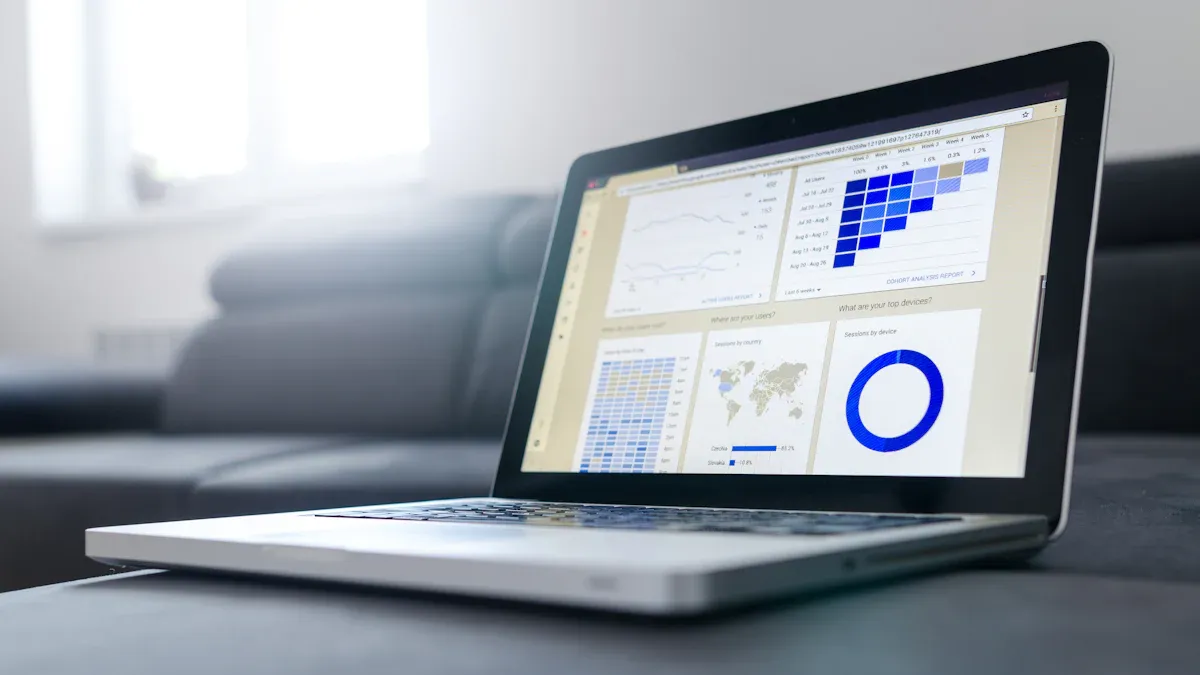
A business intelligence dashboard gives you a single place to view and understand your organization’s data. You see important numbers, trends, and patterns without searching through spreadsheets or reports. The dashboard business intelligence approach helps you track key performance indicators (KPIs), monitor progress, and spot problems early. You use dashboards to make decisions based on facts, not guesses.
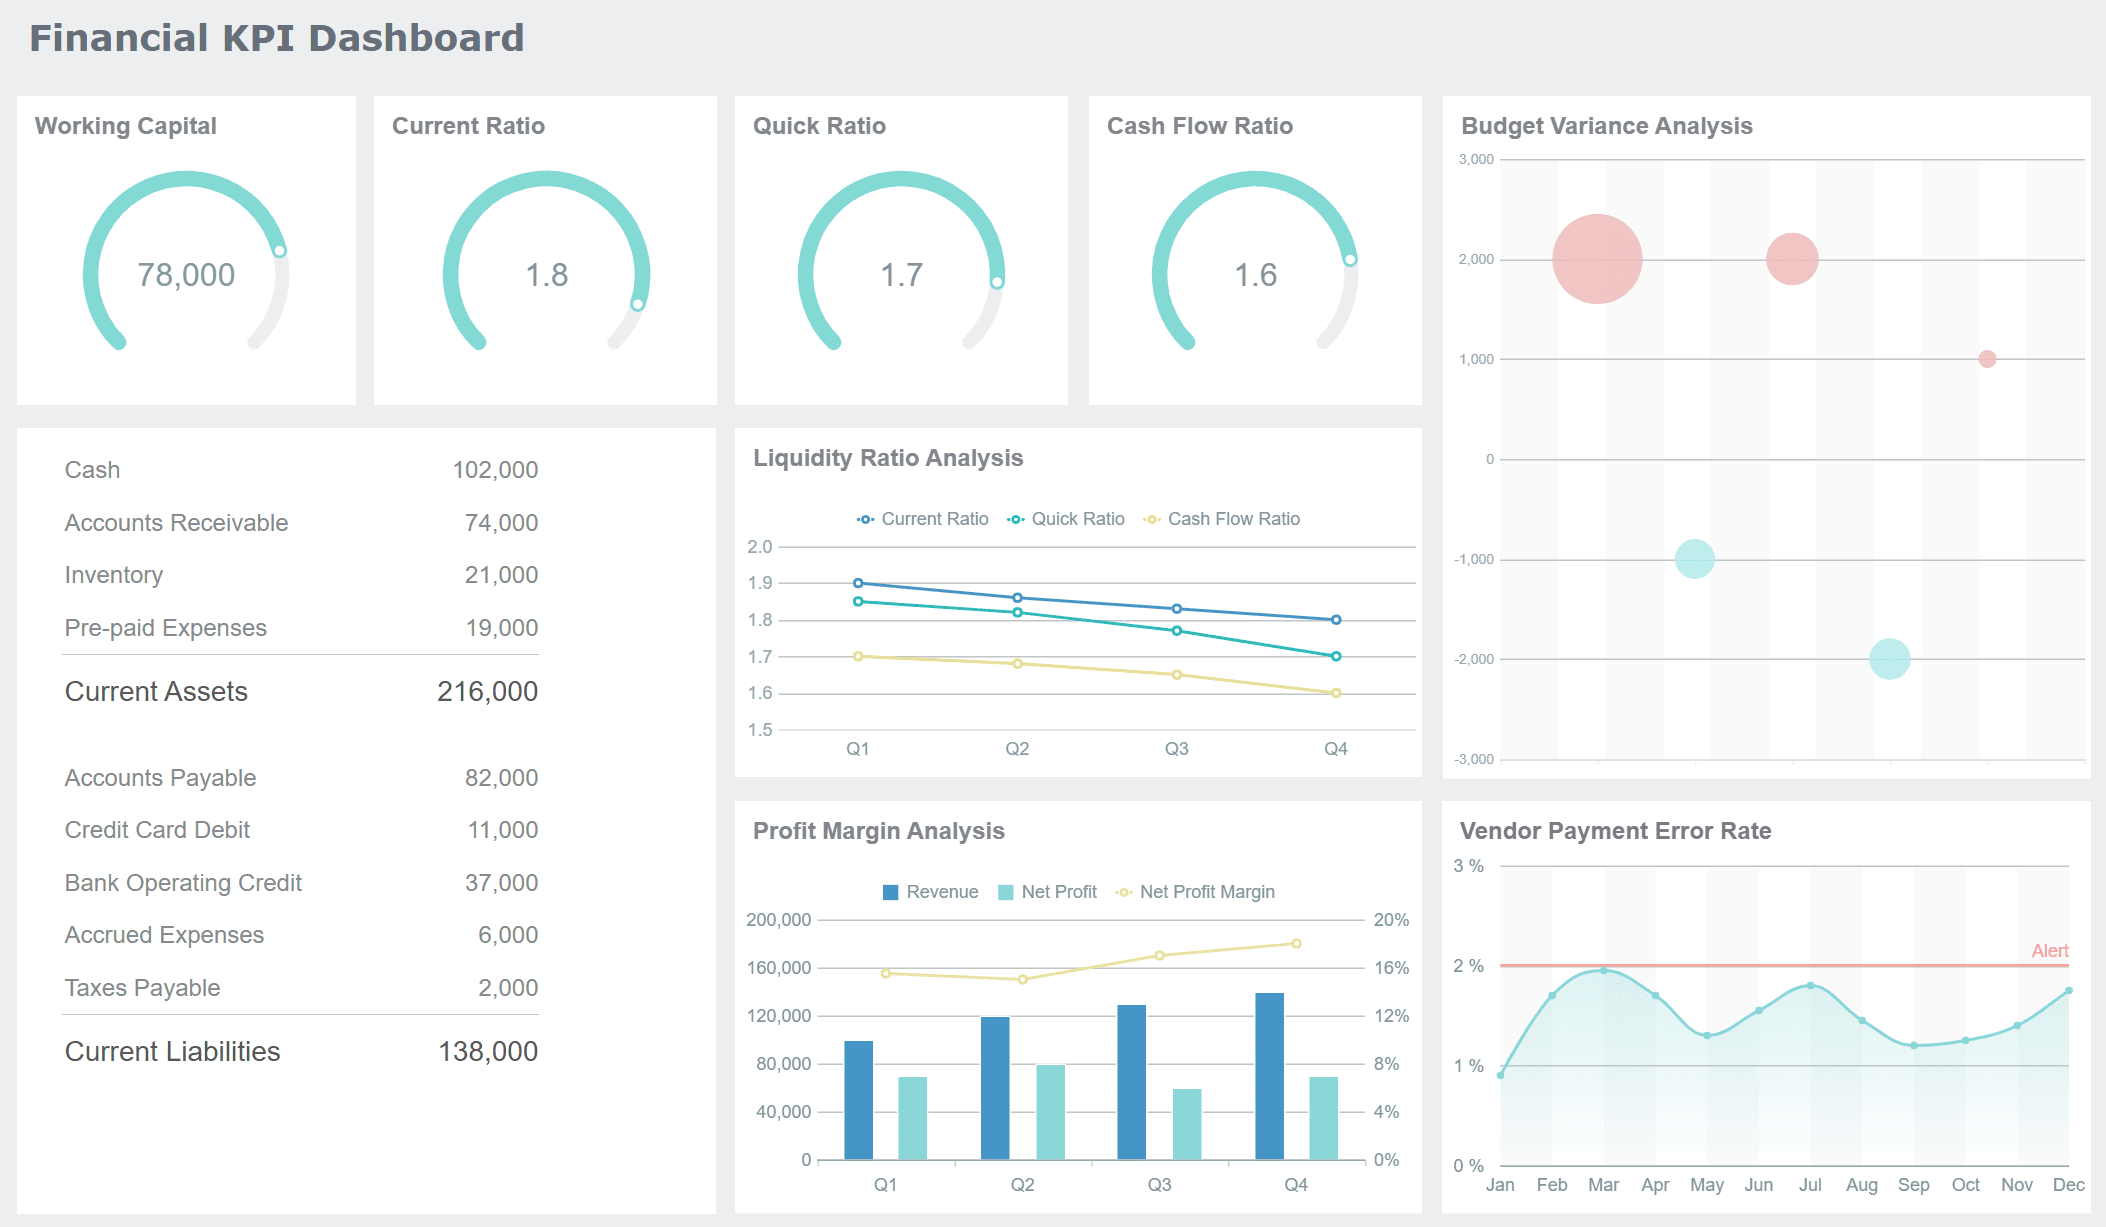
A business intelligence dashboard combines several core components to help you analyze and act on data quickly. The table below shows the main elements you find in most dashboards:
| Component | Description |
|---|---|
| Connections to data sources | Links to various data stores like data warehouses and lakes for real-time information. |
| Data visualizations | Various graphical representations of data, including charts and plots to display performance metrics. |
| Data tables | Tabular data providing quick insights, often enhanced with color coding for emphasis. |
| Drill-down capabilities | Allows users to click for more detailed data, facilitating deeper analysis. |
| Data filters | Interactive features enabling users to customize views based on specific parameters. |
| Text boxes and tooltips | Additional context and explanations for the visualized data, enhancing user understanding. |
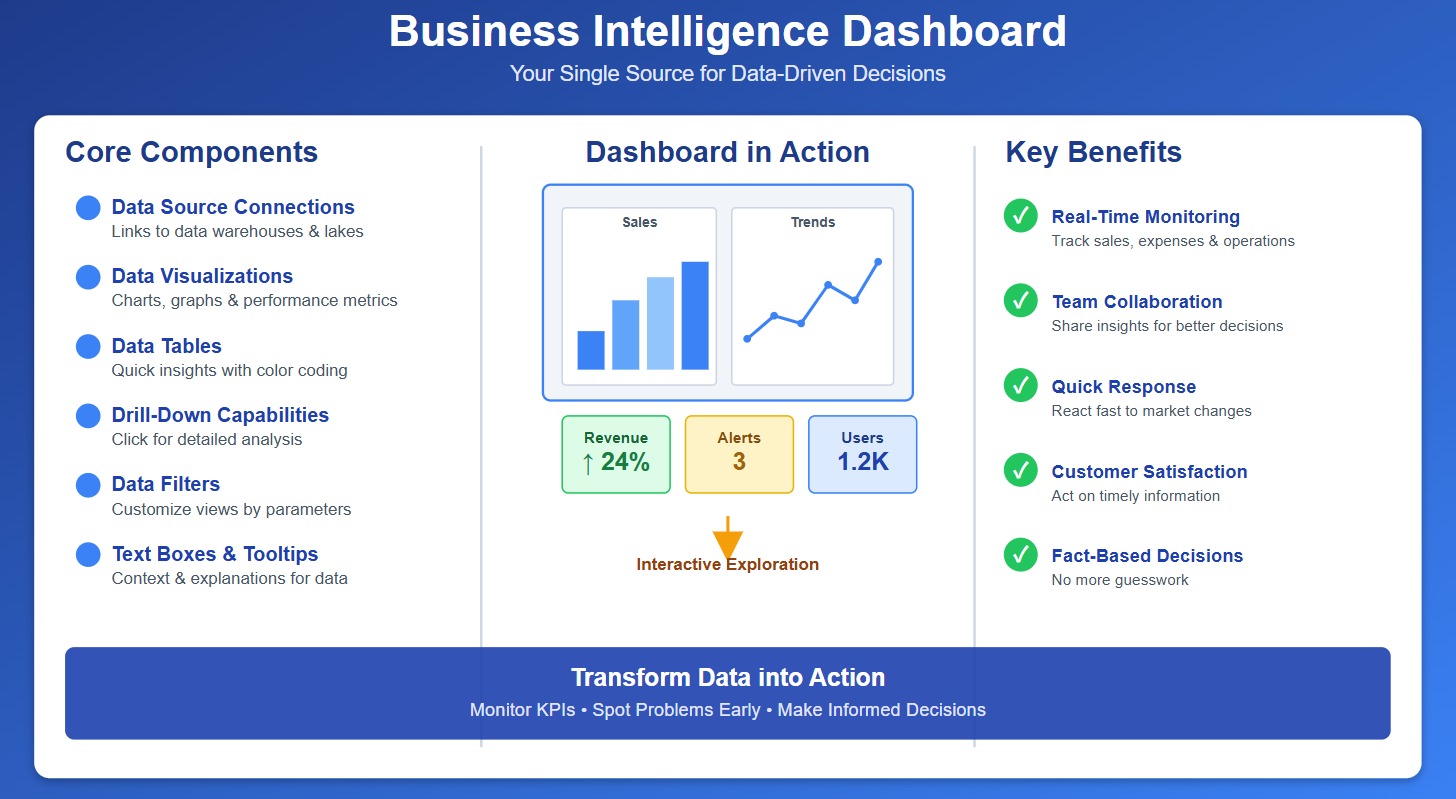
You interact with these components to explore your data. You use filters to focus on specific business questions. You drill down into details to find the root cause of issues. You check KPIs for a quick health check of your business. Dashboards also send alerts and notifications when something important changes, so you never miss a critical update.
A business intelligence dashboard plays a key role in your organization. You use it to:
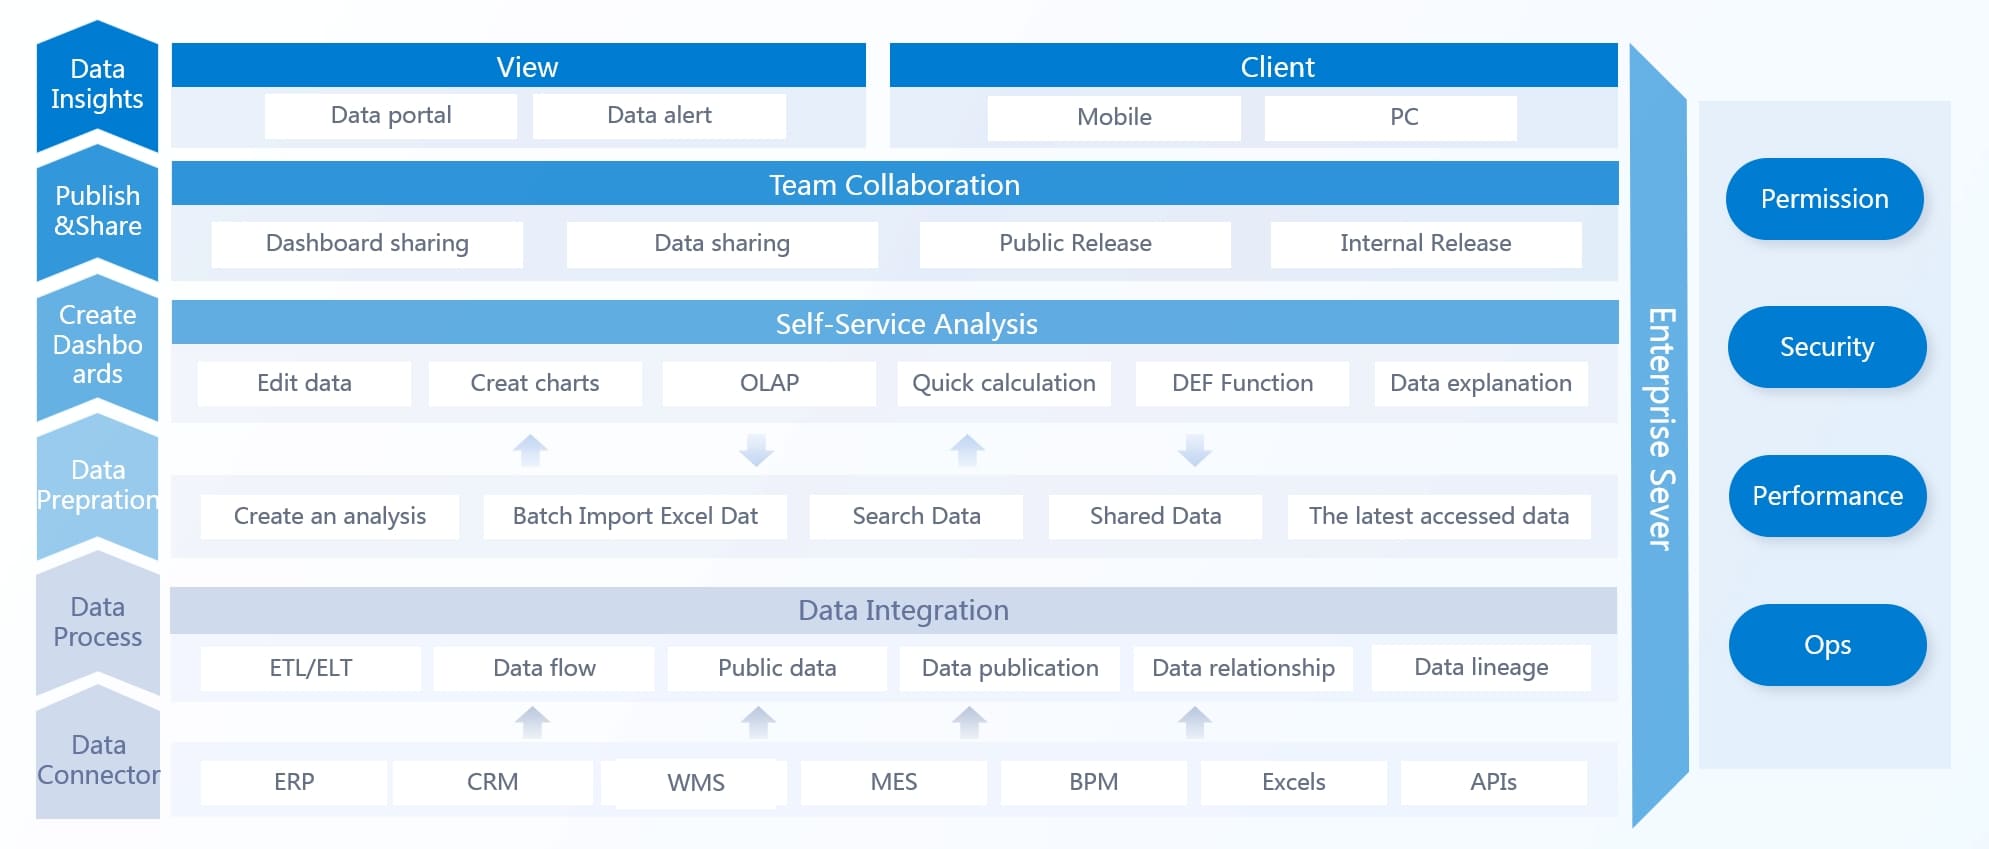
Dashboard business intelligence tools help you turn raw data into clear, actionable insights. You connect these tools to your data sources, such as databases, cloud platforms, or spreadsheets. The dashboard business intelligence system then pulls in the latest information and organizes it for analysis.
You follow a simple process to aggregate and visualize data:
You use interactive features like drill-downs and hover details to explore data deeper. You apply filters to customize your dashboard view. You check KPIs and receive alerts when something changes. The dashboard business intelligence approach makes it easy for you to switch perspectives and analyze data at any level of detail.
FineBI stands out as a modern business intelligence dashboard solution. You benefit from its user-friendly design, which lets you build dashboards with drag-and-drop simplicity. You connect to over 60 data sources, including big data platforms and cloud warehouses. FineBI processes data in real time, so you always see the latest numbers. You do not need technical skills to use FineBI, making it accessible for everyone in your organization.

The table below compares FineBI with other leading dashboard business intelligence tools:
| Feature | FineBI | Other BI Tools |
|---|---|---|
| User Autonomy | Yes | Varies |
| Integration with Data Sources | Yes | Yes |
| Real-time Data Processing | Yes | Varies |
| Technical Knowledge Required | Low | Medium to High |
| Pre-built Connectors | Yes | Varies |
You use FineBI to create smart reports, visual dashboards, and decision-making platforms. You access dashboards on mobile devices, so you stay informed wherever you go. You collect data, deploy dashboards, and integrate them with your business systems easily.
A business intelligence dashboard gives you the power to make better decisions, improve efficiency, and drive growth. You see your data clearly, act faster, and stay ahead in a competitive market.

FineBI gives you a complete set of tools to build, explore, and share your bi dashboard. You can connect to many data sources, create interactive data visualizations, and keep your information secure. These key features of bi dashboards help you turn raw data into clear insights for your team.
You start by connecting your dashboard to the data you need. FineBI lets you link to many types of sources, so you never feel limited. You can pull in data from:
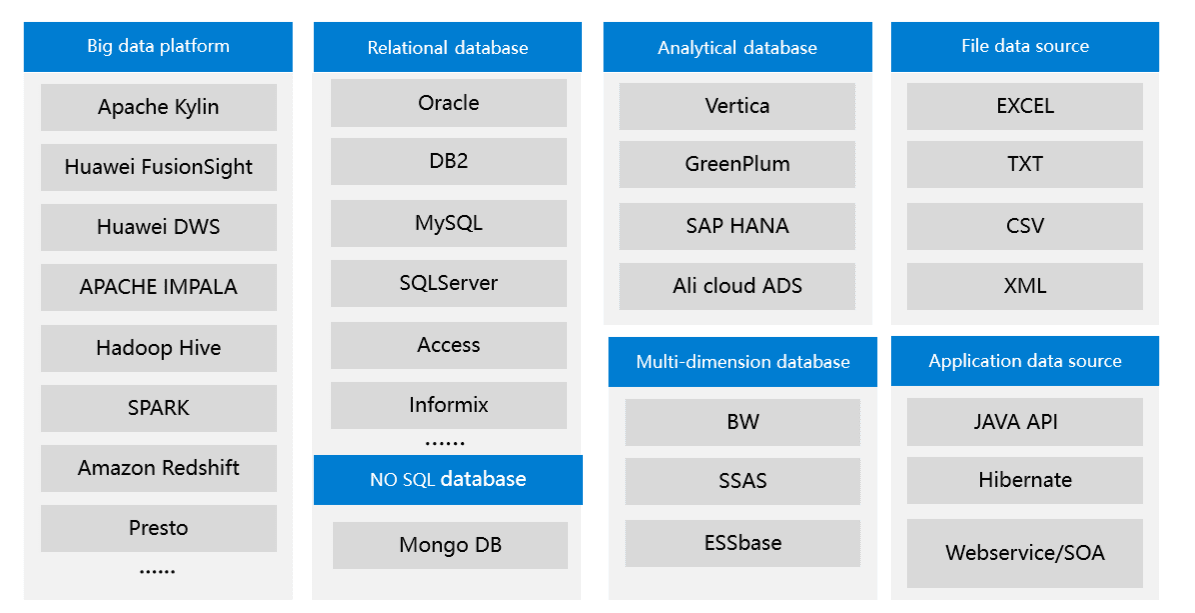
You do not need to worry about where your data lives. FineBI brings everything together in one place. This makes your bi dashboard a single source of truth for your business.
You want your dashboard to show accurate and up-to-date information. FineBI uses smart data processing to make this happen. You can:

The caching mechanism can dramatically enhance dashboard performance by storing frequently accessed data for fast retrieval, thus reducing the need to access slower storage layers.
Query performance matters for your bi dashboard. If your dashboard is slow, you might miss important changes. FineBI helps you keep your dashboard responsive and reliable, so you always see the latest numbers.
You can turn your data into powerful data visualizations with FineBI. The platform gives you many ways to display your information. You can add:
You build your dashboard by dragging data fields to the analysis area. You then configure chart properties and styles to match your needs. This process makes it easy for anyone to create a bi dashboard, even without technical skills.
You can use data visualizations to spot trends, compare results, and track KPIs. FineBI lets you interact with your dashboard in real time. You can:
You do not need to stay at your desk to use your bi dashboard. FineBI supports mobile access on iOS and Android devices. You can customize the mobile layout, so your dashboard looks great on any screen. This flexibility means you always have your data visualizations with you, wherever you go.
You want your business intelligence dashboard software to keep your data safe. FineBI gives you enterprise-grade security features. You control who can see and use each dashboard. The table below shows how FineBI protects your information:
| Security Feature | Description |
|---|---|
| Enterprise-Level Permission Management | FineBI's permission management system allows for role-based allocation of permissions to users, ensuring that only authorized individuals or departments can access specific dashboards and data connections. |
| Data Masking | This feature helps protect sensitive information by obscuring data in dashboards, ensuring that users only see data they are authorized to view. |
| Robust Security Settings for Mobile | FineBI provides enhanced security configurations for mobile applications, ensuring that data accessed via mobile devices is protected against unauthorized access. |

You can set permissions at many levels. The table below explains how you manage access in your bi dashboard:
| Permission Scope | Object | Permission |
|---|---|---|
| Data connection | Usage | Users can fetch data from the corresponding table via the data connection when adding DB/SQL tables. |
| Folder/Business package | Usage | Users can use data from this business package to create dashboards and self-service datasets. |
| Row-level permission | Usage | Users can configure data tables to only display certain rows of specific objects. |
| Column-level permission | Usage | Users can configure data tables to only display certain columns to specific objects. |
You can also work together with your team inside FineBI. You share dashboards, collaborate on data visualizations, and assign roles to control who can edit or view each dashboard. This teamwork makes your business intelligence dashboard software a central hub for your organization.

FineBI brings together data integration, fast processing, interactive data visualizations, and strong security. You get a bi dashboard that is easy to use, powerful, and safe. These features help you make better decisions and drive your business forward.
You gain a major advantage when you use business intelligence dashboards. You see real-time insights that help you make better decisions. Dashboards show you clear visualizations of complex data, so you do not have to guess what is happening in your business. You can monitor operations and spot problems as soon as they appear. For example, in manufacturing, you track production metrics and receive alerts about slowdowns. In sales, you identify top-performing products and regions quickly. This approach supports data-driven decision making and helps you respond to changes with confidence.
FineBI helps organizations like BOE Technology Group achieve actionable insights. BOE used FineBI to unify data, standardize metrics, and build KPI dashboards. As a result, BOE reduced inventory costs by 5% and increased operational efficiency by 50%. You can measure the impact of real-time insights by tracking how fast your team answers critical questions and how often you make data-driven decisions.

Business intelligence dashboards boost your efficiency and productivity. You automate data collection and reporting, saving time and reducing errors. You track processes, man-hours, and resource utilization, which improves productivity and on-time delivery. The benefits of bi dashboards include cost reduction and growth. In fact, 82% of organizations with mature analytics systems report positive year-over-year growth.
| Evidence | Description |
|---|---|
| Real-time tracking | You improve productivity and delivery by monitoring processes and resources. |
| Cost reduction | You lower overhead costs and increase order-to-cash ratios. |
| Growth statistics | Most organizations with strong analytics see business growth. |
You communicate more effectively with your team and respond quickly to changes. You use automation and insights to reallocate resources and focus on high-value tasks.
You need to trust your data and meet compliance requirements. Business intelligence dashboards support data governance by enforcing policies that keep your data accurate and secure. You avoid errors that could lead to compliance issues. FineBI offers features like logging services and traceability, which record every user operation and create audit trails. These tools help you meet industry regulations and protect sensitive information.
With centralized data and self-service analytics, you maintain control over your information and support a data-driven decision making culture. You use dashboards to drive better decision-making, improve efficiency, and stay compliant.
You often hear about bi dashboards and traditional BI reports, but they serve different purposes. Bi dashboards give you a dynamic, interactive view of your data. You can drill down, filter, and explore information in real time. Reports, on the other hand, provide static snapshots. You use them for detailed analysis and compliance. The table below highlights the main differences:
| Feature | Business Intelligence Dashboards | Traditional BI Reports |
|---|---|---|
| Interactivity | Highly interactive; drill down and filter data | Static; snapshot of data at a moment |
| Data Presentation | Dynamic visuals; focus on key metrics | Detailed documents; in-depth analysis |
| Usage Scenario | Fast decision-making | Historical review and compliance |
You use bi dashboards for quick insights and monitoring. You rely on reports when you need a deep dive into historical data. Dashboards let you see trends and act fast. Reports help you document findings and share them with stakeholders.
You choose bi dashboards when you want immediate access to performance data. Dashboards work best for executives who need to monitor KPIs and respond quickly. You use them for real-time updates and to answer specific business questions. A successful bi dashboard gives you clarity and helps you make decisions on the spot.
You turn to reports when you need comprehensive analysis. Reports are ideal for analysts who study historical trends and prepare detailed documents. You use them for compliance, audits, and sharing polished results.
FineBI supports both bi dashboards and reports. You create custom dashboards with drag-and-drop tools. You generate tailored reports without waiting for IT. FineBI integrates data from multiple sources, so you always have the right information. You collaborate across departments and visualize data in over 50 chart types. You use bi dashboards for sales analysis, market operations, and HR management. You rely on reports for deeper exploration and documentation.
Tip: Use bi dashboards for high-level overviews and fast decisions. Use reports for thorough analysis and record-keeping.
A successful bi dashboard gives you a broad perspective. Reports provide depth and detail. You need both to manage your business effectively.

You can use FineBI dashboards in many industries to solve real business problems. The table below shows how different sectors benefit from these tools:
| Industry | Application Description |
|---|---|
| Manufacturing | Visualize operational efficiency and streamline manufacturing processes. |
| Healthcare | Visualize clinical and healthcare data. Unify patient data securely. |
| Finance | Predict future trends and identify patterns for strategic decisions. |
| Retail | Provide real-time insights into product, eCommerce, and store performance. |
In healthcare, you monitor patient data and staff productivity. You spot trends that help you improve care. In finance, you track stock prices and company performance. You make smarter decisions by seeing patterns in your data. Across all industries, you use dashboards to analyze performance, track key metrics, and access critical information quickly.
When designing effective bi dashboards, you should focus on clarity and usability. Follow these best practices:
Providing context helps users interpret data. For example, showing on-time delivery rates means more when you compare them to past months or targets.
You can promote dashboards by announcing them through email, offering training, and encouraging user feedback. Make dashboards part of daily routines to boost engagement.
You may face challenges when implementing a business analytics dashboard. Watch out for these common mistakes:
To avoid these pitfalls, involve end users early, simplify your design, and use clear fonts and graphics. Remove unnecessary elements to make dashboards easy to understand. Strong leadership and regular feedback help your dashboards succeed.
A business dashboard gives you a clear view of your organization’s key performance indicators. You track kpis in real time and use data dashboards to monitor progress. Business dashboards help you improve decision-making by showing you the latest numbers. The table below highlights the value you gain:
| Benefit | Description |
|---|---|
| Improved visibility | See kpis and key performance indicators for better decision-making. |
| Increased efficiency | Save time by consolidating data from many sources. |
| Better decision-making | Use up-to-date kpis to guide your next steps. |
| Enhanced communication | Share business dashboards to keep everyone informed. |
FineBI empowers you to build interactive dashboards, visualize kpis, and analyze key performance indicators as they happen. You make smarter decisions, respond faster, and drive growth. Try FineBI or explore customer stories to see how data dashboards can transform your decision-making.
What is a Call Center Metrics Dashboard and How Does It Work
What is An Interactive Dashboard and How Does It Work
What is a Reporting Dashboard and How Does it Work

The Author
Lewis
Senior Data Analyst at FanRuan
Related Articles

Payment Analytics Dashboard: 12 KPIs Every Operations Leader Should Track to Cut Revenue Leakage
Losing revenue to declines? Discover 12 essential KPIs to track in your payment analytics dashboard to stop leakage and manage disputes.
Lewis Chou
May 05, 2026

SOC Dashboard Explained: 12 Essential KPIs, Views, and Workflows Security Teams Use
Learn about SOC dashboards, the 12 essential KPIs for security teams, and how they centralize alerts and workflows for faster threat detection and response.
Lewis Chou
May 05, 2026

EMR Dashboard Guide: 12 Metrics to Track for Faster Clinical and Operational Decisions
Learn the 12 essential EMR dashboard metrics to track for faster clinical and operational decisions, improving patient flow and revenue cycle management.
Lewis Chou
May 05, 2026


