You use oracle reporting tools to transform raw data into actionable insights. These tools include interactive grids for transactional extracts, interactive reports for operational dashboards, and classic reports for financial statements. Many organizations rely on fixed-format reports for board meetings and use BI Publisher for local statutory reports. Smart View and Account Inspector help with ad-hoc analysis. Business intelligence platforms like Oracle and FanRuan’s FineReport give you a strategic edge by speeding up decisions, improving efficiency, and deepening customer understanding.
Organizations using BI tools are five times more likely to make faster decisions, as shown below:
| Metric | Impact of BI Tools |
|---|---|
| Decision Speed | 5x faster decisions |
| Operational Efficiency | Increased efficiency and cost savings |
| Customer Understanding | Enhanced satisfaction and loyalty |
Oracle reporting tools overview
Key types
You can choose from several oracle reporting tools to meet your business needs. Oracle offers a wide range of solutions for creating, analyzing, and sharing reports. The table below shows some of the main categories and their descriptions:
| Reporting Tool | Description |
|---|---|
| Oracle XML Publisher | Lets you create formatting templates and publish reports in many formats. |
| Desktop Integrators | Helps you create and summarize data in spreadsheets. |
| RXi Reports | Allows you to design report content and layout for specific requirements. |
| SQL Extracts | Enables you to run SQL extracts for more database information. |
| Oracle Discoverer | Provides business intelligence for data analysis without deep database knowledge. |
| Oracle Portal | Creates a web interface for managing information and accessing dynamic data. |
You also use tools like oracle analytics cloud, oracle transactional business intelligence, and oracle fusion data intelligence for advanced reporting. Oracle hcm cloud supports reporting for human resources and payroll. Oracle fusion financial reporting studio helps you design financial statements and regulatory reports.
Main functions
Oracle reporting tools give you many ways to work with reports. You can:
- Query and explore data as an end user.
- Create multidimensional reports and analyze trends.
- Produce standard reports for regular business needs.
- Build custom reports for unique requirements.
- Use OLAP cubes for deeper analysis.
Oracle analytics cloud and oracle transactional business intelligence let you visualize data and uncover insights. Oracle hcm cloud makes it easy to track employee data and payroll. Oracle fusion tools help you manage financial and operational reports across departments.
Why reporting tools matter
Reporting tools play a key role in business intelligence. You use them to turn raw data into useful reports that guide your decisions. Oracle reporting tools help you spot market trends, forecast opportunities, and reduce risks. For example, companies like Coca-Cola use BI tools to adjust marketing strategies based on sales data. Amazon relies on predictive analytics to manage inventory and meet customer demand. Barclays uses reporting tools to monitor cash flow and prevent financial risks.
Oracle hcm cloud and oracle fusion reporting tools support your business by making data accessible and actionable. Oracle analytics cloud and oracle transactional business intelligence help you respond quickly to changes in the market. You gain a strategic advantage when you use these tools to improve efficiency and make informed decisions.
Tip: Comparing oracle reporting tools with other solutions, such as FanRuan's FineReport, helps you find the best fit for your organization. You will see how each tool supports different business needs in the next sections.
Oracle BI Publisher
Features
You can use oracle bi publisher to create reports with a flexible, template-based approach. This tool lets you design documents that match your business needs. You select from many output formats, such as PDF, Excel, and HTML. You also choose delivery channels for your reports, making it easy to share information with your team.
Oracle bi publisher stands out because you can connect to different data sources. You use REST APIs to integrate with other applications, which helps you view data and reports in one place. Administrators manage custom fonts and control report templates, so your reports look professional and consistent. Security is a priority. Oracle bi publisher uses strong encryption to protect your data.
Automation is another key feature. You schedule reports to run at specific times, which saves you effort and keeps your information up to date. The table below shows some important features:
| Feature | Description |
|---|---|
| Ease of Use | You select delivery channels and output formats for multiple reports. |
| Integration | REST APIs help you connect with other applications for data viewing. |
| Customization | Administrators manage fonts and templates for better control. |
| Security | Encryption keeps your data safe. |
| Automation | You schedule reports to run automatically at set intervals. |
Tip: Oracle bi publisher helps you automate routine reporting tasks, so you spend less time on manual work.
Use cases
You use oracle bi publisher in many enterprise scenarios. For example, you produce customer-facing documents like invoices and statements. You also create personalized reports that give you better visibility into your operations. Power users rely on ad hoc reporting to answer specific business questions quickly.
The table below highlights common use cases:
| Use Case | Description |
|---|---|
| Embedded BI Publisher | You generate invoices and statements for customers. |
| One View Reporting | You create personalized reports for better operational insights. |
| Ad Hoc Reporting | You build complex queries for unique business needs. |
FineReport offers similar capabilities. You design pixel-perfect documents, automate report generation, and connect to multiple data sources. You also use drag-and-drop tools to build custom dashboards and reports, making it easy to adapt to changing business requirements.
Advantages
Oracle bi publisher gives you several advantages over other reporting tools. You create ad hoc analysis reports with a simple drag-and-drop interface. You organize your reports better and set specific user permissions for detailed transactions. You customize reports easily and export them in formats like Excel.
- You use drag-and-drop features for quick ad hoc analysis.
- You improve organization and user authorization for secure transactions.
- You customize reports and export them in many formats.
FineReport matches these strengths. You use an intuitive designer, automate report scheduling, and integrate with various data sources. You also benefit from advanced visualization options and mobile access, which help you make decisions faster.

Note: Both oracle bi publisher and FineReport support enterprise reporting, document generation, and automation. You choose the tool that fits your workflow and business needs.
OTBI and Smart View
OTBI features
You use Oracle Transactional Business Intelligence (OTBI) to access real-time data from your Oracle Fusion Applications. OTBI gives you the power to create reports and dashboards without waiting for overnight data refreshes. You see up-to-date information as soon as transactions happen. This tool supports ad-hoc analysis, letting you build custom reports on the fly.
OTBI stands out because you can extend flexfields automatically and integrate tightly with Oracle Fusion. You get real-time reporting, but you need to use selective filters for large data sets to keep performance high. OTBI works best for operational reporting, giving you instant insights into your business activities.
Here is a table that highlights OTBI’s main features:
| Feature | OTBI | OTBI-E |
|---|---|---|
| Reporting Type | Real-time reporting | Real-time reporting |
| Integration | Oracle Fusion Applications | Multi-source system analytics |
| Customization | Automatic extension of flexfields | Automatic extension of flexfields |
| Historical Data Handling | Limited capability | Better suited for historical data |
| Performance on Large Data Sets | Requires effective selective filters | N/A |
| Pre-built Dashboards | N/A | Available without development/configuration |
| Security Integration | Tight integration with Oracle Fusion | N/A |
You rely on OTBI for real-time data and ad-hoc analysis, making it a strong choice for operational reporting.
Smart View features
Smart View lets you work with real-time data directly in Microsoft Office applications. You connect to Oracle ERP, EPM, and BI systems and pull data into Excel, Word, PowerPoint, or Outlook. You view, import, and manipulate data without leaving your favorite Office tools. This integration helps you share and distribute reports quickly across your team.
Smart View provides a common interface for EPM and BI data. You manage and analyze information in Excel, create presentations in PowerPoint, and write reports in Word—all using real-time data. You improve efficiency by accessing and updating data in one place.
Here are some benefits you get from Smart View:
- Direct access to ERP, EPM, and BI data within Office applications.
- Enhanced data manipulation in Excel, Word, and PowerPoint.
- Improved efficiency in sharing and distributing data.
| Source | Benefit |
|---|---|
| Oracle Smart View for Office | Integrates ERP, EPM, and BI data into Office applications for seamless data management. |
| Working with Oracle Smart View for Office | Connects Oracle Cloud EPM with Office 365 for easy data access. |
| The Best of Both Worlds | Combines EPM and BI content with Office tools for efficient reporting. |
Smart View helps you perform ad-hoc analysis and manage real-time data in a familiar environment.
Use cases
You use OTBI and Smart View for many business scenarios. OTBI gives you real-time insights into operations, financials, sales, human resources, and supply chain management. You create ad-hoc reports to answer specific questions and make quick decisions. Smart View lets you manipulate and share data in Office applications, making collaboration easier.
Common use cases include:
- Real-time insights into business operations.
- Financial reporting for analysis and decision-making.
- Sales analysis to track performance and trends.
- Human resources metrics for workforce management.
- Supply chain management for process optimization.
- Ad-hoc reporting using Microsoft Office tools.
| Use Case | Description |
|---|---|
| Real-time Insights | Immediate visibility into business operations through transactional data. |
| Financial Reporting | Generation of financial reports for analysis and decision-making. |
| Sales Analysis | Detailed examination of sales performance and trends. |
| Human Resources Metrics | Insights into HR-related data for workforce management. |
| Supply Chain Management | Monitoring and optimizing supply chain processes. |
| Ad-hoc Reporting | Dynamic report creation and manipulation in Office tools. |
You benefit from OTBI’s real-time data and ad-hoc analysis for operational reporting. Smart View enhances your ability to work with data in Office applications, supporting ad-hoc reporting and collaboration.
Differences
When you compare OTBI and Smart View, you notice some important differences. Each tool serves a unique purpose in your reporting workflow. Understanding these differences helps you choose the right tool for your needs.
1. Core Functionality
- OTBI gives you real-time analytics directly from Oracle Fusion Applications. You create dashboards and reports that update instantly as new data comes in.
- Smart View lets you work with Oracle data inside Microsoft Office tools like Excel and Word. You pull live data into your spreadsheets and documents for quick analysis.
2. User Experience
- With OTBI, you use a web-based interface. You build reports and dashboards using drag-and-drop features. You do not need advanced technical skills.
- Smart View feels familiar if you use Microsoft Office often. You analyze and share data in Excel, PowerPoint, or Word. You use formulas and charts just like you do with regular Office files.
3. Integration and Data Sources
- OTBI connects tightly with Oracle Fusion Applications. You get real-time access to transactional data. You use it mostly for operational and ad hoc reporting within Oracle’s ecosystem.
- Smart View integrates with multiple Oracle products, including EPM and BI. You can combine data from different Oracle sources and work with it in one Office file.
4. Reporting Style
- OTBI focuses on dashboards and interactive reports. You track KPIs, trends, and business metrics in real time.
- Smart View supports flexible, ad hoc analysis. You create custom calculations, pivot tables, and charts in Excel. You prepare presentations and reports for meetings using live data.
5. Collaboration
- OTBI lets you share dashboards and reports through Oracle’s web platform. You control who can view or edit each report.
- Smart View makes it easy to share files through email or cloud storage. Your team can collaborate on the same Excel file and update data together.
Here’s a quick comparison table:
| Feature | OTBI | Smart View |
|---|---|---|
| Main Use | Real-time dashboards, operational reports | Ad hoc analysis in Office apps |
| Interface | Web-based | Microsoft Office (Excel, Word, PowerPoint) |
| Data Integration | Oracle Fusion Applications | Oracle EPM, BI, Fusion, and more |
| Collaboration | Oracle platform sharing | File sharing, Office collaboration |
| Custom Calculations | Limited | Extensive (Excel formulas, pivots) |
Tip: If you want a tool that combines real-time analytics, flexible integration, and advanced visualization, you should also look at FineReport. FineReport connects to many data sources, supports drag-and-drop report design, and offers mobile access. You get both operational dashboards and ad hoc analysis in one platform.
By understanding these differences, you can select the reporting tool that fits your workflow and business goals best.
Financial Reporting Studio
Features
You use Financial Reporting Studio to design, manage, and deliver financial reporting with precision. The interface gives you a clear structure for building reports. You see a repository that holds folders and reports, making it easy to organize your work. When you open a report, you find a summary section that shows the report name and description. The main workspace, called the design canvas, lets you arrange grids, text, images, and charts. You can drag and drop objects onto the canvas to create custom layouts. The properties panel displays the attributes for each report or object, so you can fine-tune every detail.
Here is a quick overview of the main sections in the interface:
| Section in Interface | Description |
|---|---|
| Repository | Contains folders, reports, and a Search toolbar. |
| Summary | Displays information about an opened report, including report name and description. |
| Report | Features an object browser, report objects, design canvas, and report object properties panel, including grids, text, images, and charts. |
| Design Canvas | Provides the layout for a report. |
| Properties | Shows attributes for a selected report or report object. |
You can use these features to create detailed financial reporting, including balance sheets, income statements, and cash flow reports.
Use cases
You rely on Financial Reporting Studio for both regulatory and management reporting. The tool supports financial reporting that meets strict compliance standards. You can automate data validation and enable real-time updates by using Inline XBRL (iXBRL). This technology helps you move from traditional document formats to a more structured model. You embed tags within HTML documents, making your reports machine-readable and easier to analyze. This approach improves the efficiency of your financial reporting process and helps stakeholders understand your financial statements quickly.
You also use Financial Reporting Studio for financial analysis. You drill down into data, explore trends, and identify key drivers behind your numbers. The tool makes it simple to update reports as new data comes in, so you always have the latest information for decision-making.
Advantages
Financial Reporting Studio gives you several advantages over other oracle tools. You can dynamically burst reports by cost center, and the system automatically includes new cost centers as they appear. You export reports to Excel, although drill-down features do not carry over. The tool supports auto-expansion with ranges, which helps you manage large sets of financial reporting data. Security is strong, with role-based access that ensures only authorized users can make changes. The strict report definitions reduce the risk of ambiguous errors, making your financial reporting more reliable.
Here is a comparison of key advantages:
| Feature/Advantage | Financial Reporting Studio (FRS) | Oracle Smart View |
|---|---|---|
| Report Bursting | Dynamic by cost center, auto-includes new cost centers | Manual tab creation |
| Export Capability | Export to Excel (drill-down lost) | N/A |
| Auto-Expansion | Supports with ranges | N/A |
| Security | Role-based, strong change control | N/A |
| Error Management | Less prone to ambiguous errors | More flexible, more errors |
When you compare Financial Reporting Studio with FineReport, you see both tools support robust financial reporting and financial analysis. FineReport offers real-time data entry, automatic aggregation, and intuitive visualization tools. You can integrate data from multiple sources and create interactive dashboards. This flexibility helps you meet complex financial reporting needs and supports better decision-making across your organization.
Fusion Data Intelligence
Features
Fusion Data Intelligence gives you powerful tools for advanced analytics and predictive insights. You can use machine learning to analyze both past and future performance. The system sends you alerts when it predicts changes, such as a rise in product demand. You get recommendations based on AI and machine learning, which help you spot trends and risks before they affect your business. Automated insights and anomaly detection keep your data accurate and complete. You can build data models that connect information from different sources, making it easier to see the big picture.
Fusion Data Intelligence also lets you create custom dashboards. You can track key performance indicators (KPIs) and adjust them as your business grows. The platform supports real-time data analysis, so you always have the latest information at your fingertips.
Use cases
You can use Fusion Data Intelligence for many business needs. Large enterprises often rely on it for cross-module reporting. This means you can combine data from sales, finance, human resources, and other areas into one report. The Business Intelligence Competency Center (BICC) acts as a central hub, bringing together data from different oracle modules. This setup helps you generate reports that show how your entire business is performing.
Here is a table that highlights some important features for cross-module reporting:
| Feature | Description |
|---|---|
| Strategic, multi-dimensional performance | Analyze performance across many areas for deeper insights. |
| Cross-subject and multi-source analytics | Combine data from different modules for a unified business view. |
| Historical trend evaluation | Compare past results with real-time data for better decisions. |
| Control over KPIs and metrics | Build and adapt KPIs as your business needs change. |
You can also automate report generation, which saves you time and reduces errors. The system supports scalable reports, so your reporting grows with your organization. Fusion Data Intelligence integrates with the analytics workspace, making it easy to manage all your reports in one place.
FineReport supports similar advanced analytics. You can connect to multiple data sources, create interactive dashboards, and use real-time data for analysis. FineReport also helps you visualize trends and monitor KPIs, giving you the tools you need for smart decision-making.

Advantages
Fusion Data Intelligence offers several advantages over traditional reporting tools. You get prebuilt analytics, so you do not have to start from scratch. The platform uses AI and machine learning to give you predictive recommendations, which improves your decision-making. Automated data unification brings together information from different applications, ending siloed reporting and streamlining your workflow.
Here is a table that summarizes the main advantages:
| Advantage | Description |
|---|---|
| Prebuilt Analytics | Ready-to-use dashboards and reports save you time. |
| AI & Machine Learning Insights | Predictive analysis helps you make better decisions. |
| Automated Data Unification | Combines data from all sources for a complete view. |
| Scalable & Extensible | Integrates third-party data and supports custom KPIs as you grow. |
| Self-Service Data Exploration | Lets you create and visualize reports without needing IT support. |
Fusion Data Intelligence empowers you to explore data on your own. You can create new reports and visualizations quickly, which helps you respond faster to business changes. The platform supports integration with other oracle applications, making it a flexible choice for growing organizations.
Reporting tools comparison

Oracle vs. FineReport
You face many choices when you select reporting tools for your business. Oracle reporting tools and FanRuan FineReport both help you turn data into useful reports. Each platform offers unique strengths. Oracle reporting tools give you advanced analytics, strong security, and deep integration with enterprise systems. You use them to create reports for finance, operations, and human resources. These tools support complex data models and large organizations.
FineReport stands out for its flexibility and ease of use. You design reports with a drag-and-drop interface. You connect to many data sources, including databases, files, and cloud services. You build reports quickly and share them with your team. FineReport supports real-time data entry, automatic report generation, and mobile access. You use it to create dashboards, financial statements, and operational reports.

Both platforms let you automate report scheduling and distribution. You choose the format that fits your needs, such as Excel, PDF, or HTML. You manage user permissions to keep your data safe. FineReport also offers advanced visualization, including 3D dashboards and interactive charts. You access reports on any device, which helps you make decisions faster.
Key differences
You see important differences when you compare Oracle reporting tools and FineReport. Oracle reporting tools focus on enterprise-level analytics and integration. You use them for social media analytics, competitive intelligence, and scaling best practices. These tools include AI-powered analytics and robust data import and export features. You work with large data sets and complex business processes.
FineReport focuses on streamlining communication and maximizing productivity. You create custom reports with ease. You import and export data without complicated steps. You use funnel analysis and manage communication across departments. FineReport suits users who want straightforward solutions and quick results.
Here is a table that highlights key differences in analytics capabilities:
| Feature | Oracle Analytics Cloud | FanRuan FineReport |
|---|---|---|
| Key Activities | Social media analytics, competitive intelligence | Funnel analysis, communication management |
| Advanced Features | AI-powered analytics, robust data import/export, privacy | Custom reports, ease of data import/export |
| Target Users | Companies seeking advanced analytics and data handling | Users preferring straightforward solutions |
| Focus Area | Scaling best practices, improving efficiency | Streamlining communication, maximizing productivity |
You notice that Oracle reporting tools target companies with complex analytics needs. FineReport appeals to users who want flexible reporting tools and fast deployment.
Choosing the right tool
You need to match your reporting tools to your business goals. If you work in a large organization with complex data and strict security needs, Oracle reporting tools may fit best. You use them to manage reports for finance, HR, and operations. You benefit from AI-powered analytics and deep integration with enterprise systems.
If you want a tool that is easy to use and quick to deploy, FineReport offers many advantages. You create reports with a simple drag-and-drop designer. You connect to multiple data sources and automate report generation. You use FineReport to build dashboards, financial statements, and operational reports. You access reports on your phone, tablet, or computer.
Consider these factors when you choose your reporting tools:
- Business Needs: Do you need advanced analytics or fast report creation?
- Data Complexity: Are your reports simple or do they require complex data models?
- User Roles: Will IT teams manage reports or will business users create their own?
- Integration: Do you need to connect with many systems or just a few?
- Mobility: Will you view reports on mobile devices?
Tip: Try both platforms with sample reports. You will see which reporting tools match your workflow and help you reach your goals.
You make better decisions when you choose reporting tools that fit your needs. Oracle reporting tools and FineReport both help you create, share, and analyze reports. You select the platform that supports your business growth and makes your data work for you.
FanRuan solutions
FineReport in manufacturing
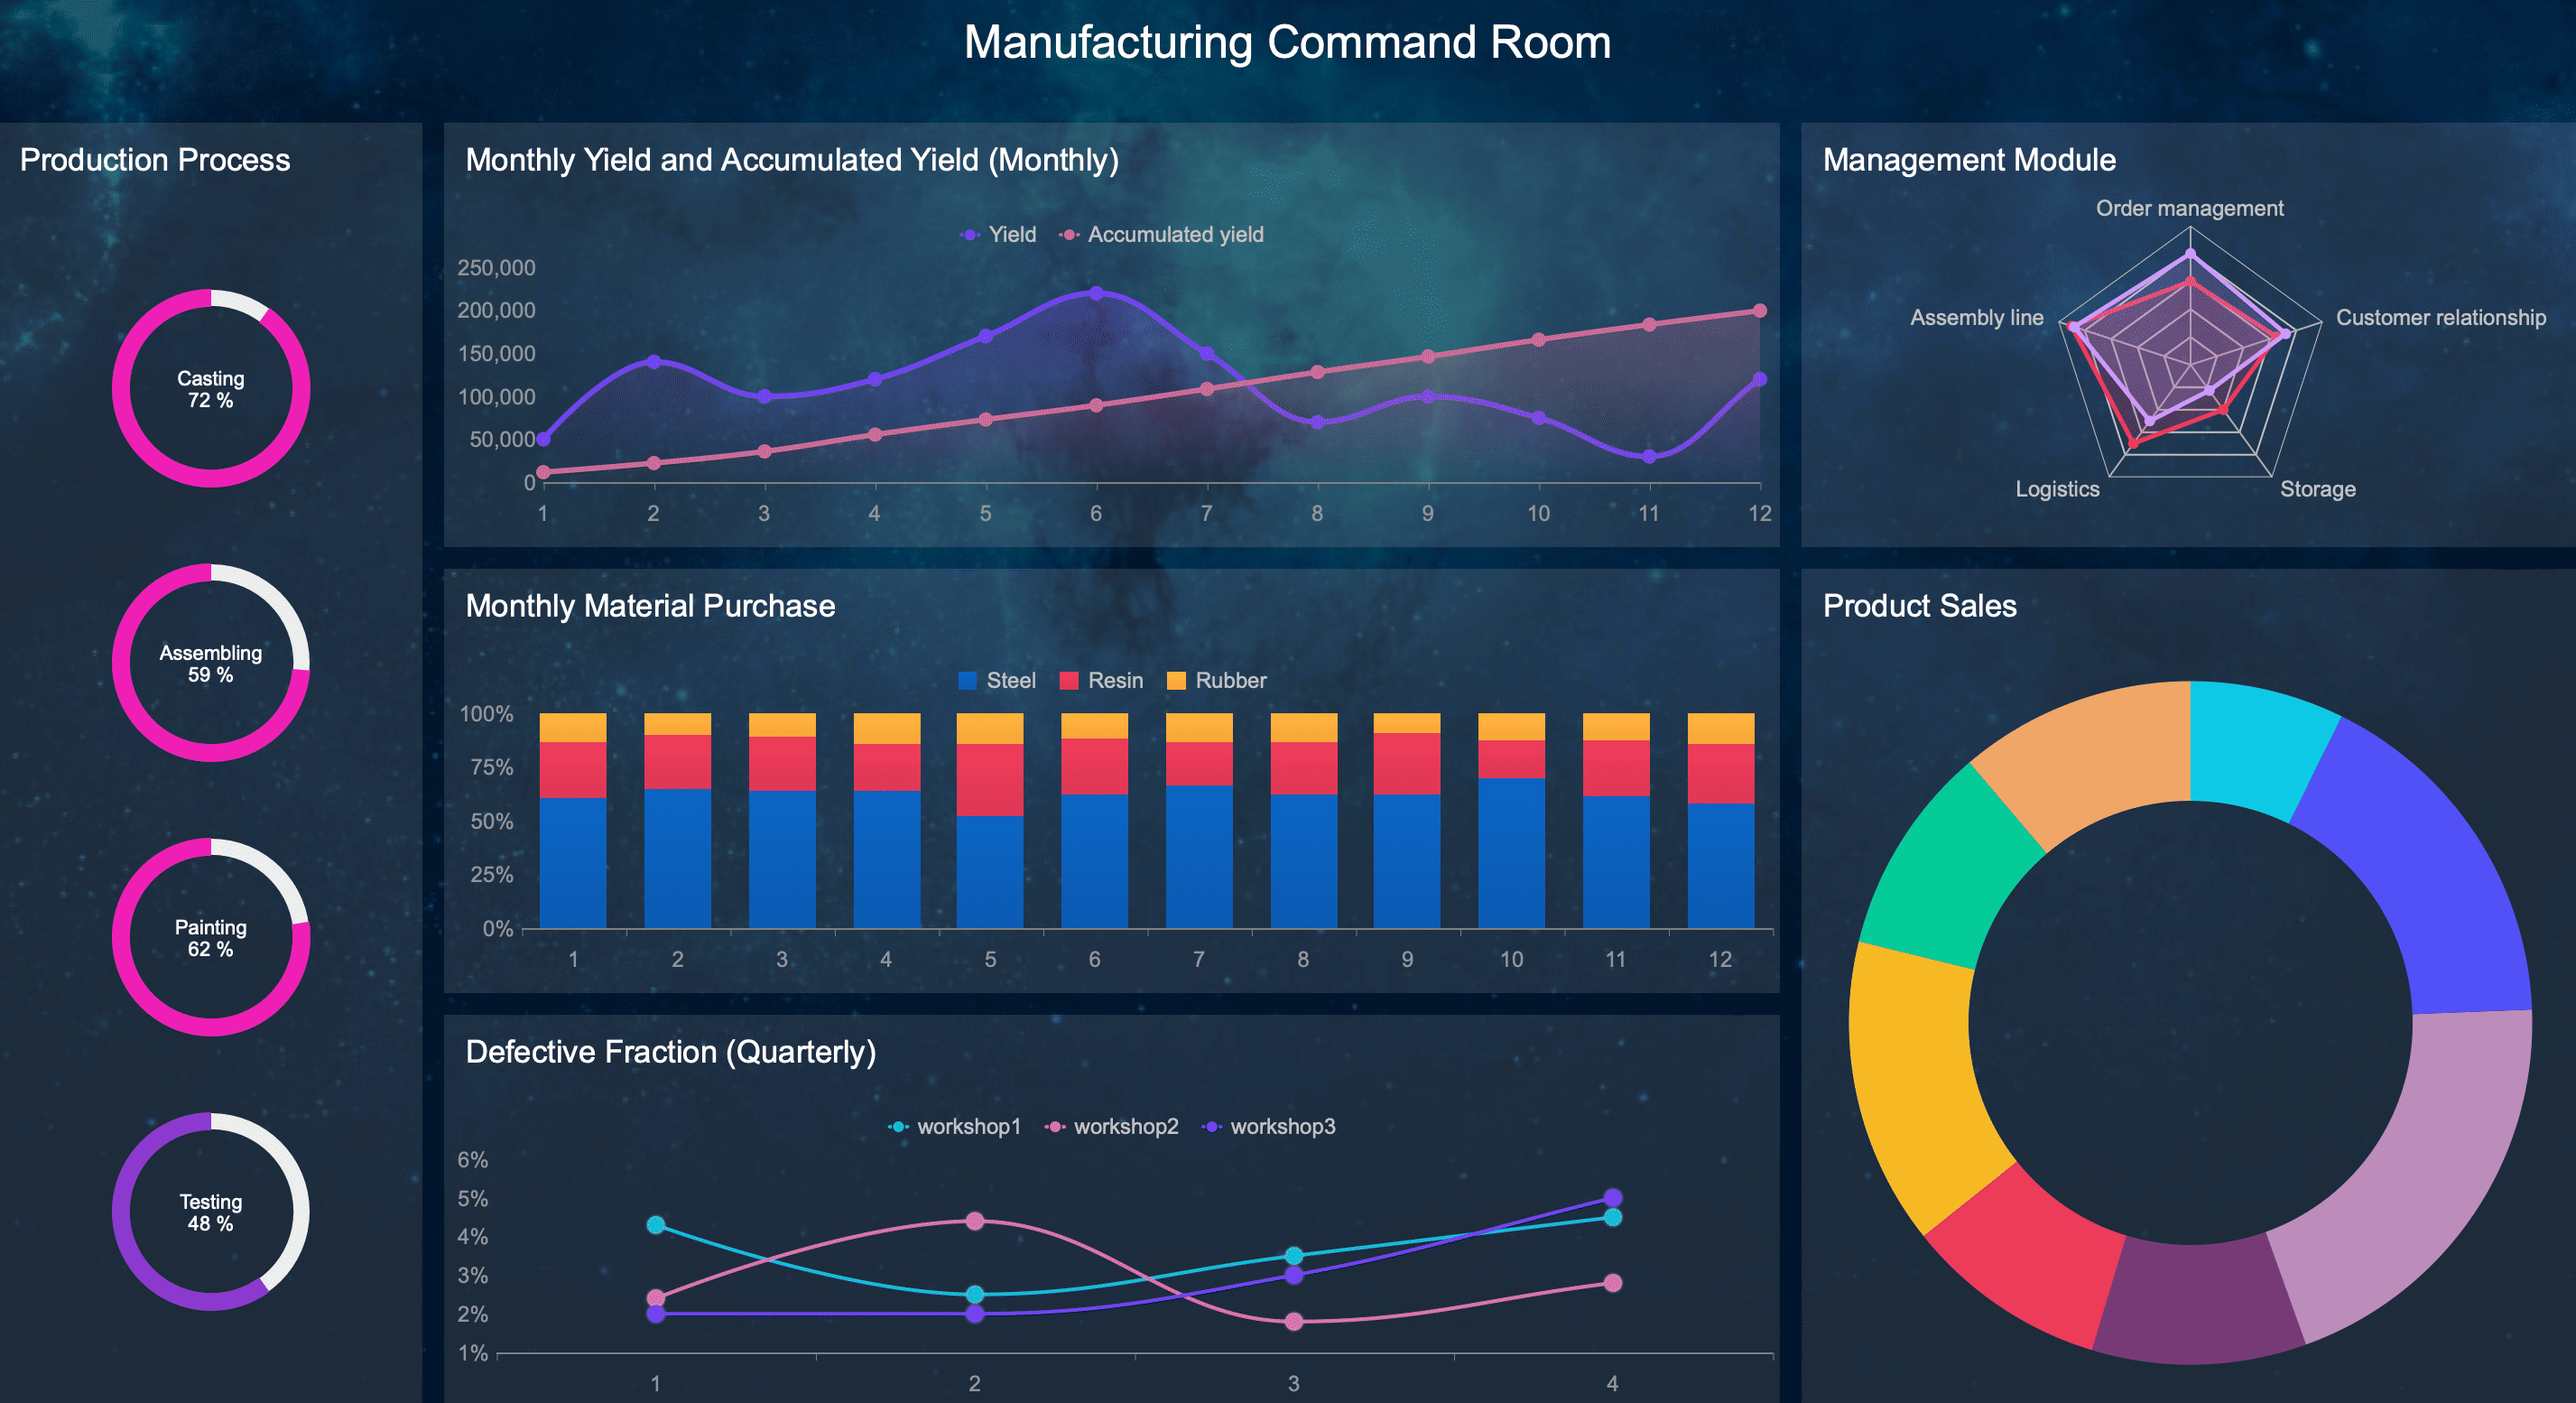
You face many challenges in manufacturing, such as high data consumption, rising costs, and frequent personnel shortages. FineReport helps you solve these problems with lean production and quality control solutions. You can integrate data from different systems and visualize it in real time. This gives you a clear view of your production schedules, quality metrics, and cost structures.
FineReport supports you with a production control tower. You monitor equipment status and receive alerts when issues arise. You track quality improvement and cost control using dashboards. You also encourage employee engagement and continuous improvement. FineReport’s flexibility lets you customize modules for production, quality, cost, equipment, and management.
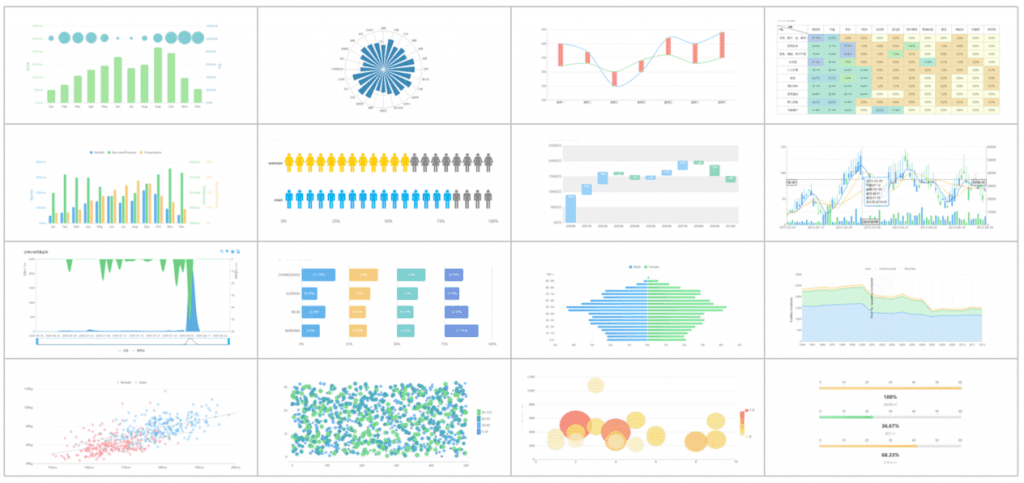
You benefit from multi-indicator dashboards. You see product qualification rates, defect rates, and scrap rates at a glance. You analyze trends and identify root causes of defects. You use bar charts, line charts, and pie charts to compare performance across production stages. You can drill down into data for deeper analysis.
Here is a table that shows how FineReport supports integration and visualization in manufacturing:
| Feature | Description |
|---|---|
| Heterogeneous Data Integration | You connect various data sources, which is essential for large enterprises. |
| Variety of Visual Elements | You use forms, graphics, and videos to present data clearly. |
| Dynamic Interactions | You update data in real time and drill into details for in-depth analysis. |
You also use funnel analysis to gain better insights. Communication management tools help you streamline processes. Sales document management improves your operational efficiency. FineReport adapts to your needs and helps you make smarter decisions.
FineReport in finance
You often struggle with fragmented financial data and manual reporting. FineReport makes financial management easier for you. You collect data in real time using online templates. You automate report generation and aggregate data from multiple sources. This reduces errors and saves you time.
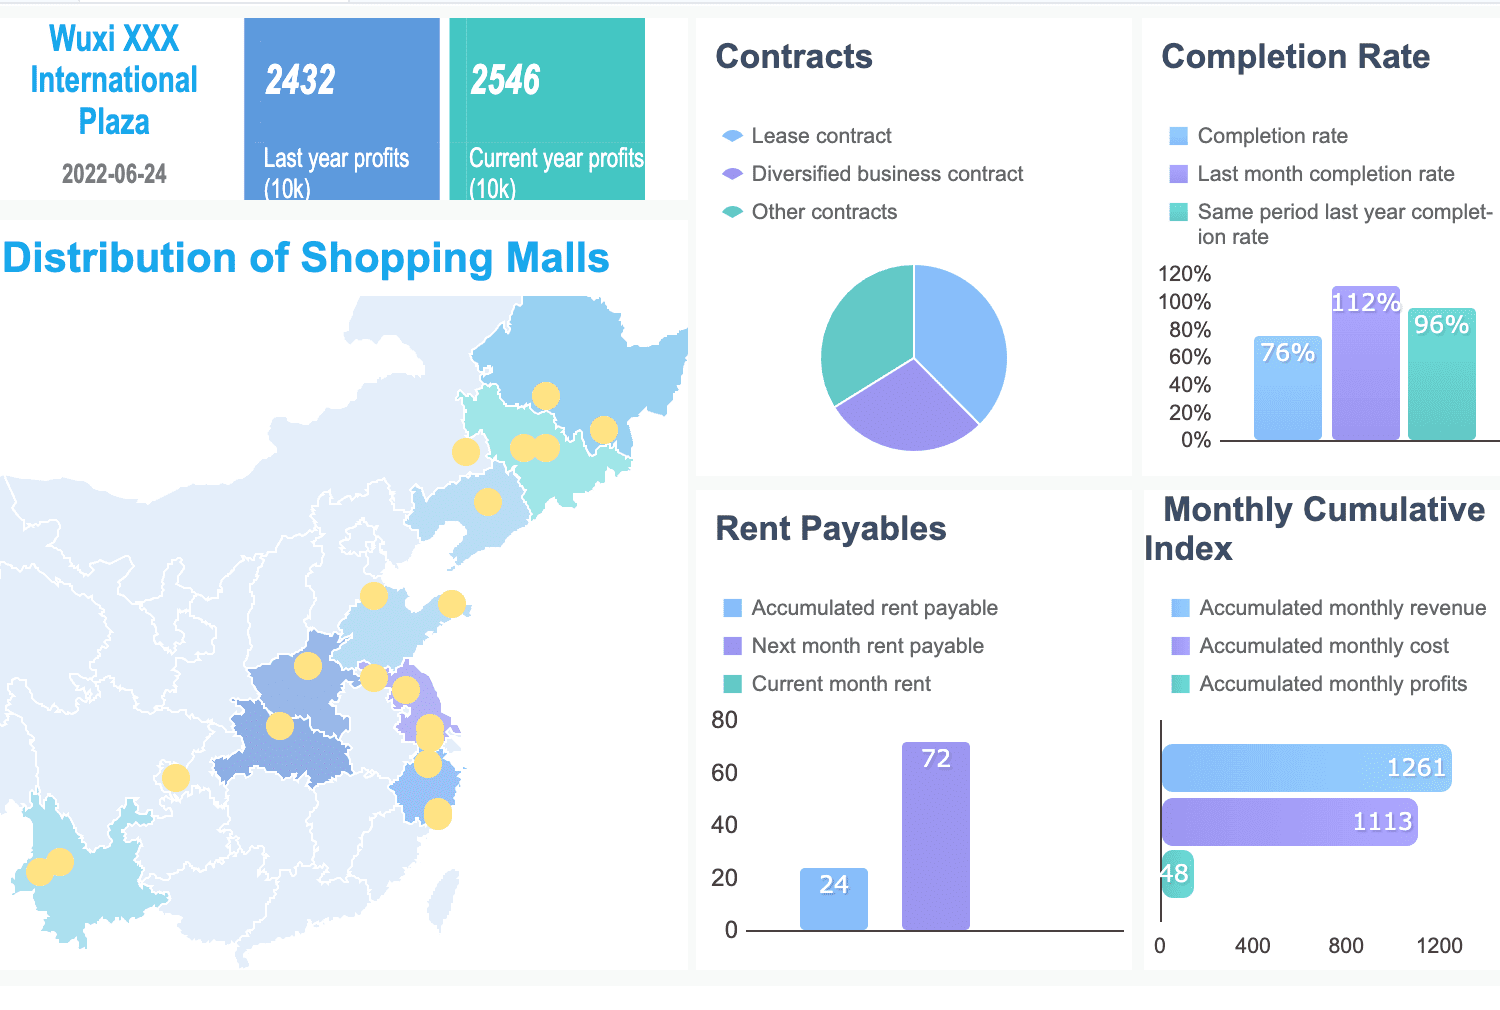
FineReport transforms complex financial indicators into simple visualizations. You use dashboards to track budgets, expenses, and revenue. You drill down into financial data to uncover issues and trends. You link different financial reports for deeper analysis.
You create balance sheets, income statements, and cash flow reports with ease. FineReport supports multi-dimensional analysis. You can customize dashboards and charts to fit your needs. You also set up role-based access to keep your data secure.
You benefit from these features in finance:
- Real-time data entry and automatic aggregation.
- Intuitive visualization tools for financial indicators.
- Multi-dimensional analysis and cross-referencing.
- Automated reporting and scheduled distribution.
FineReport helps you communicate financial results across departments. You improve collaboration and make informed decisions faster. You gain a complete view of your financial performance and respond quickly to changes in the market.
Tip: FineReport’s flexibility and integration capabilities make it a strong choice for both manufacturing and finance. You use it to visualize data, streamline operations, and support strategic growth.
You gain powerful insights with Oracle reporting tools and FineReport. Both platforms offer strong analytics, flexible integration, and user-friendly design. To choose the best solution, review these criteria:
| Criteria | Description |
|---|---|
| Ease of Use | Select a tool that employees can navigate easily. |
| Customization | Look for options that match your business needs. |
| Integration | Ensure compatibility with your current systems. |
| Features | Check for analytics and visualization capabilities. |
| Pricing | Confirm the tool fits your budget. |
| Support and Training | Access resources for effective use. |
You can explore custom research or expert-led surveys for tailored solutions. Consulting services help you build business intelligence and collect meaningful data.
Click the banner below to try FineReport for free and empower your enterprise to transform data into productivity!

Continue Reading About Oracle Reporting Tools


FAQ

The Author
Lewis
Senior Data Analyst at FanRuan
Related Articles

Financial Reporting Valuation Explained: A Practical Guide to ASC 820, ASC 805, ASC 350, and ASC 718
$1 valuation is the process companies use to measure assets, liabilities, equity instruments, and reporting units for compliant $1. For CFOs, controllers, finance directors, and audit facing accounting teams, the challen
Yida Yin
Jun 25, 2026

Best Ad Reporting Tool in 2026: 8 Options Compared for Marketers and Analysts
$1 is an $1 and dashboard platform that helps teams unify ad data, build highly customized reports, and automate distribution at scale. 8 ad reporting tool options compared 1. DashThis One sentence overview: DashThis is
Yida YIn
Jun 25, 2026
Office 365 Reporting Tool Guide: Track Usage, Security, and License Waste in One Dashboard
An office 365 $1 should do more than generate static usage charts. For IT managers, operations leaders, and Microsoft 365 administrators, the real value is operational visibility: who is actually using the platform, wher
Yida Yin
Jun 25, 2026