You use reporting every day, whether you share updates at work or describe an event to a friend. In business, reporting meaning refers to presenting facts and data in a clear format. At home, you might explain what happened at school or write a summary for a class project. When you learn how to write a report, you improve your ability to communicate. Recent studies show that reporting helps people make decisions and understand important information.
Reporting bridges the gap between facts and actions.
When you know how to write a report, you make your ideas clear.
You choose the best way to share your message by learning how to write a report.
Good reporting skills help you avoid confusion.
Practicing how to write a report prepares you for both work and life.
Think about the last time you needed to explain something important. Did you use steps similar to how to write a report? Reflect on your own style and see how reporting helps you connect with others.
When you step into the world of business,reporting meaningtakes on a specific role. You use a report to present facts, figures, and analysis in a structured way. The structure of a report in business often follows a clear format. You start with an introduction, move to the main findings, and end with recommendations or conclusions. This approach helps you communicate complex information to managers, teams, or clients.
You might create different types of reports at work. Here are some common examples you may encounter:
Informational Reports
Analytical Reports
Research Reports
Progress Reports
Financial Reports
Internal Reports
External Reports
Sales Reports
Compliance Reports
Marketing Reports
Each report serves a unique purpose. For example, a financial report helps you track the health of your company. A sales report shows trends and highlights areas for improvement. These reports drive decision-making, monitor performance, and keep everyone informed.
In business, you rely on reporting meaning to extract and monitor data. You use the structure of a reportto build, consolidate, and summarize information. You often share your findings through dashboards, alerts, or scheduled documents. This process supports operational and tactical decisions. You help your organization understand what is happening and why.
Tip: When you follow the structure of a report, you make your message clear and easy to understand. This skill is valuable for anyone who wants to succeed in business.
Everyday Definition
You use reporting meaning in daily life, too. When you tell a friend about your day or write a summary for a class project, you create a report. The structure of a report in everyday situations is usually simple. You might start with what happened, add some details, and finish with your thoughts or feelings.
For example, you might report on a school event by describing what you saw and heard. You could write a short report for a club, sharing updates with other members. These reports help you share information, but they do not always require deep analysis.
Everyday reporting meaning focuses on presenting information for general understanding. You gather facts and share them in a way that makes sense to your audience. You may not need to use charts, graphs, or detailed analysis. Instead, you focus on telling the story clearly.
Note: Even in daily life, using a simple structure of a report helps you organize your thoughts and communicate better.
Key Differences
You might wonder how business reporting meaning differs from everyday reporting meaning. The main difference lies in the purpose, audience, and depth of analysis. Let’s look at a comparison:
Aspect
Business Reporting
Everyday Reporting
Purpose
Extracting and monitoring data to understand performance
Presenting information for general understanding
Specifics
Building, consolidating, and summarizing data
Gathering and presenting historical information
Final Output
Canned reports, dashboards, alerts
Ad hoc responses, insights, forecasts
People
Functional heads, often automated tasks
Data analysts and scientists, customized tasks
Value Proposition
Essential for business value, strategic insight
Focus on surface-level data, less strategic insight
You use business reporting meaning to evaluate present or past performance. You rely on historical data and analytics to identify trends and guide decisions. In contrast, everyday reporting meaning gives you a snapshot of information. You may not dig into the reasons behind the data.
Here are some practical examples:
Aspect
Business Reporting
Everyday Reporting
Purpose
To inform decisions and influence business results
To report on news or events without business focus
Audience
Internal stakeholders (e.g., management)
General public or interest groups
Data Utilization
Detailed analysis to guide decisions
May not require in-depth analysis
You see that business reporting meaning involves more structure, analysis, and impact. Everyday reporting meaning helps you share information quickly and simply. Both forms of reporting play important roles in your life. When you understand the structure of a report, you can adapt your style to fit any situation.
You rely on a report to make smart choices every day. In business, a report gives you the facts you need to decide what comes next. When you gather data and organize it into a clear report, you see patterns and trends in performance. This helps you spot what works and what needs to change. You can use a report to compare results from different teams or time periods. This makes it easier to choose the best path forward.
Systematic data collection in a report helps you understand the context of your work and its success.
Areport lets you assess what works and what needs improvement in your program or project.
You use a report to guide your actions with data-driven insights.
Sharing a report with others builds trust and helps everyone work together.
When you use a report to guide decisions, you avoid guessing. You base your choices on real numbers and facts. This leads to better outcomes and stronger performance.
Communication
A report is a powerful tool for sharing information. You use a report to explain results, share updates, and keep everyone on the same page. Good communication starts with a clear report. When you write a report, you organize your thoughts and make your message easy to understand.
Communication networks shape how you solve problems and share information. The way you structure your report affects how often team members connect and how much information they have for problem-solving.
The quality of your report matters more than how often you send updates. A well-written report improves team performance and helps everyone work better together.
You can use a report to break down complex ideas. This helps your team understand goals, track progress, and improve performance. When you share a report, you make sure everyone knows what is happening and what needs attention.
Impact on Organizations
A report has a big impact on how your organization runs. You use a report to track performance, set goals, and measure results. When you create a report, you help your team see where they stand and what they need to do next. A report supports planning, budgeting, and resource allocation.
Impact of Performance Reporting
Description
Better Decision-Making
Metrics in a report lead to smart choices and product focus.
Communication of Priorities
A report supports budgeting and resource planning.
Error Reduction
A report reduces mistakes and speeds up problem-solving.
Benchmarking
A report helps you compare your performance to industry standards.
Regular Reporting Encouragement
Frequent reports lead to better results and polished delivery.
Earning Executive Approval
A report gives proof for proposals and aligns with goals.
Transparency to Stakeholders
A report keeps everyone informed about progress.
Productivity Tracking
A report shows project timelines and team performance.
When you use a report to track performance, you spot problems early and fix them fast. You also celebrate wins and learn from mistakes. Over time, regular reporting builds a culture of accountability and drives better performance across your organization.
Types of Report
Formal Reports
You encounter formal reports in many business settings. These report formats follow strict rules and help you share important information with specific audiences. Formal reports are usually longer than a page but shorter than a book. You organize these reports into sections so readers can find what they need quickly. Each section stands alone and covers a key part of the topic.
Here is a table that shows the main features and examples of formal reports:
Characteristic/Example
Description
Purpose
Formal reports record and convey information for specific goals.
Length
Usually longer than a page, but not as long as a book.
Types
Two main categories: informational (summary report) and analytical (field report).
Structure
Modular, with sections that can stand alone for easy reference.
Key Elements
Organized around who, what, where, when, why, and how.
Common Examples
Credit reports, sales reports, field reports from health agencies.
You use formalreport formatswhen you need to present facts, findings, and recommendations. These reports avoid personal opinions and focus on data. You often see formal reports in finance, sales, and compliance. When you follow formal report formats, you make your message clear and professional.
Tip: Use formal report formats for important business topics. This helps your audience trust your information.
Informal Reports
You use informal reports when you want to share information quickly. These report formats are short, usually one to three pages. You do not need to include sections like introductions or summaries. Instead, you write in a personal tone and may use first-person language. Informal reports often use contractions and direct statements.
Informal report formats work well for updates, memos, or quick summaries. You do not need deep research or complex analysis. You focus on sharing facts and opinions in a friendly way. For example, you might write an informal report to update your team on a project or share feedback with your manager.
Formal reports require structure and careful language. Informal reports let you speak directly to your audience. You choose the report format based on your purpose and audience. If you need to share quick updates, informal report formats save time and keep communication simple.
Note: Use informal report formats for everyday communication. This helps you connect with your audience and share ideas easily.
Analytical Reports
You use analytical reports to study problems and find solutions. These report formats help you make informed decisions. You gather data, analyze trends, and suggest actions. Analytical reports track performance and measure how well strategies work. You use these reports to spot patterns and improve business results.
Here is a table that explains the main purposes and features of analytical reports:
Purpose/Feature
Description
Make Informed Decisions
Helps you understand the current state and possible actions.
Track Performance
Measures how well strategies work and if goals are met.
Identify Trends and Patterns
Shows changes in the market or business for quick adaptation.
Optimize Processes
Finds inefficiencies to reduce costs and boost performance.
Support Strategic Planning
Guides long-term planning by showing what drives success or blocks growth.
You use analytical report formats when you need to dig deeper into data. These reports help you answer questions like "Why did sales drop?" or "How can we improve efficiency?" You present your findings with charts, graphs, and clear explanations. Analytical reports support managers and teams in making smart choices.
Reminder: Analytical report formats help you solve problems and plan for the future. Use them when you need to analyze data and recommend actions.
Informative Reports
You often use an informative report when you need to share facts without adding your own opinions. This type of report gives your audience clear, unbiased information. You focus on presenting data, research, or findings in a way that helps others understand the topic. You do not include analysis or recommendations. Instead, you let the facts speak for themselves.
Informative reports play a key role in business and education. You might write a report to summarize survey results, describe a process, or present research findings. These reports help your readers get the information they need to make their own decisions. You keep your writing objective and avoid personal opinions.
Here is a table that shows how an informative report stands out from other types of business reports:
Characteristic
Informative Reports
Provides facts, research data
Yes
Offers analysis or evaluation
No
Reflects the author’s personal opinion
No
Offers recommendations for the future
No
You can see that an informative report only presents facts. You do not try to persuade your audience or suggest what they should do next. You simply organize the information so it is easy to understand.
Note: An informative report maintains objectivity. You present information in a straightforward, unbiased manner. You avoid using your own opinions and focus only on facts and data.
You usually follow a standard structure when you write an informative report. This structure helps your readers find the information they need quickly. Most informative reports include these sections:
Introduction: You explain the purpose of the report and what you will cover.
Methods: You describe how you collected the information.
Results: You present the facts, data, or findings.
Discussion: You explain what the results mean, but you do not give your own opinion.
Conclusion: You summarize the main points of the report.
You might use an informative report in many situations. For example, you could write a report to describe the results of a customer satisfaction survey. You might prepare a report to outline the steps in a new process at work. You could also use a report to present research findings in a science class.
When you write an informative report, you help your audience understand important information. You give them the facts they need to make their own choices. You make sure your report is clear, organized, and easy to read.
Management Reporting
Business Intelligence
You usemanagement reporting to turn raw data into clear information. This process helps you understand what is happening in your organization. When you create a report, you give leaders the facts they need to set strategies and monitor progress. You help your team adapt to changes and avoid guesswork.
Management reporting provides clarity. You transform numbers and figures into insights that guide decisions.
Business intelligence makes management reporting even more powerful. You use business intelligence tools to collect, analyze, and present data in a way that is easy to understand. These tools help you see trends and patterns in your report. You can track key performance indicators (KPIs) and know when to take action.
Business intelligence reporting gives you the information you need for smart choices.
You present data clearly so decision-makers can handle complex problems with confidence.
You monitor KPIs in real time and see how your data changes over time.
You use your report to guide plans, such as launching a new product or setting goals for the year.
When you use business intelligence, you make your report more effective. You help your organization move forward with certainty.
FanRuan and FineReport
You can improve management reporting with FanRuan and FineReport. These tools help you create, customize, and share reports quickly. You save time and reduce errors by automating your reporting process. You tailor each report to fit your business needs.
You get instant access to current data for better decisions.
Actionable Insights
You turn raw data into clear insights in your report.
Intuitive Interface
You build reports easily with drag-and-drop tools.
Cost Efficiency
You lower costs for development and maintenance compared to older methods.
You use FineReport in many real-world situations. For example, Northeast Securities switched to FineReport for better data analysis after facing problems with other tools. Dahua Technology uses FineReport with QlikView to handle complex reporting needs. Logistics and IoT companies rely on FineReport’s plugins to manage and track thousands of devices.
You can connect FineReport to systems like OA, CRM, and ERP.
You link your report to BI platforms such as QlikView.
You support business tasks like invoicing, attendance, and financial management.
FanRuan and FineReport help you create reports that drive business growth. You give your team the tools to make informed decisions and reach their goals. You make management reporting simple, fast, and reliable.
Tip: When you use FanRuan and FineReport, you empower your organization to act on data, not just collect it.
You depend on a report to keep your finances accurate and transparent. In business, a report gives you the facts you need for planning and compliance. When you prepare a financial report, you help leaders make smart choices about investments and resources. You also build trust with investors and partners.
A report ensures your business follows rules and avoids penalties.
You use a report to show how much profit or cash your company has.
Investors and lenders look at your report to decide if your business is strong.
A report helps you follow standards like GAAP, which keeps your business honest.
If you make a mistake in a report, you risk misleading your team. Wrong numbers can lead to poor decisions and hurt your company’s future. You need a report that is clear, correct, and easy to understand. This way, you support growth and keep your business safe.
Tip: Always double-check your report before sharing it. Accurate reporting protects your reputation and helps you grow.
Manufacturing Budgets
You use a report to manage your manufacturing budget and resources. A good report helps you see where your money goes and how to plan for the future. When you track your budget with a report, you spot problems early and fix them fast.
A report helps you manage cash flow by tracking money in and out.
You use a report to predict risks and prepare for disruptions.
A detailed report lets you compare your budget to actual results.
You encourage teamwork by sharing your report with other departments.
A report acts as a benchmark for your goals. You can adjust your plans when you see changes in your report. This keeps your factory running smoothly and helps everyone work together.
Note: Share your report with your team often. Open reporting leads to better decisions and stronger results.
Everyday Scenarios
You use a report in daily life more than you think. When you write a summary for school or explain an event to your family, you create a report. You organize facts, add details, and share what happened.
For example, you might use a report to:
Track your spending with a simple budget report.
Summarize a science project with a clear report for your teacher.
Share updates with your club using a short report.
A report helps you stay organized and makes your message clear. You learn to focus on the most important facts. When you practice writing a report, you build skills that help you at school, at work, and at home.
Remember: Every time you explain something clearly, you use the power of a report.
Common Reporting Terms
Report
You see the word report in many places. In business and academic literature, a report is a nonfiction document that organizes and summarizes facts on a specific topic, issue, or event. You use a report to give information to people who may not know much about the subject. A report often has sections like an executive summary, introduction, body, and conclusion. The format of a report can change based on who will read it and why you write it.
When youcreate a report, you collect facts and present them in a clear way. You might use a report to explain results, track progress, or share research. A report helps you make sense of data and turn it into useful information. You can use a report to show what happened, why it matters, and what should happen next.
A well-structured report makes your message easy to understand. You help your audience learn quickly and make better decisions.
You might write a report for school, work, or even for your own records. Each report has a purpose. Some reports give updates, while others analyze problems or suggest solutions. You choose the structure of your report to match your goal.
Data
Data is thefoundation of every report. You gather data from different sources, such as surveys, databases, or observations. Data can be numbers, words, images, or even sounds. When you collect data, you look for facts that help you answer questions or solve problems.
You use data to support the points in your report. For example, if you write a report about sales, you include data on how many products you sold. If you prepare a report for a science project, you add data from your experiments. Good data makes your report stronger and more reliable.
You must check that your data is accurate before you use it in a report. Mistakes in data can lead to wrong conclusions. You also need to organize your data so your report is easy to read. Tables, charts, and graphs help you show data clearly.
Metrics
Metrics are measurements you use in a report to track performance. You choose metrics that match your goals. For example, you might use sales numbers, customer satisfaction scores, or website visits as metrics in your report.
Performance metrics provide a straightforward method for businesses to evaluate their current state.
They enable tracking of progress and growth, helping to identify operational issues.
Metrics inform future decision-making and hold individuals accountable for their performance.
They incentivize success by providing measurable goals.
The significance of a performance metric is enhanced when compared to other relevant data, such as industry benchmarks or historical performance.
You include metrics in your report to show how well something is working. You can compare metrics over time or against goals. This helps you see if you need to make changes. When you use clear metrics in your report, you make it easier for others to understand results and take action.
Tip: Always explain what your metrics mean in your report. This helps your audience see why the numbers matter.
Analysis
You use analysis to make sense of the data in your report. Analysis means looking closely at numbers, facts, or trends to find out what they really mean. When you analyze data, you do more than just collect information. You search for patterns, spot unusual results, and discover what is important.
Analysis helps you identify significant anomalies, patterns, and trends within a dataset. You might notice a sudden drop in sales or a steady increase in customer satisfaction. These findings help you understand what is happening in your business or project.
Data interpretation assigns meaning to the insights revealed through analysis. You take the patterns you find and explain what they mean for your team or organization. This step turns raw numbers into useful knowledge.
Accurate data interpretation enables you and your managers to base decisions on solid evidence rather than assumptions. You avoid guessing and instead use facts to guide your next steps.
You can use charts, graphs, or tables to make your analysis clear. These tools help you see relationships between different pieces of data. For example, a line graph can show how sales change over time. A table can compare results from different departments.
Tip: Always check your analysis for accuracy. Mistakes in analysis can lead to wrong decisions. Double-check your work before sharing your findings.
Analysis is not just for experts. You use analysis every time you look at your grades, track your spending, or compare options before making a choice. When you practice analysis, you become better at solving problems and making smart decisions.
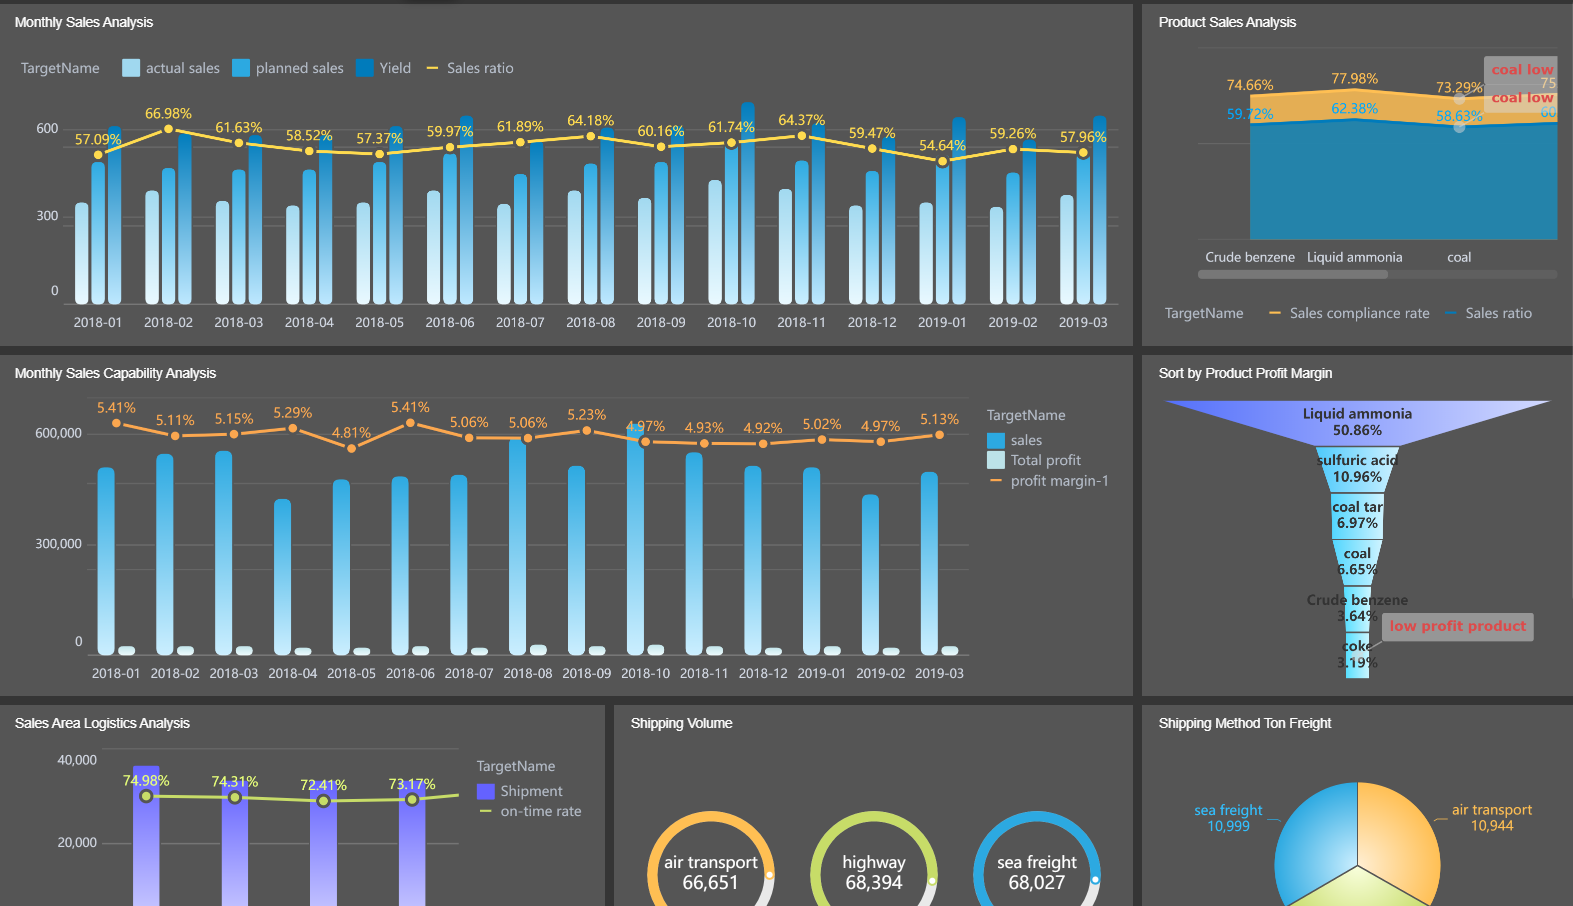
A dashboard gives you a quick view of important information. You see dashboards in many places, from business offices to your favorite apps. In reporting, a dashboard shows key data and trends in one place, often using charts, graphs, and numbers.
Real-time dashboards are built from scalable data pipelines. This means you get timely data access, so you always see the latest information.
Dashboards enable faster decision-making by providing fresh data visualizations that are easy to interpret. You do not have to wait for a report to be printed or emailed.
The ability to filter, aggregate, and enrich data in milliseconds allows for minimal latency. Dashboards support high concurrency in data requests, so many people can use them at once without delays.
Businesses can quickly identify trends and respond to changes. This enhances operational agility and helps teams stay ahead of problems.
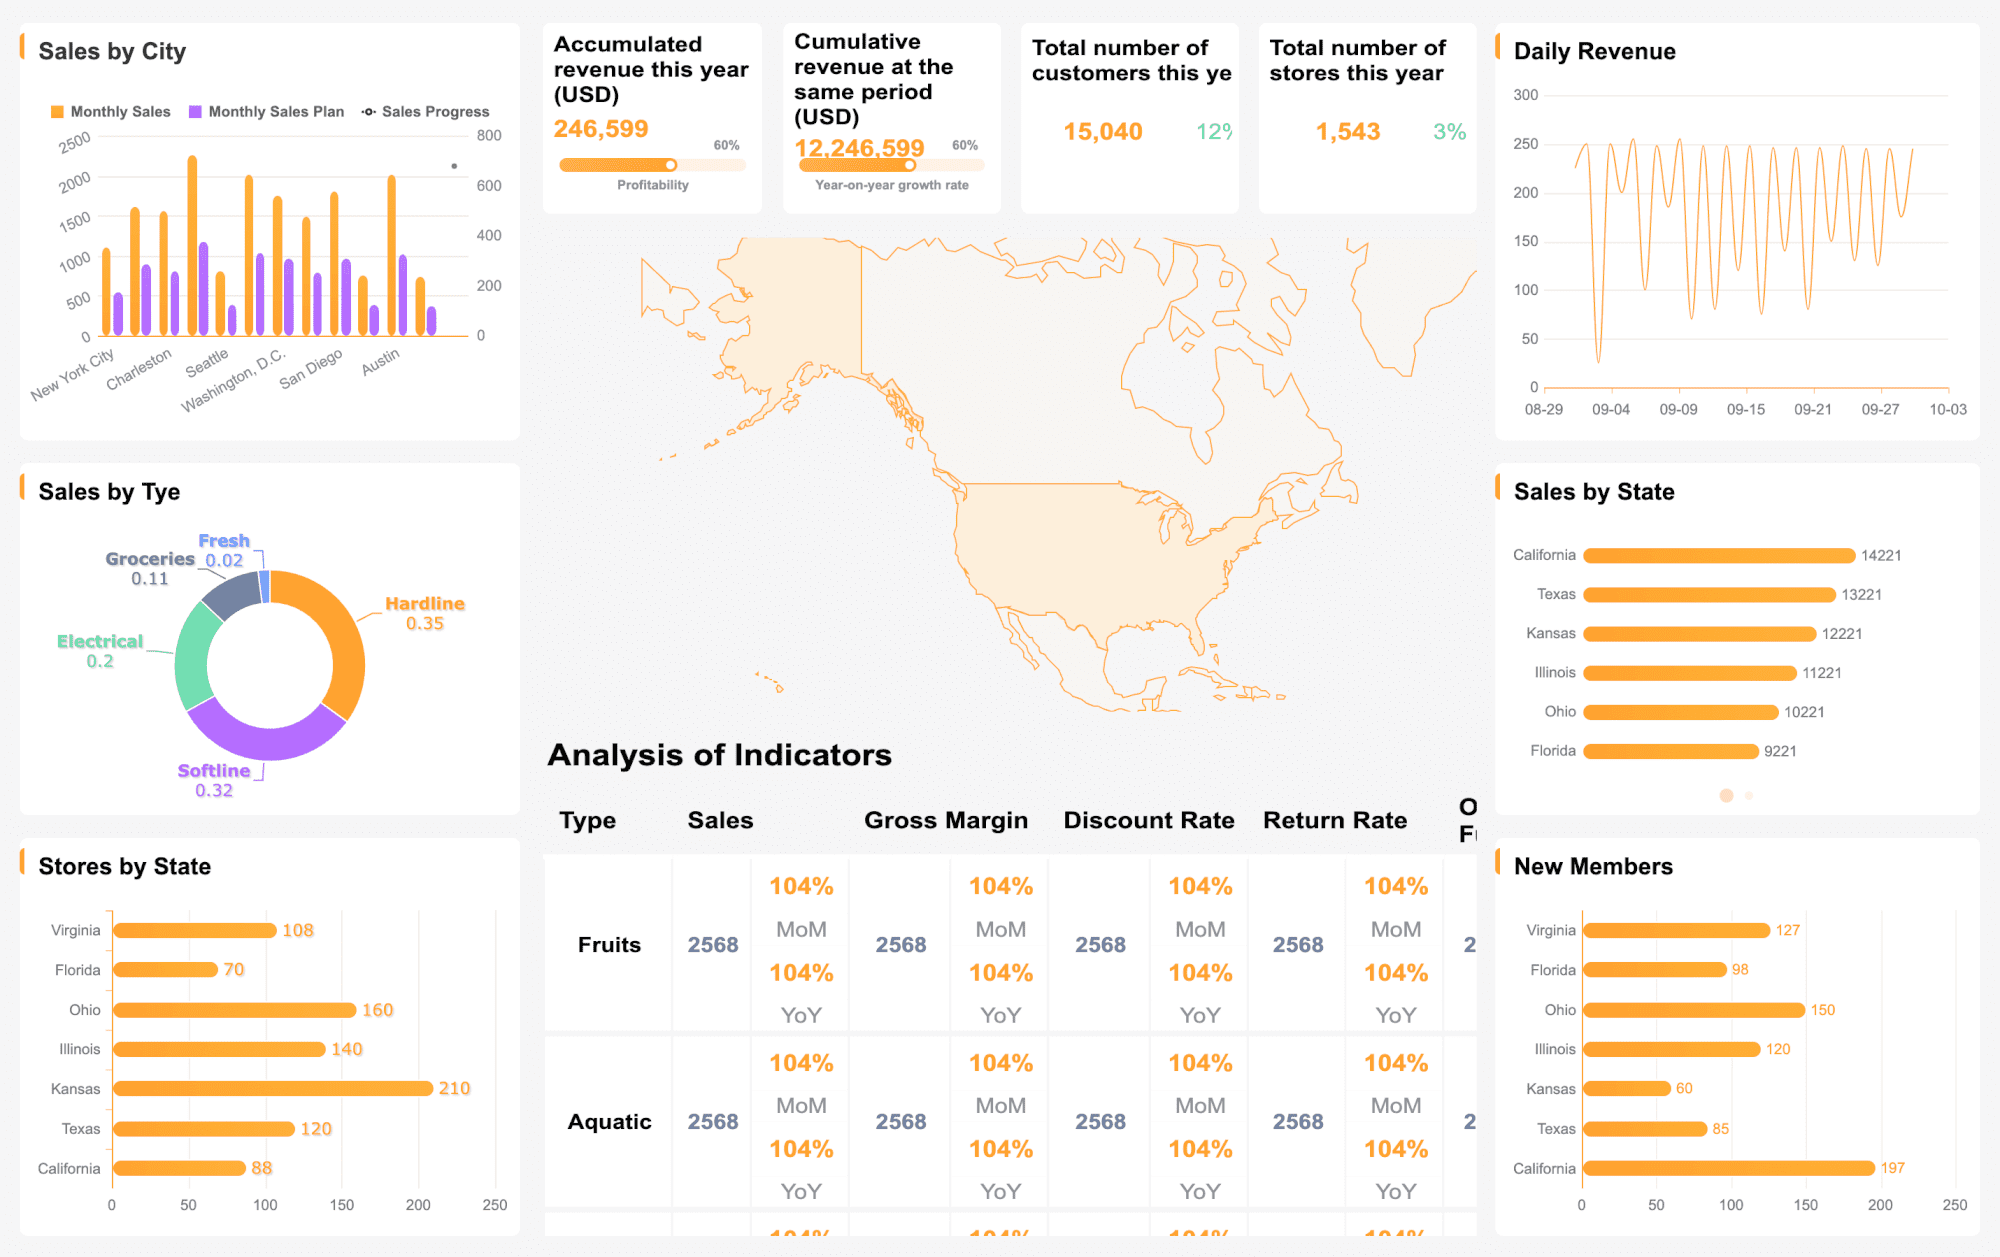
You can customize a dashboard to show the data that matters most to you. For example, a sales manager might track daily revenue, while a teacher might monitor student attendance. Dashboards help you focus on what is important and act quickly when something changes.
Note: A well-designed dashboard makes complex data easy to understand. You can spot problems, track progress, and celebrate successes—all in one place.
Dashboards are powerful tools for both business and personal use. When you learn how to read and use dashboards, you gain a valuable skill for making informed decisions every day.
Reporting for Better Decisions
Informed Choices
You make better decisions when you have the right information. Reporting gives you a clear view of what is happening in your business or daily life. When you use reports, you rely on facts instead of guesses. This helps you choose the best path forward.
You can use different types of evidence to support your choices:
Empirical evidence comes from real observations, measurements, or experiments. For example, you might use customer satisfaction surveys or sales data to see what works.
Statistical evidence uses numbers and math to show trends. You can analyze how a marketing campaign affects sales by looking at the data.
Mixed-methods research combines numbers with personal stories or interviews. This gives you a full picture of a situation, such as matching sales data with customer feedback.
When you use these types of evidence in your reports, you see patterns and understand what actions will lead to success. You avoid making decisions based on opinions alone. Instead, you use solid facts to guide your next steps.
Tip: Always check your sources and use a mix of data and real-world feedback for the most informed choices.
Accountability
Reporting helps you stay accountable in your work. When you track your actions and results, you know what you have done and what you need to improve. Accurate and timely reports keep you and your team responsible for your goals.
You can follow these steps to build accountability:
Prepare financial reports on time to keep your records accurate.
Use reliable accounting software to make sure your data is correct.
Share your reports with others regularly so everyone stays on track.
A culture of accountability grows when you report your progress. Employees take ownership of their tasks and invest their time wisely. When you share reports, you build trust and show that you care about reaching your goals. Regular reporting also keeps everyone informed and helps your team work together.
Note: Accountability in reporting leads to higher productivity and stronger commitment from everyone involved.
Transparency
Transparency means you share information openly and honestly. When you use clear and open reporting, you build trust with your team, customers, and other stakeholders. People want to know how decisions are made and how resources are used.
Key Point
Implication
Transparent financial reporting
Builds and maintains stakeholder trust
Fosters confidence
Enhances credibility and aligns interests
Stronger relationships
Leads to long-term success
Financial transparency shows that you use funds properly. This honesty attracts support and keeps your reputation strong. When you report openly, you show accountability and include others in your process. Trust grows when people see that you have nothing to hide.
Remember: Transparent reporting is the foundation for lasting relationships and long-term success.
You use reporting to organize facts and share ideas in both business and daily life.
Effective reporting helps you make smart decisions and communicate clearly.
FineReport gives you powerful tools to create reports and dashboards that drive better results.
You can improve your skills by practicing how to write and present reports.
Take action today. Recognize the value of reporting and start building stronger reporting habits in every part of your life.
Click the banner below to try FineReport for free and empower your enterprise to transform data into productivity!
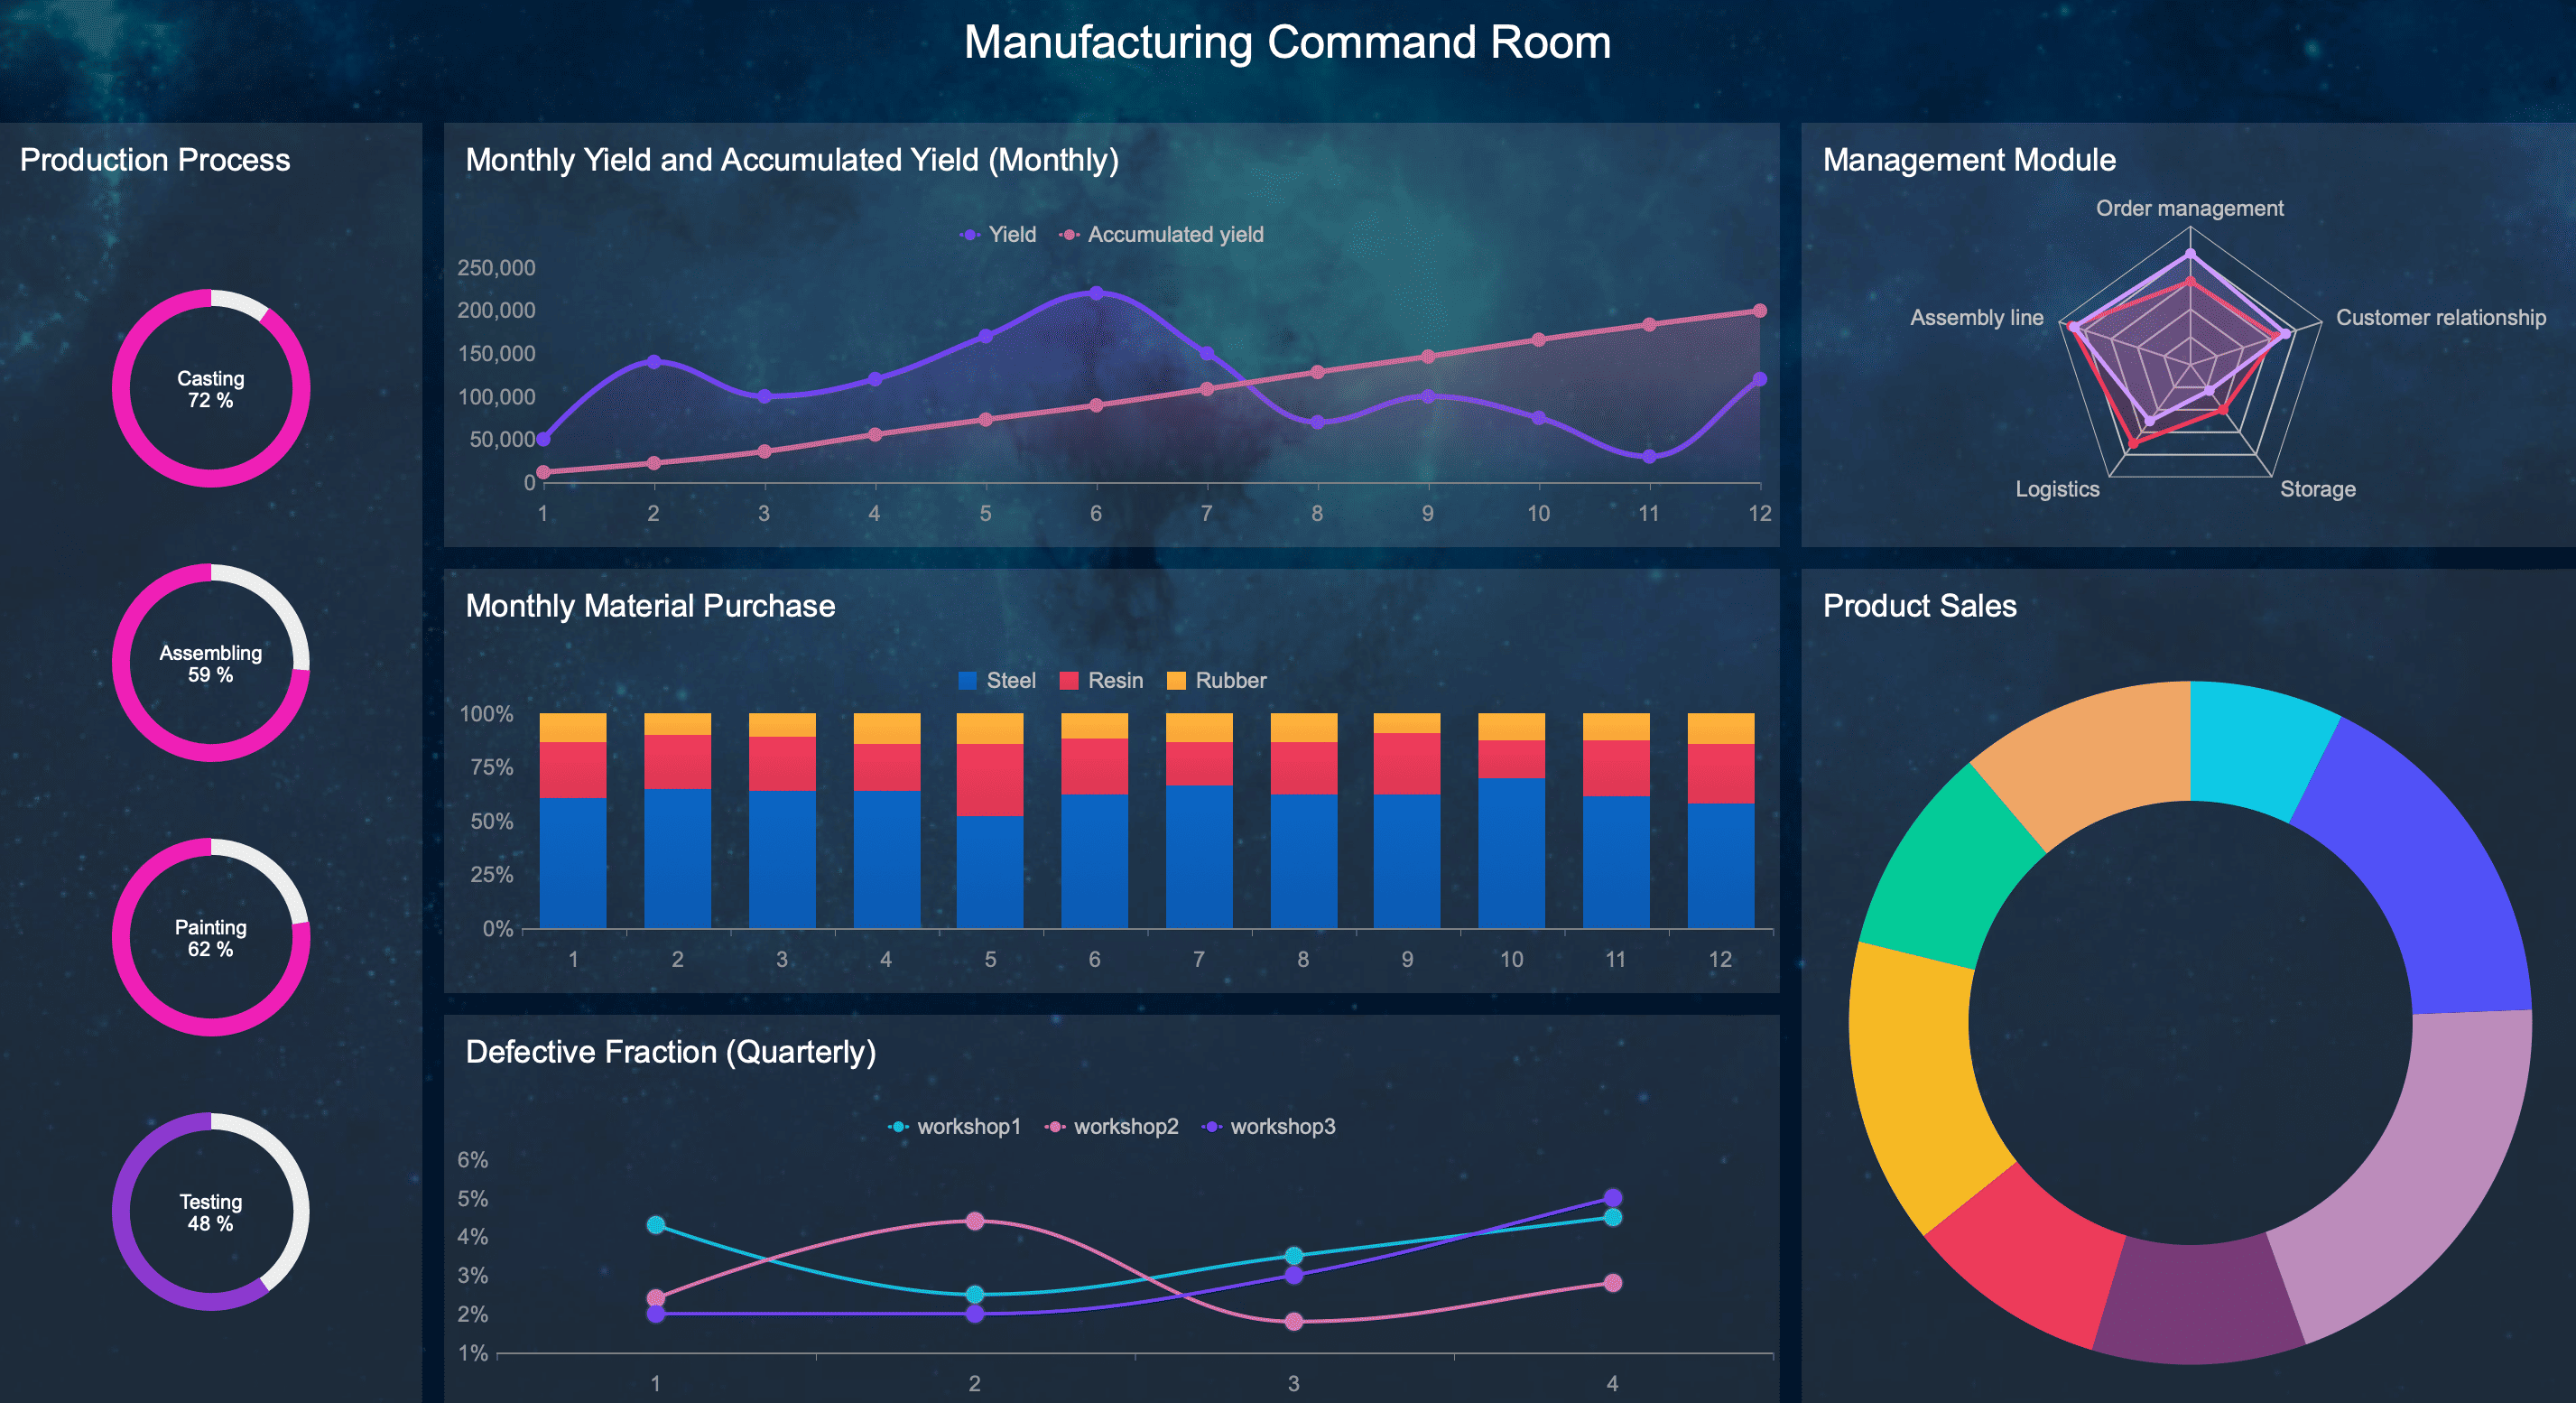
Real-time insights to optimize production, logistics, and decisions.
FAQ
What is the main purpose of a report?
You use a report to organize and share facts. Reports help you explain results, track progress, and support decisions. A clear report makes information easy to understand for everyone.
How does FineReport help with reporting?
FineReport lets you create, customize, and share reports quickly. You can connect to many data sources, use drag-and-drop tools, and view real-time dashboards. This helps you make better business decisions.
What is the difference between a dashboard and a report?
A dashboard shows key data and trends in one place, often with charts and graphs. You use a report to give detailed information or analysis. Dashboards give you a quick overview, while reports provide more depth.
Why is accurate data important in reporting?
Accurate data builds trust. You rely on correct numbers to make smart choices. Mistakes in data can lead to wrong decisions and hurt your business or project.
Can I use reporting skills outside of business?
Yes! You use reporting skills in school, clubs, and daily life. Writing a summary, tracking spending, or sharing updates all use reporting. These skills help you communicate clearly everywhere.