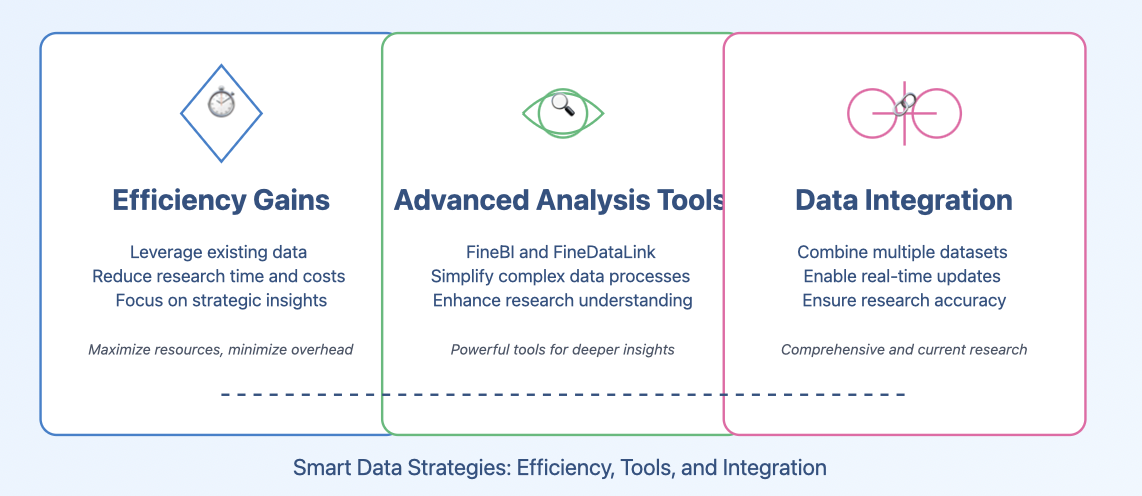
Secondary data analysis involves examining existing datasets to uncover insights without the need for new data collection. This approach has become essential in modern research due to its efficiency and accessibility. For instance, fields like epidemiology and purchasing management increasingly rely on secondary data to save time and resources. You can access larger, more diverse datasets while avoiding the high costs of primary data collection. Tools like FineBI and FineDataLink simplify this process by enabling seamless data integration and self-service analytics, empowering you to focus on interpreting data rather than gathering it.
Key Takeaways on Secondary Data Analysis
- Using existing data saves time and money, allowing researchers to focus on results.
- Tools like FineBI and FineDataLink simplify data analysis and improve understanding.
- Combining datasets and real-time updates strengthen research and ensure accuracy.
Understanding Secondary Data Analysis
What is Secondary Data Analysis?
Secondary data analysis involves using pre-existing data to uncover new insights, validate findings, or test hypotheses. This method allows you to bypass the time-consuming process of collecting primary data. Instead, you can focus on analyzing data that others have already gathered. For example, you might use government records, academic journals, or industry reports to support your research objectives. By leveraging secondary data, you can save time and resources while accessing a wealth of information.
To conduct effective secondary data analysis, you should follow a structured approach. Start by defining the research objectives. Then, identify relevant data sources, evaluate their quality, and prepare the data for analysis. This process ensures that your findings are both credible and actionable.
Key Characteristics of Secondary Data
Secondary data differs from primary data in several ways. The table below highlights these distinctions:
| Characteristic | Primary Data | Secondary Data |
|---|---|---|
| Source of Data | Collected directly by the researcher | Collected by someone else for a different purpose |
| Originality | Original and unique to the research | Not original to the current research |
| Specificity | Highly specific to the research question | May not be as specific |
| Control | Researcher has full control over data collection | Researcher has no control over data collection |
| Time and Cost | Time-consuming and often expensive to collect | Quicker and more cost-effective |
| Accuracy and Reliability | Can be more accurate and reliable if collected properly | May have issues with accuracy or reliability |
| Data Collection Methods | Surveys, interviews, observations, experiments | Government publications, academic journals, etc. |
Understanding these characteristics helps you decide when to use secondary data for your research. For instance, if you need quick access to large datasets, secondary data is an excellent choice.
Examples of Secondary Data Sources
Government and Public Databases
Government and public databases are among the most reliable sources of secondary data. These include census data, economic reports, and public health statistics. You can access these datasets online or through subscriptions. By analyzing raw data from these sources, you can uncover trends and insights that align with your research objectives. Tools like FineDataLink simplify this process by integrating data from multiple government sources in real time, ensuring accuracy and efficiency.
Academic Research Repositories
Academic research repositories house a wealth of information, including peer-reviewed articles, case studies, and literature reviews. These repositories allow you to explore existing knowledge and identify gaps in research. For example, you might use content analysis to examine qualitative data and uncover patterns. FineBI enhances this process by enabling self-service analytics, allowing you to analyze academic data without relying on IT support.

Industry Reports and Surveys
Industry reports and surveys provide valuable insights into market trends, consumer behavior, and competitive landscapes. These sources are particularly useful for business and market research. With FineBI, you can visualize this data using advanced charts and dashboards, making it easier to interpret and share findings. Additionally, FineVis offers dynamic 3D visualizations that bring your data to life, enhancing your ability to communicate insights effectively.

By leveraging these sources of secondary data, you can conduct comprehensive analyses that drive informed decision-making. Whether you're exploring public health trends or studying consumer behavior, tools like FineBI and FineDataLink streamline the process, allowing you to focus on generating actionable insights.
How Secondary Data Analysis Differs from Primary Data Analysis
Primary Data Analysis vs. Secondary Data Analysis
Primary data analysis involves collecting new data directly from sources to address specific research questions. You design and control the entire process, ensuring the data aligns perfectly with your objectives. In contrast, secondary data analysis uses pre-existing datasets, which others have collected for different purposes. This approach allows you to save time and resources while accessing a broader range of information.
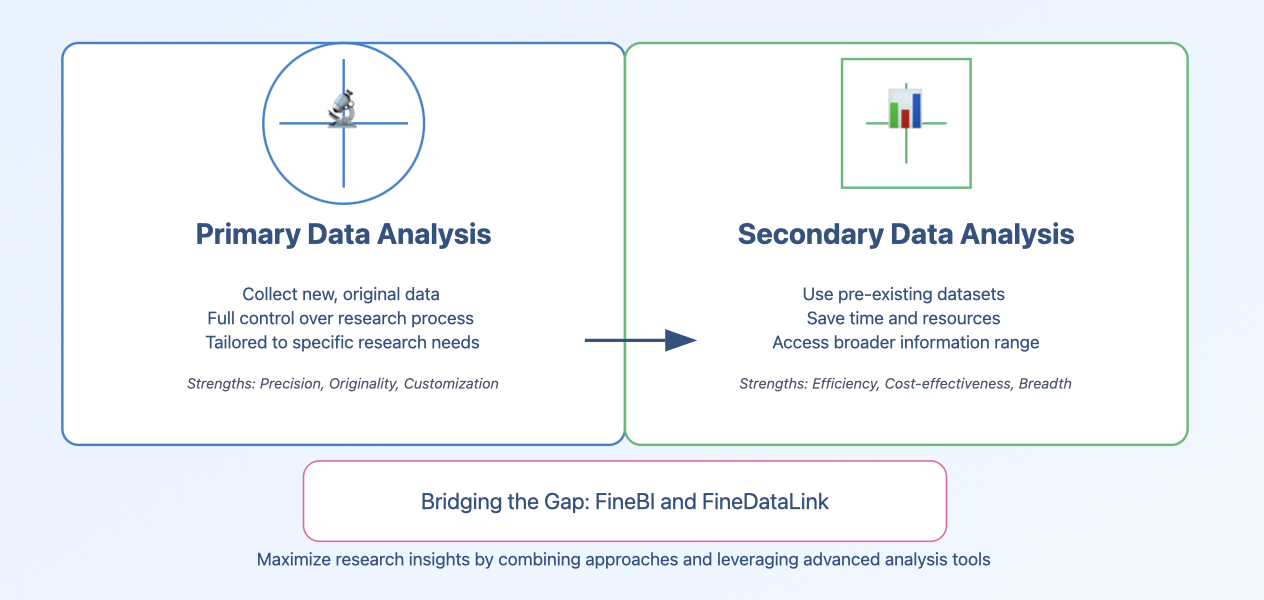
Each method has unique strengths. Primary data analysis provides fresh, original insights tailored to your research needs. However, it often requires significant time and financial investment. Secondary data analysis offers efficiency and cost-effectiveness, but the data may lack specificity or control over its collection process. Tools like FineBI and FineDataLink can help you overcome these challenges by streamlining data integration and analysis, ensuring you maximize the value of secondary data.
Key Differences in Data Collection and Usage
The differences between primary and secondary data analysis become evident when you examine their data collection methods and usage. The table below highlights these distinctions:
Aspect | Primary Data | Secondary Data |
|---|---|---|
| Source of Data | Collected directly by the researcher | Collected by someone else |
| Originality | Original and unique to the research | Not original to the current research |
| Specificity | Highly specific to the research question | May not be as specific |
| Control | Researcher has full control over the process | Researcher has no control over data collection |
| Time and Cost | Time-consuming and often expensive | Quicker and more cost-effective |
| Accuracy and Reliability | Can be more accurate if collected properly | May have issues with accuracy depending on the source |
When using secondary data, you might encounter challenges like outdated information or limited relevance to your research. FineDataLink addresses these issues by enabling real-time data synchronization and seamless integration across multiple sources. This ensures you work with accurate and up-to-date datasets, enhancing the reliability of your analysis.
Examples Highlighting the Differences
Using Census Data vs. Conducting a Survey
Imagine you want to analyze sales performance across multiple regions and products. Gathering primary data, such as conducting surveys or manually collecting sales information from various departments, can be time-consuming and resource-intensive. Alternatively, you could use historical sales data, a classic example of secondary data, which provides a comprehensive view of past performance.
In this case, FineBI's Multidimensional Marketing Analysis Platform can help you visualize this data through interactive dashboards, making it easier to spot trends and patterns. For example, the platform’s Annual Sales section provides a clear overview of sales performance across different subsidiaries. The Trend Analysis section offers insight into order quantities and active customers over time, and the Product Sales Top 3 section highlights the best-selling products. By using FineBI, you can quickly identify areas of growth or concern, enabling you to make informed decisions without the need for time-consuming data collection.
You can try it out in the demo model below:
Analyzing Clinical Trial Data vs. Running an Experiment
In healthcare research, running an experiment allows you to control variables and collect precise data tailored to your study. However, this approach demands significant investment and time. Analyzing clinical trial data, a form of secondary data, offers a cost-effective alternative. You can access existing datasets to explore treatment outcomes or validate hypotheses. FineDataLink simplifies this process by integrating data from various clinical sources, ensuring you have a unified and reliable dataset for analysis.
By understanding these differences and leveraging tools like FineBI and FineDataLink, you can choose the most suitable approach for your research. Whether you prioritize originality or efficiency, these tools empower you to conduct effective analyses and derive actionable insights.
The Importance of Secondary Data Analysis in Research

Benefits of Secondary Data Analysis
Cost-Effectiveness and Time Efficiency
Secondary data analysis offers significant advantages, particularly in terms of cost and time. Collecting primary data often requires substantial resources, including funding, personnel, and time. By utilizing secondary data, you can bypass these challenges and focus directly on analyzing existing datasets. This approach allows you to allocate resources more efficiently while achieving your research objectives faster. For example, instead of conducting a nationwide survey, you can use census data to gain insights into population demographics. Tools like FineDataLink further enhance this efficiency by integrating data from multiple sources in real time, reducing manual effort and ensuring accuracy.
Access to Large and Diverse Datasets
One of the most compelling advantages of secondary research is the ability to access large and diverse datasets. These datasets often include information collected over extended periods or across various regions, providing a broader perspective for your analysis. By leveraging secondary data, you can explore new hypotheses, identify trends, and uncover patterns that might be challenging to detect with smaller datasets. For instance:
- Secondary data allows you to utilize existing information to answer new questions.
- It maximizes the value of datasets by enabling the exploration of trends and relationships.
- Access to extensive datasets enhances the depth and breadth of your research.
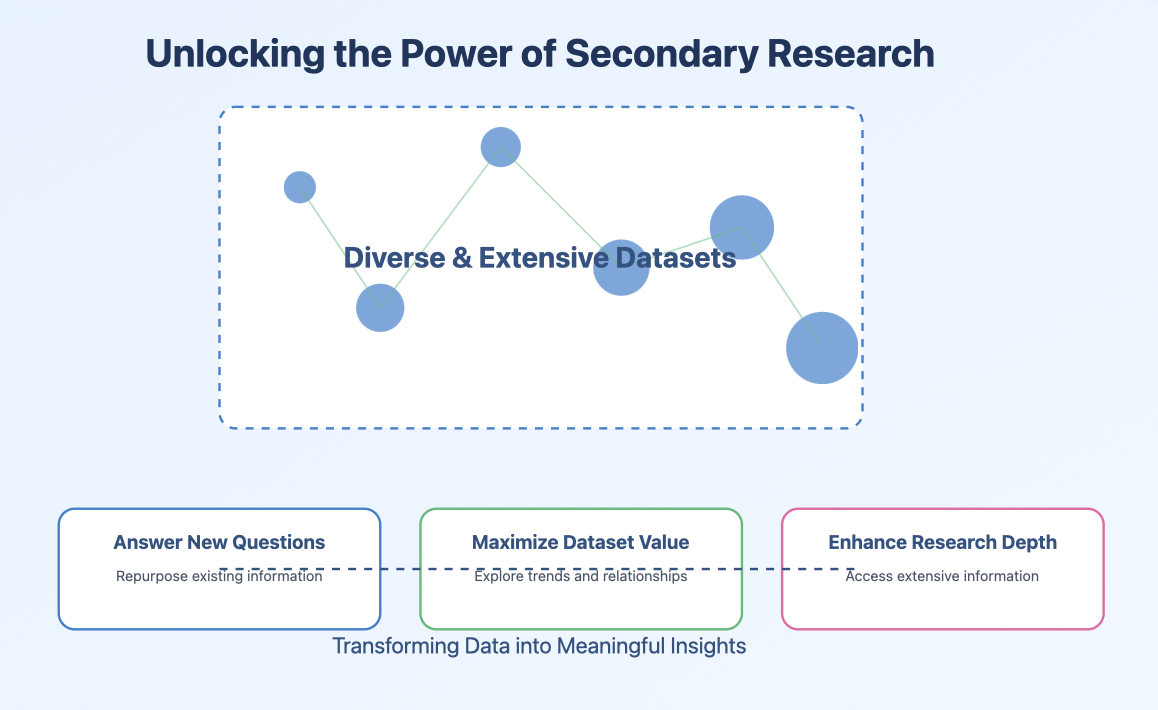
FineBI empowers you to analyze these datasets effectively through self-service analytics and advanced visualization tools. This capability ensures that you can extract meaningful insights without relying heavily on IT support.
Enabling Longitudinal and Comparative Studies
Secondary data plays a crucial role in enabling longitudinal and comparative studies. These studies examine changes over time or differences between groups, providing valuable insights into trends and patterns. For example, you can compare census data from five years ago with current data to analyze population growth or demographic shifts. The table below illustrates this:
FineDataLink simplifies such analyses by synchronizing data from various sources, ensuring consistency and reliability. This feature is particularly beneficial for longitudinal studies, where data accuracy is paramount.
How FineBI and FineDataLink Enhance Secondary Data Analysis
Streamlining Data Integration with FineDataLink
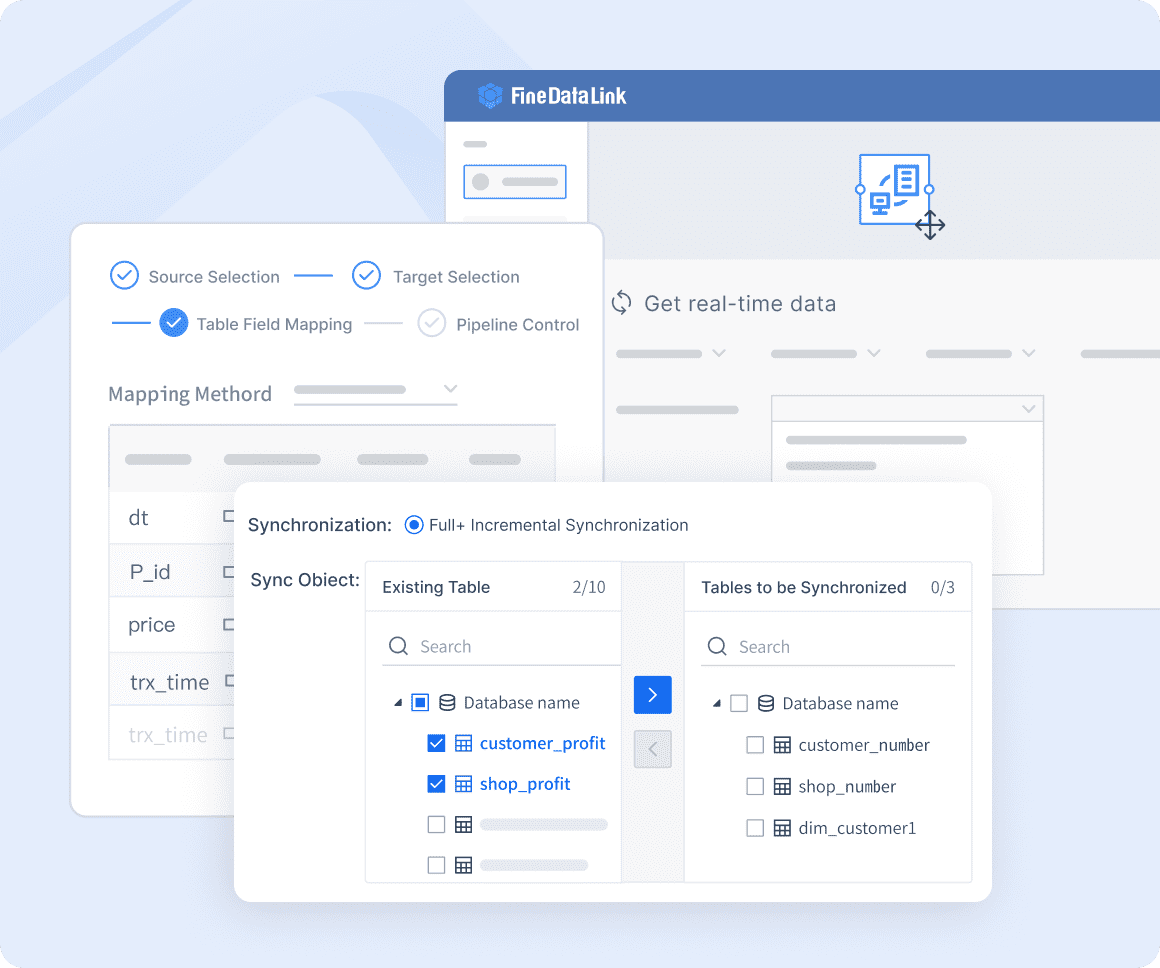
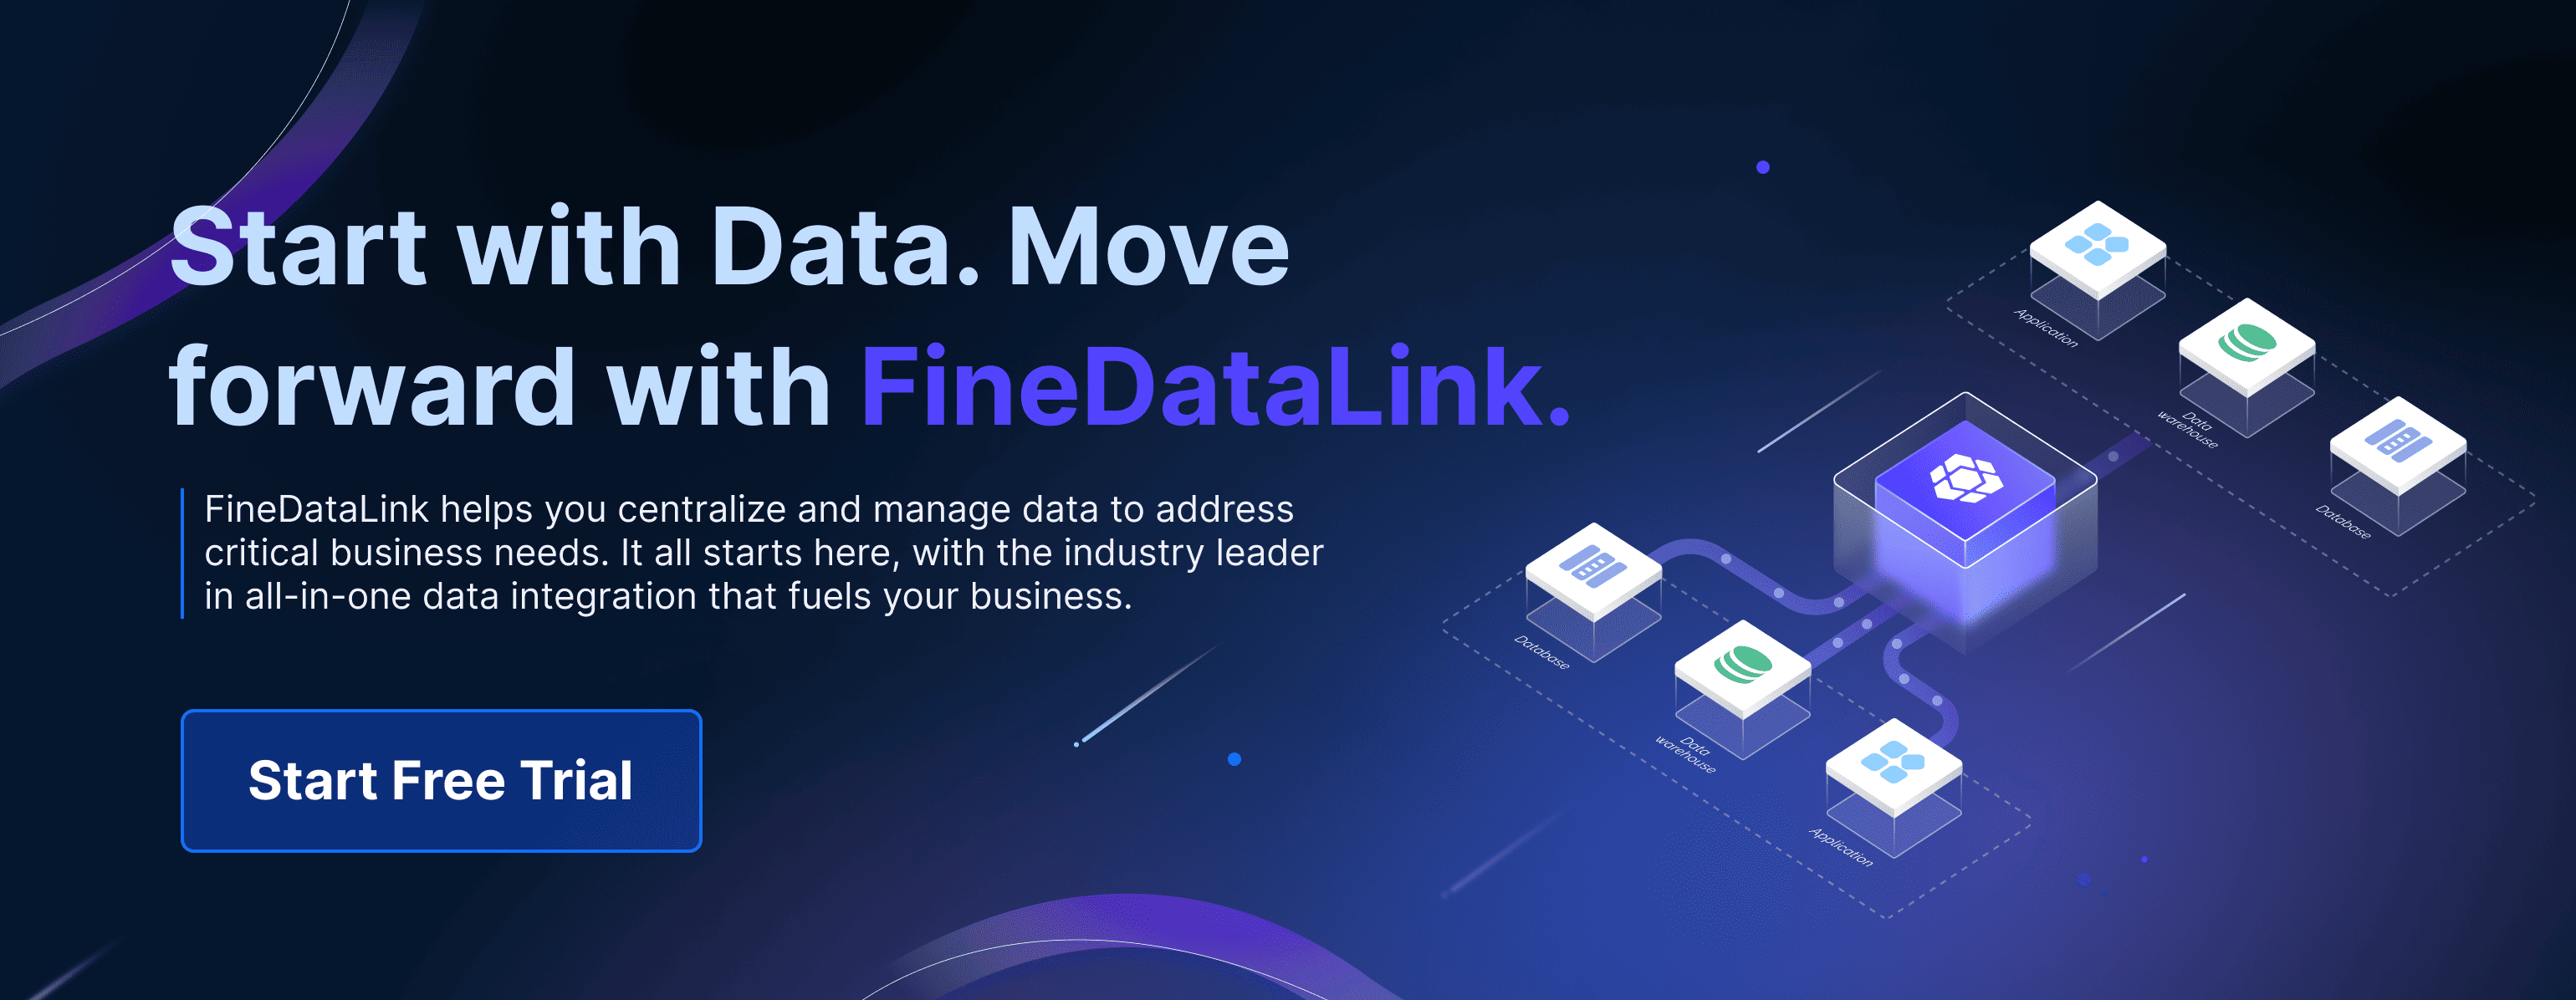
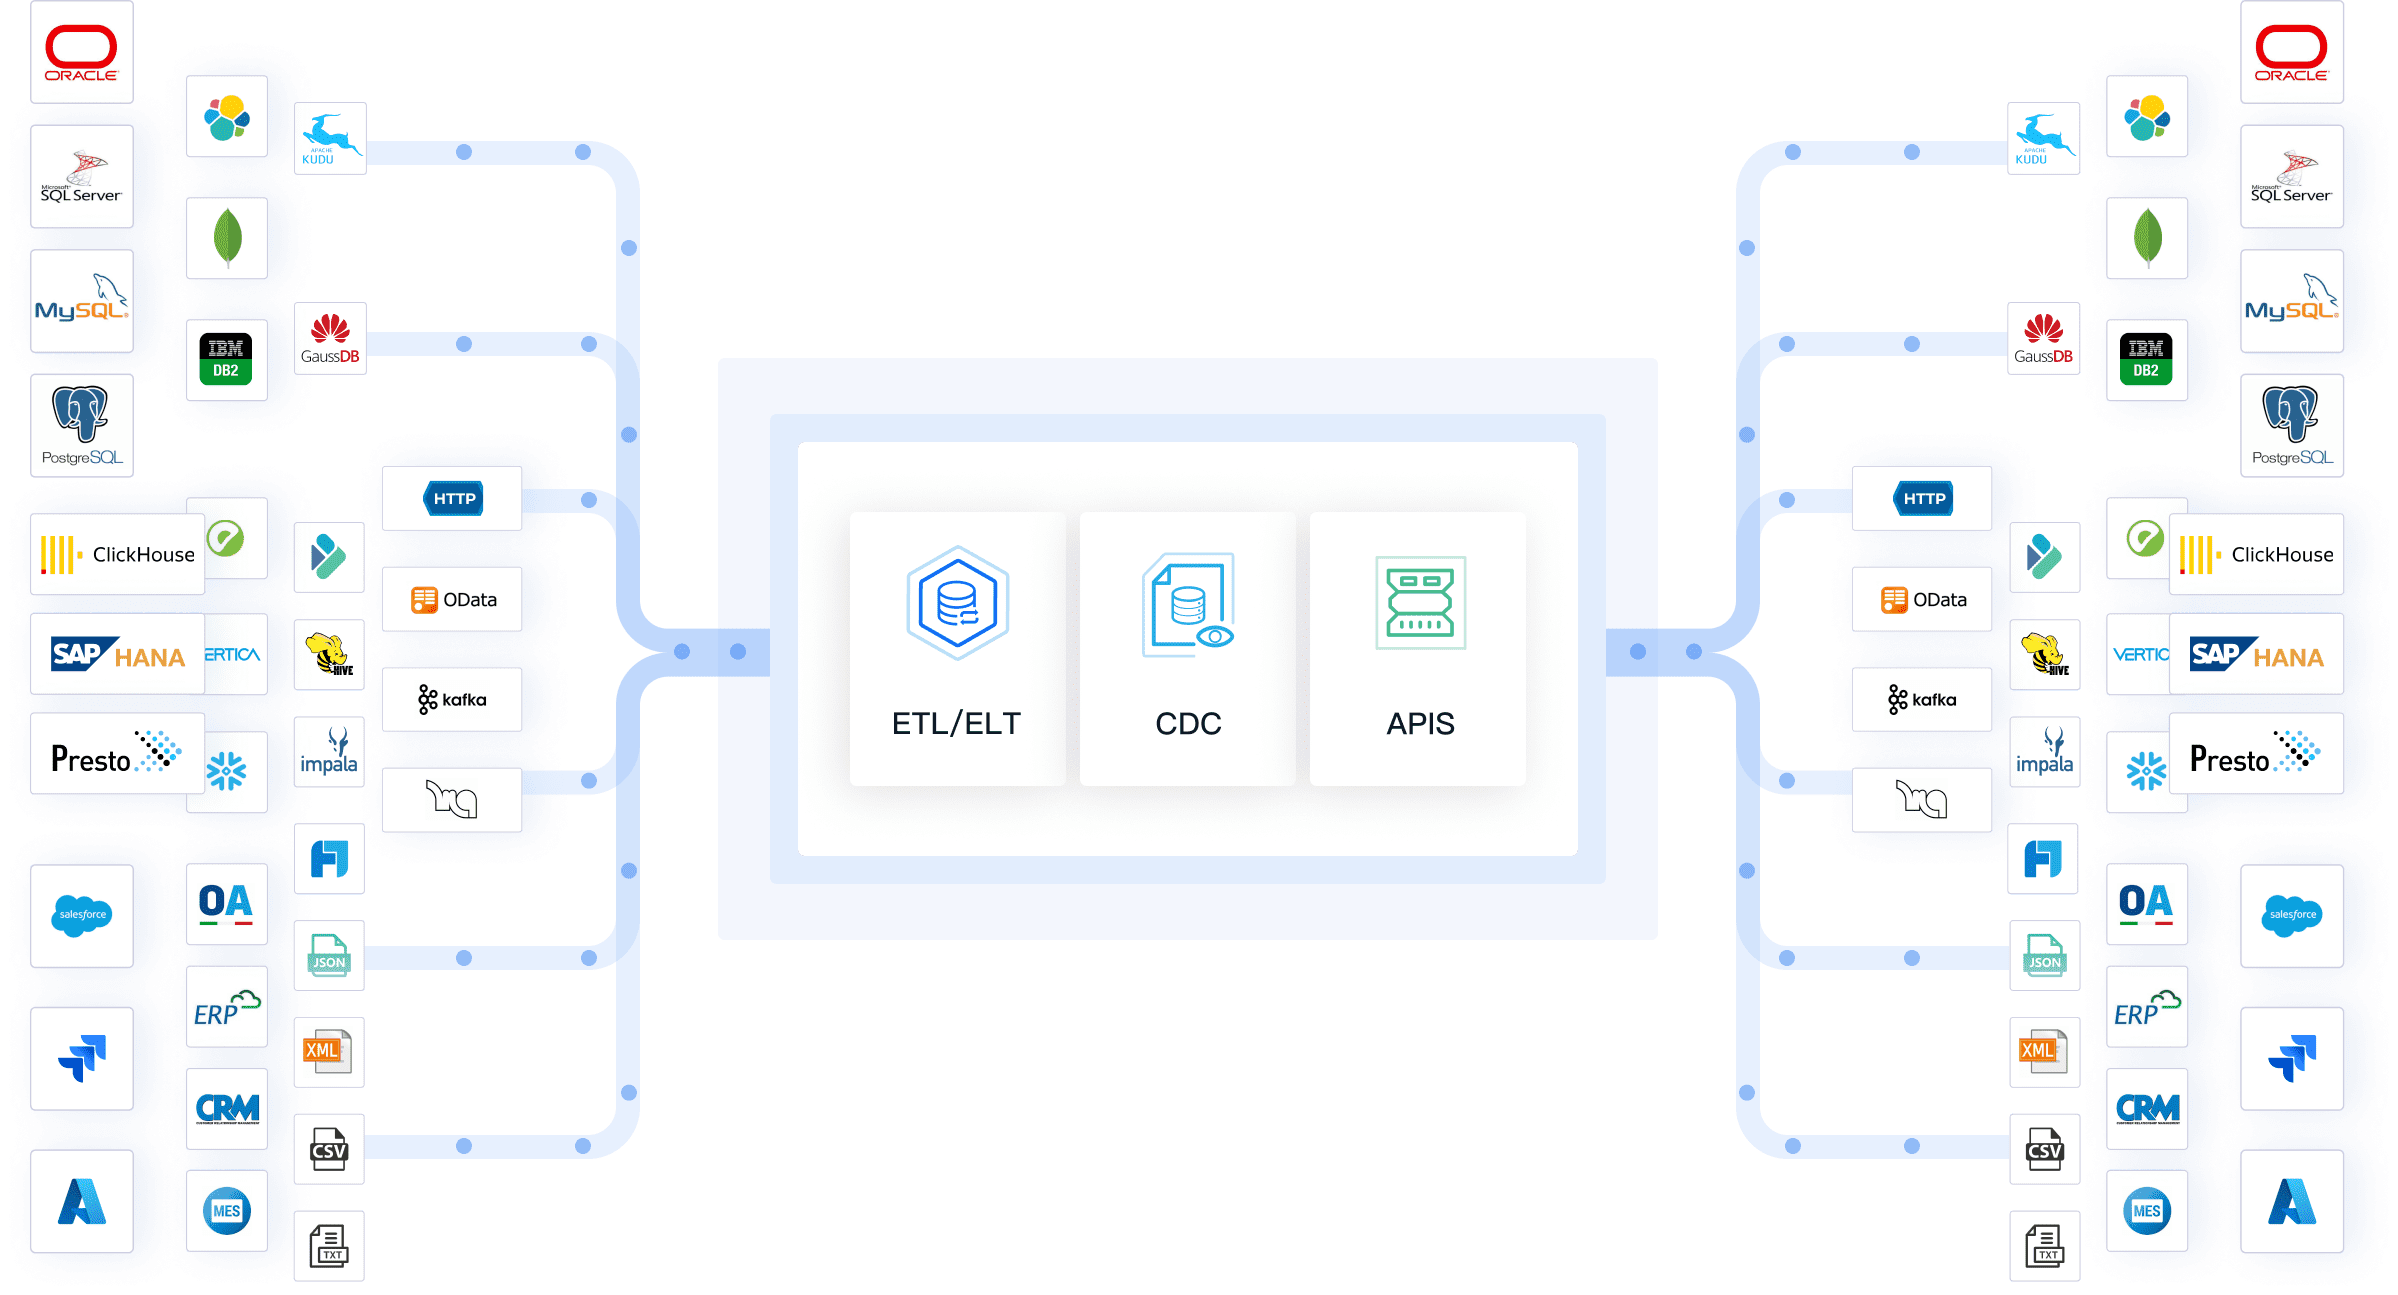
FineDataLink revolutionizes the way you handle secondary data by addressing common challenges like data silos and inconsistent formats. Its real-time data synchronization feature ensures that you work with the most up-to-date information, eliminating the risk of outdated or incomplete datasets. The platform supports over 100 data sources, allowing seamless integration across systems. Whether you're analyzing government databases or industry reports, FineDataLink provides a unified data layer that enhances the reliability of your analysis.
Empowering Self-Service Analytics with FineBI
FineBI democratizes data analysis by making it accessible to users with varying levels of technical expertise. Its intuitive interface and drag-and-drop functionality enable you to explore secondary data independently, without requiring advanced coding skills. FineBI also offers robust visualization options, including over 60 chart types and dynamic dashboards. These features allow you to present your findings in a clear and engaging manner, making it easier to communicate insights to stakeholders. By combining FineBI with FineDataLink, you can streamline the entire process of secondary data analysis, from integration to visualization.

The importance of secondary data cannot be overstated. It provides a cost-effective, efficient, and comprehensive approach to research. With tools like FineBI and FineDataLink, you can overcome traditional challenges and unlock the full potential of secondary data, driving informed decision-making and impactful outcomes.
Applications of Secondary Data Analysis in Research
Common Fields of Application
Social Sciences and Public Policy
Secondary data plays a pivotal role in social sciences and public policy. You can use it to analyze societal trends, evaluate policy impacts, or study demographic changes. For instance, government databases like census data or public health statistics provide a wealth of information for understanding population dynamics. These datasets allow you to conduct comprehensive analyses without the need for primary data collection. FineDataLink enhances this process by integrating data from multiple government sources in real time, ensuring accuracy and efficiency. This capability is particularly valuable for policymakers who need reliable data to make informed decisions.
Healthcare and Epidemiology
In healthcare and epidemiology, secondary data is indispensable. It enables you to analyze public health trends, evaluate treatment outcomes, and identify risk factors for diseases. Sources like the CDC, State Cancer Profiles, and SMART datasets offer extensive information for research. For example, you can use these datasets to study the spread of infectious diseases or the effectiveness of public health interventions. FineBI empowers you to visualize this data through interactive dashboards, making it easier to identify patterns and communicate findings. Additionally, FineDataLink ensures that your data is up-to-date and synchronized across multiple sources, enhancing the reliability of your analysis.
Business and Market Research
Secondary data is a cornerstone of business and market research. You can use it to study consumer behavior, analyze market trends, or evaluate competitive landscapes. Industry reports, surveys, and historical sales data provide valuable insights that drive strategic decision-making. For example, a retail company might use secondary data to optimize inventory management or develop targeted marketing campaigns. FineBI simplifies this process by offering self-service analytics and advanced visualization tools. With features like drag-and-drop functionality and over 60 chart types, FineBI allows you to explore data independently and present your findings effectively.
Real-World Scenarios
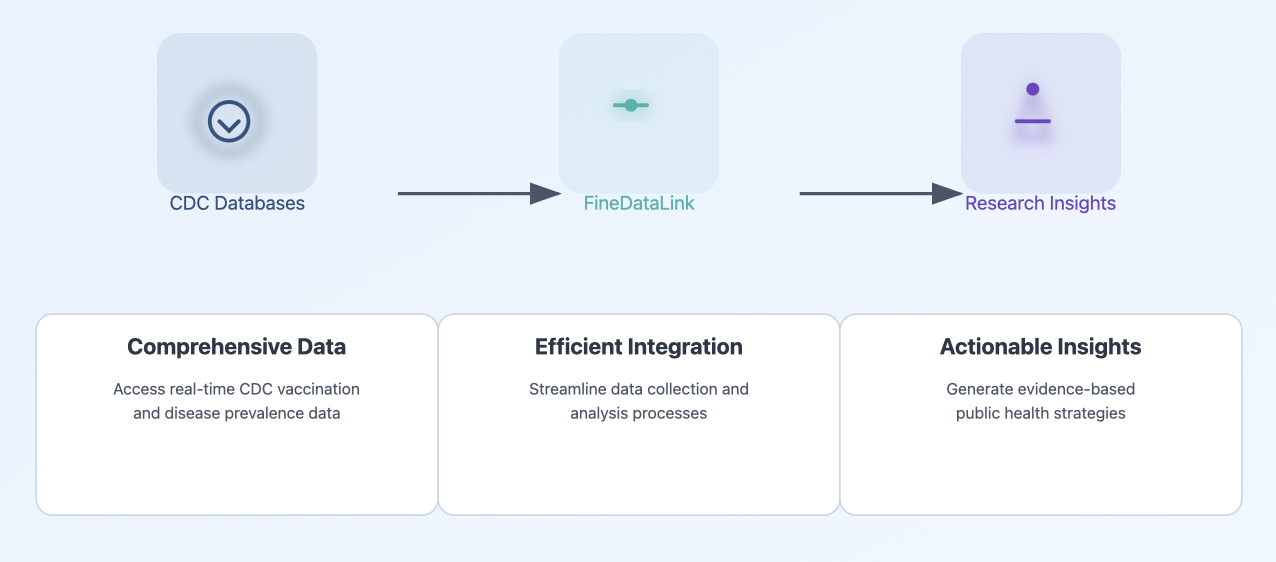
Analyzing Public Health Trends with CDC Data
Imagine you are researching the impact of vaccination programs on public health. Instead of conducting new surveys, you can analyze CDC data to assess vaccination rates and their correlation with disease prevalence. FineDataLink streamlines this process by integrating data from CDC databases in real time, ensuring you work with accurate and comprehensive datasets. This approach saves time and resources while providing actionable insights.
Studying Consumer Behavior Using Industry Reports
A marketing firm might want to understand consumer preferences for mobile apps. By analyzing industry reports and survey data, you can identify trends and recommend features that align with user needs. FineBI enhances this analysis by offering dynamic dashboards and advanced visualization options. These tools make it easier to interpret data and share insights with stakeholders, enabling data-driven decision-making.
Leveraging FineVis for Data Visualization in Research
Effective data visualization is essential for conveying hospital performance metrics. For example, with FineVis, raw patient flow data can be transformed into interactive 3D visualizations, like the one shown in the "FanRuan Hospital" dashboard. This tool helps hospitals track outpatient registrations, diagnoses, waiting times, and more in a dynamic format. FineVis’s intuitive, zero-code interface makes it accessible to hospital administrators and medical staff, enabling better decision-making. By utilizing such visualizations, you can optimize patient flow, enhance resource management, and improve the overall experience. Experience the power of interactive data visualizations with the dashboard below!
You can try it out in the demo model below:
Challenges and Limitations of Secondary Data Analysis
Common Challenges
Data Quality and Reliability Issues
When conducting secondary data analysis, you may encounter challenges related to data quality and relevance. Since you did not collect the data yourself, you cannot verify its accuracy or ensure it aligns perfectly with your research objectives. Errors in the original data collection process, such as incorrect entries or biased sampling, can lead to flawed conclusions. Additionally, anonymization methods used by original researchers might inadvertently compromise the data's reliability, especially if they obscure critical details.
Lack of Control Over Data Collection Methods
Secondary data often reflects the priorities and methods of the original researchers, not your own. This lack of control can limit your ability to refine research questions or adapt methodologies during the analysis. For example, if the original data excludes certain variables or populations, you might struggle to address specific aspects of your study. These limitations can restrict the depth and scope of your findings.
Potential for Outdated or Incomplete Data
Secondary data can become outdated quickly, especially in fast-evolving fields like technology or healthcare. Relying on such data might lead to irrelevant or misleading insights. Missing or incomplete data further complicates the analysis, as you cannot fill these gaps without access to the original sources. For instance, if a dataset lacks recent updates, your conclusions might not reflect current trends or realities.
Strategies to Overcome Challenges
Verifying Data Sources and Credibility
To ensure the reliability of secondary data, you should evaluate the reputation of the organization or publication providing the data. Cross-checking with authoritative sources can help confirm accuracy. Always prioritize recent data while considering its historical context. Assess the scope, coverage, and methodology of the dataset to ensure it aligns with your research objectives. For example, FineDataLink simplifies this process by integrating data from trusted sources in real time, ensuring you work with accurate and up-to-date information.
Combining Multiple Datasets for Comprehensive Analysis
Using multiple datasets can help you address gaps or inconsistencies in secondary data. By comparing and contrasting different sources, you can identify patterns and discrepancies, enhancing the overall reliability of your analysis. FineBI excels in this area by allowing you to integrate and analyze diverse datasets through its self-service analytics platform. Its intuitive interface enables you to explore data independently, ensuring a comprehensive and efficient analysis process.
Leveraging FineDataLink for Real-Time Data Synchronization
FineDataLink offers a powerful solution for overcoming the limitations of secondary data. Its real-time data synchronization feature ensures you always work with the most current information. By integrating data from over 100 sources, FineDataLink eliminates the risk of outdated or incomplete datasets. This capability is particularly valuable for longitudinal studies or comparative analyses, where data accuracy and consistency are critical. With FineDataLink, you can streamline your data integration process and focus on generating actionable insights.
By addressing these challenges proactively and leveraging tools like FineBI and FineDataLink, you can maximize the value of secondary data in your research. These strategies not only enhance the reliability of your findings but also empower you to conduct more impactful and efficient data analysis.
Conducting Effective Secondary Data Analysis
Steps to Conduct Secondary Data Analysis
Identifying Relevant Data Sources
The first step in conducting effective secondary data analysis is to identify relevant data sources. Start by defining your research objectives clearly. This clarity helps you pinpoint the type of data you need. Look for credible sources such as government databases, academic repositories, and industry reports. For example, census data or public health statistics can provide valuable insights for demographic studies. FineDataLink simplifies this process by integrating data from over 100 sources, ensuring you have access to accurate and up-to-date information. Its real-time synchronization feature eliminates the hassle of manually updating datasets, saving you time and effort.
Evaluating Data Quality and Relevance

Once you identify relevant data sources, evaluate the quality and relevance of the data. Check if the data aligns with your research objectives and whether it is reliable. Look for details about how the data was collected, its sample size, and its timeliness. FineDataLink enhances this step by offering tools to clean and transform data, ensuring compatibility and consistency across multiple sources. This feature is particularly useful when dealing with datasets that vary in format or structure. By using FineDataLink, you can focus on analyzing high-quality data without worrying about inconsistencies.
Analyzing and Interpreting Data
After gathering and evaluating your data, the next step is to analyze the data and interpret the findings. Use statistical tools to uncover patterns, trends, and relationships within the data. FineBI excels in this area by providing self-service analytics and advanced visualization options. Its drag-and-drop interface allows you to explore data independently, even if you lack technical expertise. Additionally, FineBI offers over 60 chart types, enabling you to present your findings in a visually compelling way. This capability makes it easier to communicate insights to stakeholders and drive informed decision-making.
Tools and Technologies for Secondary Data Analysis
FineBI for Self-Service Analytics
FineBI empowers you to analyze secondary data without relying on IT support. Its user-friendly interface and robust features make it an ideal choice for both beginners and experienced analysts. Unlike other tools, FineBI integrates seamlessly with various data sources, including relational databases and big data platforms. It also supports real-time analysis, ensuring you work with the most current data. With FineBI, you can create interactive dashboards and perform OLAP analysis, making it easier to identify trends and patterns in your data.
FineDataLink for Data Integration
FineDataLink stands out as a powerful data integration platform. It addresses common challenges like data silos and inconsistent formats by offering real-time synchronization and advanced ETL/ELT capabilities. These features allow you to merge, clean, and harmonize data from multiple sources effortlessly. FineDataLink also supports API integration, enabling you to share data across different systems. This versatility makes it a valuable tool for researchers who need to combine datasets for comprehensive analysis.
FineVis for Advanced Data Visualization
As an important module in FineReport. FineVis takes data visualization to the next level with its dynamic 3D visualizations and customizable dashboards. Its zero-code, drag-and-drop interface makes it accessible to users of all skill levels. FineVis supports over 60 chart types and offers real-time analytics, allowing you to present your findings in an engaging and interactive manner. Whether you're analyzing market trends or public health data, FineVis helps you transform raw data into compelling visual stories that resonate with your audience.
You can try it out in the demo model below:
By following these steps and leveraging tools like FineBI, FineDataLink, and FineVis, you can streamline the process of conducting effective secondary data analysis. These tools not only enhance efficiency but also ensure the accuracy and reliability of your findings, empowering you to make data-driven decisions with confidence.
Secondary data analysis allows you to use existing datasets to achieve your research objectives efficiently. It offers cost-effectiveness, access to diverse datasets, and the ability to explore trends without the need for primary data collection. For example, epidemiological studies benefit from extensive healthcare data, enhancing their reliability and scope.
The applications of secondary data analysis span various fields. A school principal might use nationwide studies to improve curricula, while a business analyst could refine marketing strategies using demographic data. Tools like FineBI, FineDataLink, and FineVis simplify this process. FineBI empowers you with self-service analytics, FineDataLink ensures seamless data integration, and FineVis transforms insights into compelling visualizations.
By leveraging these tools, you can unlock the full potential of secondary data. This approach not only saves time and resources but also drives impactful and informed decision-making.
Click the banner below to also experience FineReport for free and empower your enterprise to convert data into productivity!

Continue Reading About Data Analysis
Why Care About Data Platforms? Find Out Here!
Understanding Descriptive Analytics: What It Is and How It Works
Step-by-Step Guide to Setting Up a Data Analytics Framework
Write a Killer Visual Analysis Essay in 2025!
Descriptive Analytics Unlocked: Turn Numbers into Insights
Sales Analytics in 2025: Why It’s a Must-Have!


FAQ

The Author
Lewis
Senior Data Analyst at FanRuan
Related Articles

What Recruiters Look for in a Data Analysis Portfolio: 10 Criteria to Score Yours Fast
A $1 is not judged like a school assignment. It is judged like a hiring shortcut. Recruiters, hiring managers, and analytics leads use it to answer one question fast: Can this person solve business problems with data in
Lewis Chou
May 29, 2026

What Is Data Analytics Consulting? Beginner’s Guide to Services, Deliverables, and Business Value
$1 helps organizations turn raw data into decisions they can trust. For many business leaders, the challenge is not a lack of data. It is a lack of clarity. Reports conflict, teams track different KPIs, dashboards are un
Lewis Chou
Jun 03, 2026

Data Analyst Job Description [+2026 Guide]: Compare Responsibilities, Skills, and Salary by Industry
A strong $1 does more than list tasks. It defines how a company turns raw data into business decisions, which teams the analyst supports, and what measurable outcomes the role is expected to influence. For employers, tha
Lewis Chou
Jun 02, 2026