Reporting software is a tool that automatically turns data from multiple sources into clear reports and dashboards to help you track performance and make informed decisions.
If you want to make smarter decisions in 2026, you need the best reporting software:
- FineReport
- Microsoft Power BI
- Tableau
- Looker
- Qlik Sense
- Domo
- Zoho Analytics
- Sisense
- IBM Cognos Analytics
- Google Data Studio
These reporting tools help you create and share reports that show what’s happening in your business. Automated reporting tools give you real-time data, save you time, and make your work more accurate. Intelligence built into these platforms helps you spot trends fast. Check out how businesses are adopting these solutions:
| Statistic Description | Value | Projected Growth | Source |
|---|---|---|---|
| Data integration market size in 2024 | $15.24 billion | Projected to reach $47.60 billion by 2034 | Precedence Research |
| iPaaS market size in 2024 | $9.1-$15.63 billion | Expected to grow at ~26-35% CAGR | Persistence Market Research |
| Global spending on data integration by 2030 | $33.24 billion | 13.6% CAGR from 2025 | MarketsandMarkets |
| Software integration tools value by 2033 | $20.1 billion | 11.9% CAGR | Dimension Market Research |
- Automated reporting tools give you instant access to data, helping teams save up to 60% in processing time.
- These tools boost accuracy and keep everyone working toward the same goals.
If you’re looking for a practical guide, FineReport stand out as top choices for 2026.
Reporting Software and Business Intelligence
What Is Reporting Software?
You might wonder what reporting software actually does. Think of it as your business’s smart assistant for turning raw data into clear, useful reports and dashboards. Reporting software helps you collect information from different places, organize it, and show it in ways that make sense. You can use these tools to track sales, monitor inventory, or check employee performance. With automated reporting tools, you don’t have to spend hours crunching numbers or copying data into spreadsheets. The software handles report automation, so you get up-to-date reports without the hassle.
Reporting software tools let you connect to many data sources, build custom dashboards, and share insights with your team. You can spot trends, compare results, and make decisions faster. A good reporting platform also helps you keep everyone on the same page, so your team works toward shared goals.
Tip: Automated reporting tools save you time and boost accuracy. You get instant access to the latest data, which means fewer mistakes and more confidence in your decisions.
Why Intelligence Matters in Reporting Tools
Intelligence is the secret sauce that makes reporting tools truly powerful. When you use reporting software with built-in intelligence, you get more than just numbers. The software analyzes your data, highlights important patterns, and even suggests what to look at next. Business intelligence features help you see the big picture and dig into details without getting lost.
Here’s how intelligence in reporting software benefits you:
- You make informed decisions because you see clear data, not just guesses.
- You stay ahead of competitors by spotting market trends early and adjusting your strategy.
- You find ways to improve operations and cut costs by identifying inefficiencies.
- Automated reporting tools deliver accurate, timely data, so you act fast.
- Your team adopts analytics more easily when insights are easy to understand.
- Analysts save time by avoiding duplicate reports and breaking down data silos.
- Leaders get clear evidence trails, which helps with compliance and governance.
Business intelligence and reporting software work together to give you a complete view of your business. When you combine automated reporting tools with intelligence, you unlock deeper insights and make smarter moves every day.
Top 10 Reporting Software Tools for 2026
Choosing the right reporting software can make a huge difference in how you run your business. You want tools that help you create reports, automate tasks, and get real-time insights. Let’s look at the top reporting tools for 2026. I’ll break down what makes each one special, so you can pick the best fit for your team.
Here’s a quick look at the criteria experts use to rank reporting software tools:
| Criteria | Description |
|---|---|
| Usability | A user-friendly interface that minimizes training and enhances productivity. |
| Integration | The ability to connect seamlessly with existing systems and data sources for efficient reporting. |
| Cost | Balancing the cost of the tool against the value it provides, including flexible pricing options. |
| Essential Features | Key functionalities such as data integration, customization, automation, and visualization. |
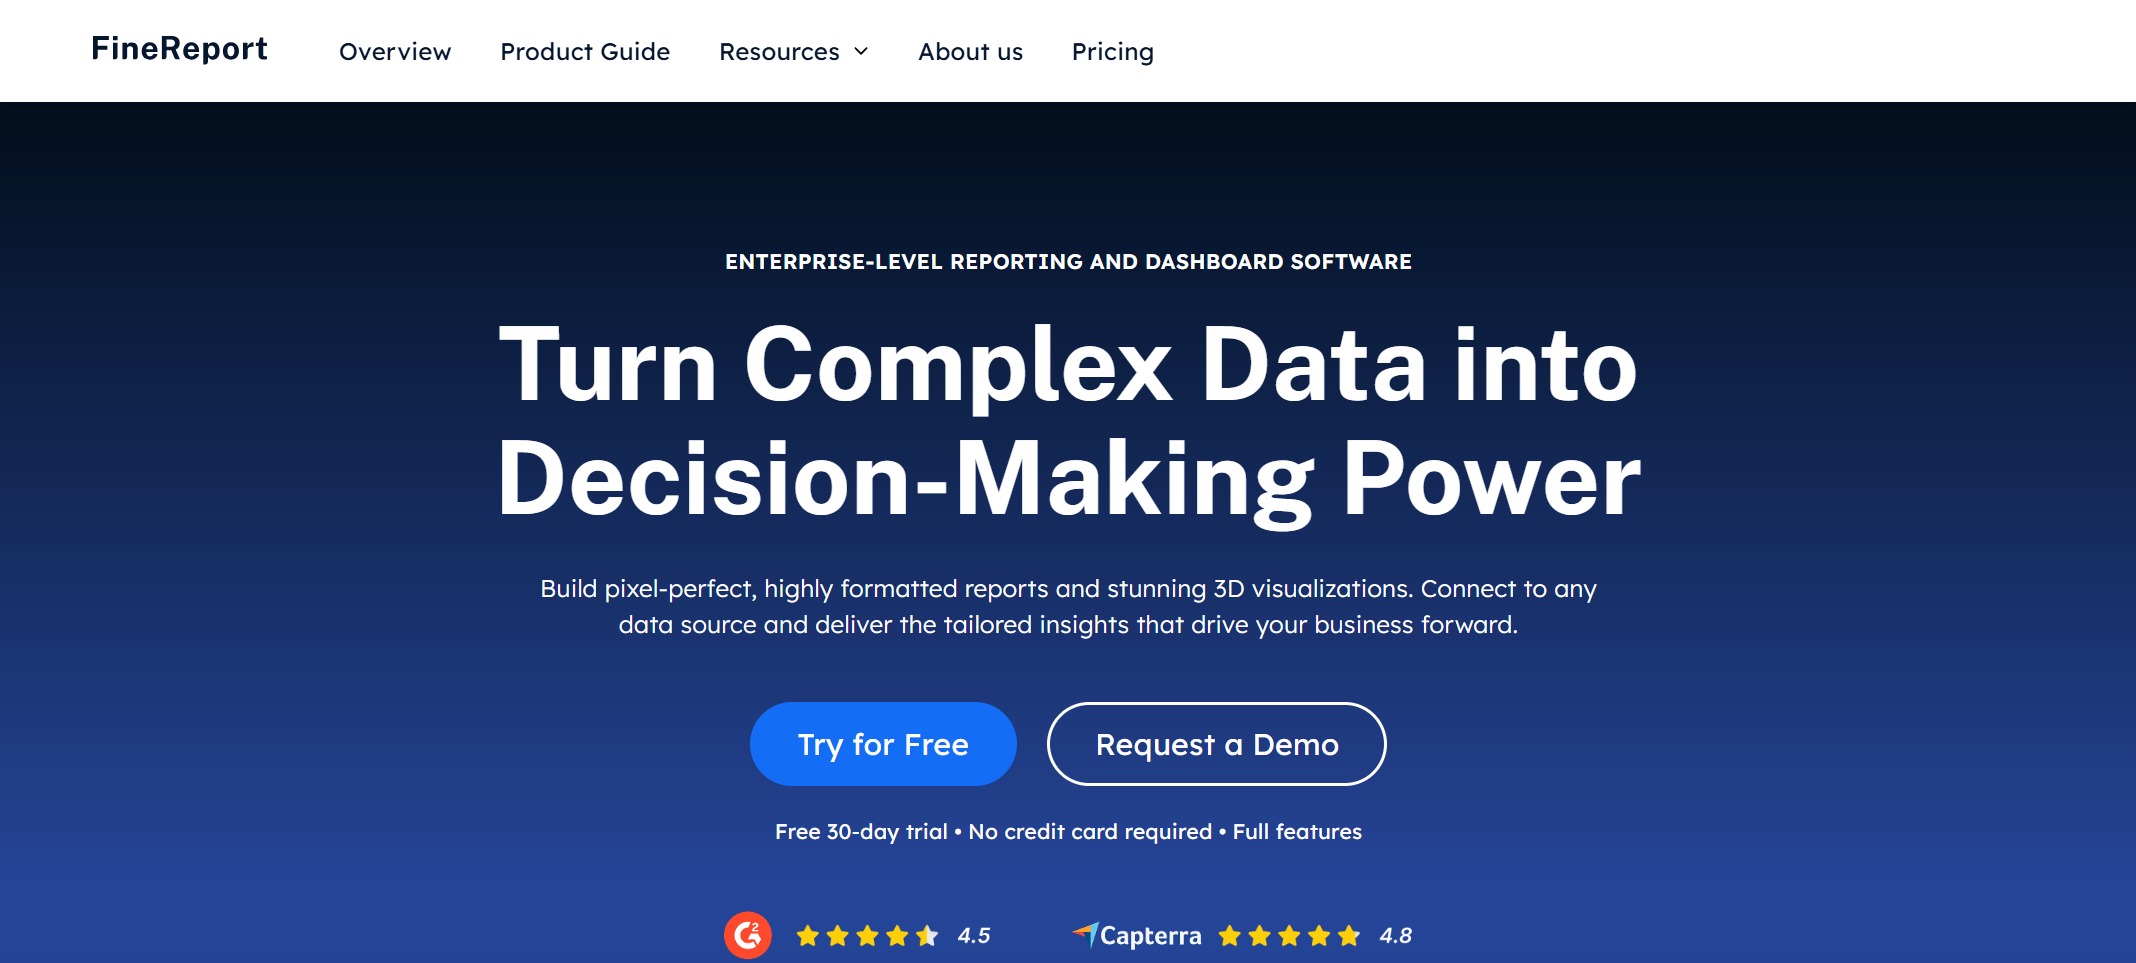
1.FineReport
FineReport is a reporting platform built for enterprises that need powerful reporting software. You can create customizable reports, automate report generation, and connect to almost any data source. FineReport goes beyond traditional Excel reports with advanced data import and custom reporting functions. You get automated reporting tools that save time and boost accuracy. The drag-and-drop designer makes building dashboards and reports easy, even if you’re not a tech expert.
Website: https://www.fanruan.com/en/finereport
FineReport stands out for its cost-effectiveness. You pay a one-time fee of $1.00, which is much lower than competitors that charge per report. This pricing makes it a smart choice for businesses that need frequent report automation. FineReport also focuses on funnel analysis and competitive intelligence, so you can track sales and market trends with real-time insights.

Tip: FineReport is perfect if you want to streamline operations, manage resources, and get detailed reports without breaking the bank.
Key Features:
- Customizable reports with pixel-perfect formatting
- Automated reporting tools for scheduled report delivery
- Real-time data integration from multiple sources
- Interactive dashboards and mobile access
- Advanced data visualization with 3D charts
Pricing: One-time fee of $1.00 per enterprise license
Unique Advantages:
- Cost-effective for frequent reporting
- Strong data import and integration capabilities
- Ideal for funnel analysis and competitive intelligence

2.Microsoft Power BI
Microsoft Power BI is one of the most popular reporting software tools. You can build custom dashboards, automate reports, and connect to many data sources. Power BI works well with other Microsoft products, so it’s a good fit if you already use Office or Azure.

Website: https://www.microsoft.com/en-us/power-platform/products/power-bi
Here’s a table showing what users like and dislike about Power BI:
| Advantages of Power BI | Disadvantages of Power BI |
|---|---|
| User-Friendly Interface | Cost |
| Works Well with Microsoft Tools | Takes Time to Learn |
| Real-Time Data Access | Limited Customization for Visuals |
| Frequent Updates | Requires Internet Access |
| Scalable for Different Needs | Can Be Slow with Large Datasets |
Power BI gives you automated reporting tools and real-time data access. You can share dashboards with your team and get instant feedback. Some users say it takes time to learn, especially if you want advanced features. You may need a paid subscription for full access.
Key Features:
- Custom dashboards and interactive dashboards
- Automated reporting tools and report automation
- Integration with Microsoft apps
- Real-time insights and data visualization
Pricing: Free version available; paid plans start at $10/user/month
Unique Advantages:
- Best for Windows and Azure users
- Frequent updates and scalable for different business sizes
3.Tableau
Tableau is a leader in data visualization and business intelligence. You can explore data interactively, create dashboards, and share reports with your team. Tableau lets you dig into data, spot patterns, and make decisions faster.

Website: https://www.tableau.com/
Tableau stands out because you can move away from static reports. You get interactive dashboards that help you see trends and ask new questions on the fly. Analysts love the flexibility and the ability to customize data views.
Key Features:
- Interactive dashboards and custom dashboards
- Advanced data visualization tools
- Real-time data exploration
- Easy sharing of reports
Pricing: Starts at $70/user/month
Unique Advantages:
- Flexible, on-demand data exploration
- Powerful visual analytics for complex data
4.Looker
Looker is a modern reporting software tool that focuses on business intelligence. You can define business logic centrally using LookML, which keeps your metrics consistent across all reports and dashboards. Looker connects directly to your database, so you get real-time data without extra steps.

Website: https://lookerstudio.google.com/navigation/reporting
| Feature | Description |
|---|---|
| LookML semantic layer | Defines business logic centrally, ensuring consistent metrics across all reports and dashboards. |
| Direct-to-database architecture | Provides real-time data access without requiring data extraction or loading. |
| Embedded analytics capabilities | Allows integration of interactive dashboards directly into applications and websites. |
Looker’s embedded analytics let you add dashboards to your own apps or websites. You get automated reporting tools and real-time insights, making it easy to share data across your organization.
Key Features:
- Centralized business logic for consistent reporting
- Real-time data access and report automation
- Embedded interactive dashboards
- Customizable reports
Pricing: Custom pricing based on usage and features
Unique Advantages:
- Direct-to-database architecture for instant updates
- Embedded analytics for seamless integration
5.Qlik Sense
Qlik Sense is a flexible reporting software tool that helps you create interactive dashboards and reports. You can connect to many data sources and use automated reporting tools to keep your data fresh. Qlik’s associative engine lets you explore data from different angles, so you never miss a trend.

Website: https://www.qlik.com/us/products/qlik-sense
Qlik Sense supports real-time insights and self-service analytics. You can build custom dashboards and share them with your team. The platform is scalable, so it works for small businesses and large enterprises.
Key Features:
- Interactive dashboards and custom dashboards
- Automated reporting tools and report automation
- Associative data engine for deep exploration
- Integration with many data sources
Pricing: Starts at $30/user/month
Unique Advantages:
- Flexible data exploration
- Scalable for any business size
6.Domo
Domo is a cloud-based reporting software tool that focuses on real-time data and automated reporting tools. You get interactive dashboards, automated alerts, and easy sharing. Domo’s pricing is based on credit consumption, which can make costs unpredictable as your usage grows.

Website: https://www.domo.com/
| Plan | Description | Considerations |
|---|---|---|
| Free Trial | Full access for 30 days with unlimited users | Basic support only, ends quickly |
| Paid Plans | All features, support, and custom add-ons | Credits can deplete quickly, no cost cap |
| Pricing Model | Pay-per-use based on credits | Difficult to predict monthly expenses |
| Average Cost | Ranges from $20K to $100K+ annually | Median cost is $46.5K based on 83 deals |
Domo is great for teams that need real-time data and automated reporting tools. You can scale up, but watch out for rising costs if your data needs grow quickly.
Key Features:
- Real-time data access and automated reporting tools
- Interactive dashboards and custom dashboards
- Automated alerts and sharing
- Integration with hundreds of data sources
Pricing: Pay-per-use, average annual cost varies
Unique Advantages:
- Real-time insights and alerts
- Scalable, but costs can rise with heavy usage
7.Zoho Analytics
Zoho Analytics is a reporting software tool that offers excellent data visualization and automated reporting tools. You get interactive dashboards, collaboration features, and an intelligent assistant called Zia. Zoho Analytics integrates with other business solutions like CRM and ERP.

Website: https://www.zoho.com/analytics/
Pros:
- Excellent data visualization tools
- Intelligent assistant for centralized data collection
- Collaboration features for sharing and annotating reports
- Wide range of visualization types
- Geo-visualizations for operational insights
- Advanced analytics for forecasting
- Scalable architecture
Cons:
- Customer support can be lacking
- Documentation is sometimes unclear
- Integration challenges for embedded use
- Data privacy concerns with cloud solutions
- Subscription costs can add up for large teams
- Missing robust accounting features
- Mobile app experience needs improvement
Zoho Analytics is great for businesses that want customizable reports and deep operational insights.
Key Features:
- Automated reporting tools and report automation
- Interactive dashboards and custom dashboards
- Integration with other business apps
- Advanced analytics and forecasting
Pricing: Starts at $24/month for two users
Unique Advantages:
- Intelligent assistant for easy data collection
- Collaboration and annotation features
8.Sisense
Sisense is a reporting software tool built for advanced analytics and automation. You can use natural language queries, forecasting, and anomaly detection to get real-time insights. Sisense supports Python and R, so data scientists can build custom models.

Website: https://www.sisense.com/
- Sisense offers natural language queries, so you can ask questions in plain English.
- Forecasting and anomaly detection help you spot trends and unusual patterns.
- Machine learning models predict future outcomes and alert you to changes.
- You can optimize operations and improve customer experiences with these insights.
Sisense is best for organizations with established analytics teams. Some advanced features may require extra setup or premium licenses.
Key Features:
- Automated reporting tools and report automation
- Interactive dashboards and custom dashboards
- Advanced analytics with machine learning
- Integration with Python and R
Pricing: Custom pricing based on features and usage
Unique Advantages:
- Powerful predictive analytics
- Flexible for data scientists and analysts
9.IBM Cognos Analytics
IBM Cognos Analytics is a reporting software tool designed for large organizations. You get self-service analytics, natural language querying, and enterprise-grade security. Cognos can handle high data volumes and complex queries, making it ideal for big companies.

Website: https://www.ibm.com/products/cognos-analytics
| Feature | Description |
|---|---|
| Natural Language Querying | Users can query data using everyday language, enhancing accessibility and data literacy across skill levels. |
| Integrated Data Preparation | Built-in tools allow users to clean and organize data efficiently, speeding up the process from raw data to insights. |
| Scalability for Enterprise Needs | Designed to manage high data volumes and complex queries, making it suitable for large organizations. |
| Advanced Security and Compliance | Backed by IBM’s security framework, ensuring compliance with regulations, crucial for industries handling sensitive data. |
Cognos offers flexible deployment options and advanced governance. You can automate reports, build interactive dashboards, and ensure compliance with industry standards.
Key Features:
- Automated reporting tools and report automation
- Interactive dashboards and custom dashboards
- Natural language AI for easy querying
- Enterprise-grade security and scalability
Pricing: Custom pricing for enterprise needs
Unique Advantages:
- Scalable for large organizations
- Advanced security and compliance features
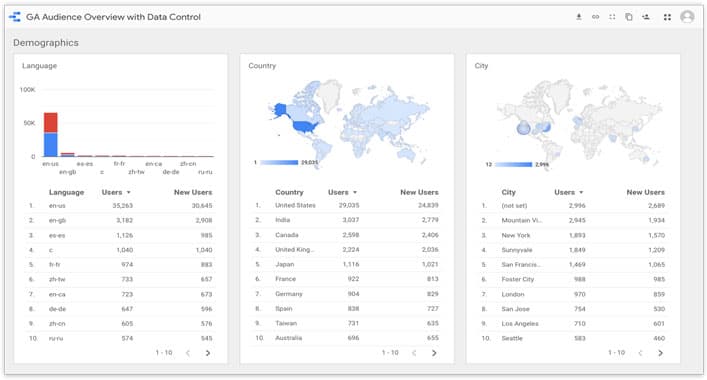
10.Google Data Studio
Google Data Studio (now called Looker Studio) is a free reporting software tool that makes it easy to create interactive dashboards and share reports. You get real-time data reporting, automatic data refreshes, and enhanced sharing capabilities.
| Feature | Description |
|---|---|
| Interactive Dashboards | Users can drill down into metrics, apply filters, and segment data, allowing for on-demand exploration of real-time data. |
| Automatic Data Refreshes | Reports can be set to refresh automatically at specified intervals, ensuring up-to-date visibility into key metrics. |
| Enhanced Sharing Capabilities | Dashboards can be shared with multiple users, enabling simultaneous access to real-time data for improved collaboration. |
Google Data Studio supports live connections to data sources, so you always see the latest numbers. You can share dashboards with your team and get feedback instantly. The platform is great for collaboration and democratizing data access.
Key Features:
- Automated reporting tools and report automation
- Interactive dashboards and custom dashboards
- Real-time data access and automatic refreshes
- Easy sharing and collaboration
Pricing: Free
Unique Advantages:
- Real-time insights for everyone
- Enhanced sharing and collaboration
Note: Each reporting software tool has its own strengths. Think about your team’s needs, budget, and the type of reports you want to create before making a decision.
Comparing Reporting Software Features
Usability and User Experience
When you pick a reporting platform, you want it to feel easy and familiar. FineReport gives you a drag-and-drop designer that works like Excel, so you can build dashboards and reports without much training. Power BI and Tableau also offer user-friendly interfaces, but you might need a little time to get comfortable with advanced features. Metabase stands out for making data queries simple for non-technical users. If you want quick results, automated reporting tools help you skip manual steps and get dashboards ready fast.

Tip: Look for reporting tools that let you create dashboards with just a few clicks. This saves you time and helps your team stay productive.
Integration and Connectivity
Connecting your reporting platform to other business apps is key. Most leading tools support open APIs, which means you can link them to popular services like Google Cloud, Salesforce, or Slack. Here’s a quick look at how integration flexibility compares:
| Reporting Tool | API Type | Integration Flexibility |
|---|---|---|
| FineReport | Open APIs | High |
| Power BI | Open APIs | High |
| Tableau | Open APIs | High |
| Looker | Open APIs | High |
| Others | Closed APIs | Low |
You get features like real-time data exploration, custom dashboards, and scalable architecture. Collaboration tools make it easy to share reports and insights with your team.
Pricing and Value
Pricing can vary a lot. FineReport offers a one-time enterprise license, which is cost-effective if you need frequent report automation. Power BI and Zoho Analytics use subscription models, so costs can add up as your team grows. Domo’s pay-per-use model works for flexible needs, but watch your usage to avoid surprises. Free tools like Google Data Studio give you solid dashboards and automated reporting tools without extra cost.
Note: Always check what’s included in each plan. Some features, like advanced intelligence or real-time insights, may require premium licenses.
Intelligence and Automation
Intelligence and automation set top reporting tools apart. Tableau automates data collection and refreshes dashboards on a schedule. Looker lets you explore real-time data and customize models. Power BI integrates with Microsoft services for easy report automation. Automated reporting tools deliver real-time insights, so you can act fast. Calliope Pro and Salesforce focus on customizable notifications and centralized data, making your reports smarter and more actionable.
Dashboards powered by intelligence help you spot trends, forecast outcomes, and share results instantly. You get more value from your data and make better decisions every day.
Choosing the Right Automated Reporting Tools
Assessing Team and Business Needs
You want automated reporting tools that fit your team’s goals. Start by asking what you need from your reports. Define your main objectives and pick key performance indicators. Figure out who will use the dashboards and who will read the results. Choose the data that matters most for your business. Make sure your dashboards are easy to understand. Ask your team for feedback so you can improve your reporting platform over time.
Here’s a quick checklist to help you get started:
- Set clear goals for report automation.
- Identify your users and audience.
- Select the right data for analysis.
- Pick visual formats that make insights easy.
- Get feedback from your team.
FineReport by FanRuan makes this process simple. You can customize dashboards for different users and business needs. The drag-and-drop designer helps you build reports quickly, even if you’re new to reporting tools.

Integration with Existing Systems
Automated reporting tools should connect smoothly with your current systems. You want to pull data from different sources and keep everything in one place. Integration helps you save time and avoid manual work. When your reporting platform links with HR, CRM, or ERP systems, you get centralized data management and automated workflows. This means you can track performance and compliance with less effort.
| Benefit | Description |
|---|---|
| Centralized Data Management | Accurate tracking and easy access to all your data. |
| Automated Workflows | Saves time by updating profiles and sending reminders automatically. |
| Enhanced Reporting | Lets you analyze everything in one place for better decisions. |
| Improved User Experience | Makes it easy for your team to use all tools from a single dashboard. |
FineReport stands out here. It connects to multiple data sources and supports remote design and publishing of report templates. You can create, distribute, and engage with dynamic dashboards across devices.
Scalability and Growth
Your automated reporting tools should grow with your business. Look for features like real-time data synchronization and customizable dashboards. You want a system that lets you add users and features easily. The best reporting tools keep performance steady, even as your data grows. They offer role-based access control, so you can manage who sees what.
- Real-time data sync keeps your insights fresh.
- Customizable dashboards fit different roles.
- Fixed pricing helps you plan costs.
- Easy expansion supports business agility.
FineReport delivers all these benefits. You get scalable dashboards, flexible user management, and reliable performance as your needs change.

Security and Compliance
Security matters when you choose automated reporting tools. You need to protect sensitive data and follow industry rules. Top vendors hold certifications like ISO/IEC 27001 and SOC 2. These show they meet strict standards for data protection and compliance.
FineReport offers strong security features. You control user permissions and keep your data safe. The platform supports secure access on PC, mobile, and large screens, so you can trust your dashboards wherever you use them.
| Feature Description | Explanation |
|---|---|
| Data integration from multiple sources | Resolves data silos for comprehensive reporting. |
| Excel-like design | Minimal learning curve for quick adoption. |
| Multi-terminal data presentation | Access dashboards on PC, mobile, and LED video walls. |
Tip: Choose automated reporting tools that match your team’s needs, connect with your systems, scale as you grow, and keep your data secure. FineReport checks all these boxes.
Real-World Success with Reporting Software

FanRuan FineReport Case Studies
You want to see how reporting tools work in real life. Let’s look at how companies use FineReport by FanRuan to solve problems and get results. When SAMOA, a top distributor for OPPO in Taiwan, expanded fast, they struggled with scattered data and slow reporting. By switching to FineReport, they built a unified system. Now, their team tracks sales, calculates bonuses, and reviews performance with just a few clicks. Reports update instantly, so managers always have real-time insights. SAMOA’s dashboards help leaders spot trends and make decisions quickly.
Bifido Foods, a company in Taiwan, also chose FineReport. They needed to connect data from different sales channels and product lines. FineReport’s flexible templates and easy integration made it simple. Their team now builds interactive reports and shares dashboards across departments. This change improved collaboration and made their data more accurate.

Here’s a quick look at the benefits companies get from FineReport:
| Key Benefit | Description |
|---|---|
| Enhanced Collaboration | Advanced data permissions and teamwork features for secure sharing. |
| Optimized for Large Datasets | Handles big data with fast, real-time analysis. |
| Dedicated Local Support | Responsive help tailored to your needs. |
| Robust Data Entry | Add, delete, or change data easily on any device, with built-in validation. |
Industry Examples and Outcomes
You might wonder how reporting tools help different industries. In sales and marketing, teams use dashboards to track goals and revenue. This helps you adjust strategies and hit targets. Customer service teams analyze data to understand what people want, so they can improve support. Finance departments rely on reports to check revenue, expenses, and profit margins. Project managers use dashboards to follow project status and milestones, making sure everything stays on track. HR teams monitor employee satisfaction and productivity, helping you build a stronger workforce.
| Industry/Application | Impact on Business Performance |
|---|---|
| Sales and Marketing | Tracks KPIs like sales goals and revenue, helping you refine strategies and meet targets. |
| Customer Data Analysis | Improves understanding of your audience and customizes messages for better service. |
| Financial Analysis | Gives clear insights into revenue, expenses, and profit margins for smarter decisions. |
| Project Management | Tracks project status and milestones, keeping projects on schedule. |
| Human Resources | Monitors employee satisfaction and productivity, supporting better workforce management. |
When you use reporting tools like FineReport, you get real-time insights that drive smarter decisions. You see trends, fix problems fast, and help your team work together. These tools turn data into action, making your business stronger every day.

Choosing the right tool helps you make smarter business decisions and stay ahead. When you use automated solutions, you boost efficiency and free up time for strategic work. You get clear kpi tracking, better business metrics, and more data-driven decisions.
- You see timely insights that help you act fast.
- Automation reduces errors and supports growth.
- Real-time monitoring keeps your team focused.
| Manual Process | Automated Benefit |
|---|---|
| Slow reviews | Faster, accurate results |
| Missed deadlines | Audit-ready reports |
Take time to review your needs and see how solutions like FineReport can help you grow.


FAQ

The Author
Lewis
Senior Data Analyst at FanRuan
Related Articles

10 Good Data Visualization Examples by Use Case: Sales, Surveys, Finance & Time-Series
If you are searching for $1 , you likely do not need another gallery of pretty charts. You need examples that help sales leaders hit targets, finance teams explain variance, operations managers monitor change, and analys
Yida Yin
Jun 15, 2026

12 Best Data Visualization Tools for 2026: Features, Pricing, Pros and Cons
$1 are software platforms that turn raw data into charts, dashboards, maps, and interactive visual stories for analysis and decision making. 12 best data visualization tools for 2026 at a glance
Lewis Chou
Apr 23, 2026

Top 8 Data Visualization softwares You Should Try in 2026
Compare the top 8 data visualization software for 2026, including FineReport, Tableau, Power BI, and more to find the best fit for your business needs.
Lewis
Mar 19, 2026