When you look for the best analytical tools for data analysis, you’ll see names like FineBI, Power BI, Tableau, Qlik Sense, SAS, Apache Spark, Looker, and Zoho Analytics. These analytical tools for data analysis shine because they offer self-service features, let you explore data without coding, and use AI to make data analysis faster. Many businesses now want self-service options so everyone can use data, not just IT teams. You need analytical tools for data analysis that connect with your data, scale as your business grows, and support real-time insights. Self-service, AI, and strong integration make these analytical tools for data analysis a smart choice for anyone who wants to get more from their data.
What Are Analytical Tools for Data Analysis
Definition and Purpose
When you hear about thebest analytical tools for data analysis this year, you might wonder what these tools actually do. Analytical tools for data analysis help you examine and interpret large sets of data. You use them to find patterns, trends, and insights that support better decisions. These tools range from simple spreadsheets to advanced platforms that use artificial intelligence and machine learning. Modern data analysis tools are not just about crunching numbers. They are predictive, intuitive, and even self-learning. This means you can use them to spot future trends, adapt to new data, and get answers faster than ever before.
The main purpose of these tools is to make your work with data easier and more effective. You can connect to different sources, clean up messy information, and turn raw data into clear visuals. With a good data analytics platform, you can explore your business intelligence without needing to write code or rely on IT for every question. This puts the power of data analysis in your hands, whether you work in sales, marketing, or operations.
Here’s a quick look at what these tools help you achieve:
Purpose
Description
Improve Work Efficiency
Analytical tools enhance efficiency by enabling quick analysis of large data sets, leading to better productivity.
Heightened Product or Service Quality
These tools help identify and resolve issues, gradually improving the quality of products and services.
Targeted Personalization
They allow organizations to create personalized products and services tailored to specific customer preferences.
Improved Decision Making
Data analytics provides insights that enable business leaders to make informed, logical decisions.
Why Analytical Tools Matter
You might ask, “Why do I needanalytical tools for data analysis?” The answer is simple. Data is everywhere, but making sense of it is not always easy. These tools help you turn raw data into something useful. You can spot trends, solve problems, and make choices that move your business forward.
Think about how companies like Amazon and Netflix use data analysis tools. Amazon’s recommendation engine suggests products based on your browsing and buying habits. Netflix studies what you watch to decide which shows to produce next. These examples show how data analysis tools can improve customer experience and drive business growth.
You can use data analysis to optimize your supply chain, reduce waste, and cut costs. If you run a service business, you might analyze customer feedback to improve your support team’s performance. The real value comes from making decisions based on facts, not guesses. When you use a strong data analytics platform, you get insights that help you stay ahead of the competition. Data-driven decisions lead to smarter strategies, whether you run a small startup or a large company.
When you search for the best analytical tools for data analysis this year, you will find a wide range of options. These data analytics tools help you collect, process, and visualize data so you can make better decisions. The best analytical tools for data analysis this year combine self-service features, strong integration, and advanced analytics. You can use thesebusiness intelligence tools to connect to different data sources, create dashboards, and share insights across your organization. In this section, you will learn about the top data analytics tools and what makes each one stand out.
FineBI stands out among business intelligence tools and data analytics software. You can use FineBI to connect to many data sources, prepare your data, and build dashboards without writing code. This platform focuses on self-service analytics, so you do not need technical skills to explore your data. FineBI supports real-time analytics, which means you always see the latest information. You can access your dashboards on any device, thanks to its mobile app support. FineBI also offers enterprise-grade security, including role-based access control and audit logging.
Here is a quick look at what makes FineBI a top choice among data analytics tools:
Feature/Strength
Description
No-Code Approach
Lets you create complex data visualizations without technical expertise.
Real-Time Analytics
Gives you immediate data processing and updates for faster decisions.
Integrated ETL Tools
Helps you prepare and clean data within the platform.
Robust Data Modeling
Supports complex data structures for deeper analysis.
Mobile App Support
Allows you to access insights anytime, anywhere.
Elastic Cloud Deployment
Scales easily as your business grows.
In-Memory Computing Engine
Delivers fast response times, even with large data volumes.
Enterprise-Grade Security Features
Includes role-based access, row-level security, and audit logging.
You can see why many organizations choose FineBIas their main data analytics software. It combines ease of use with powerful features, making it a strong option for both small teams and large enterprises.
Power BI is one of the most popular business intelligence tools from Microsoft. You can use Power BI to connect to a wide range of data sources and create interactive reports. It is affordable and integrates well with other Microsoft products. Power BI has a large user community, so you can find plenty of resources and support. However, it focuses mainly on Windows environments and may not support NoSQL databases natively. Advanced calculations in Power BI use DAX, which can be complex for new users.
Advantages
Limitations
Affordable
Weak NoSQL support
Microsoft integration
Premium AI pricing
Large user community
Windows-focused
No native NoSQL connectivity
Complex DAX for advanced calculations
Limited Mac compatibility
If you already use Microsoft products, Power BI can fit smoothly into your workflow.
Tableau is a leader in data analytics tools and business intelligence tools. You can use Tableau to create stunning visualizations and dashboards. It is known for its drag-and-drop interface, which makes it easy to use. Tableau continues to innovate, adding features like integration with Google Workspace and dynamic spatial parameters. You can recover deleted workbooks with the new recycle bin feature. Tableau also improves query performance with logical table data source filters.
Feature
Description
Tableau App for Google Workspace
Integrates Tableau metrics and dashboards into Google Slides and Docs.
Dynamic Spatial Parameters
Enhances keyboard accessibility for data interaction.
Logical Table Data Source Filter
Improves query performance by filtering rows in related tables.
Recycle Bin
Lets you recover deleted workbooks, datasources, or projects within 30 days.
Tableau is a great choice if you want advanced visualization and easy sharing of insights.
Qlik Sense is another top data analytics software that focuses on self-service analytics. You can explore your data using its unique associative engine, which helps you see connections that other tools might miss. Qlik Sense delivers high performance without needing IT support. It works well in cloud environments and is popular in industries like finance and pharmaceuticals.
Feature
Qlik Sense
Other Analytics Tools
Data Exploration
Uses Associative Engine for complex views
Often requires advanced query languages
Performance
High-performance analysis without IT support
Varies, often needs IT involvement
Cloud Compatibility
Cloud-agnostic, supports various platforms
May be limited to specific cloud environments
Ecosystem Integration
Part of a broader data management ecosystem
Typically standalone or less integrated
Target Industries
Popular in finance and pharmaceutical research
Varies by tool, may not cater to specific fields
Qlik Sense is a good fit if you want flexible data exploration and strong performance.
SAS Analytics is a long-standing leader in business intelligence tools. You can use SAS for advanced analytics, including marketing analytics, customer intelligence, and risk management. SAS Analytics is widely used in industries like retail, banking, healthcare, and manufacturing.
Use Case
Industry
Marketing Analytics
Retail
Customer Intelligence
Banking
Risk Management
Healthcare
Operational Efficiency
Manufacturing
SAS Analytics helps you solve complex problems and gain deep insights from your data.
Apache Spark is a powerful open-source platform for big data analytics. You can use Spark for lightning-fast data processing, thanks to its in-memory computing. Spark supports multiple programming languages, including Scala, Python, Java, and R. It provides a unified platform for batch processing, streaming, SQL queries, machine learning, and graph processing. Spark scales easily from a single machine to thousands of nodes.
Feature
Description
Lightning-Fast Processing
In-memory data processing delivers speeds up to 100x faster than disk-based systems.
Multi-Language Support
Native support for Scala, Python, Java, and R with identical APIs.
Unified Platform
Single framework for batch, streaming, SQL, machine learning, and graph processing.
Fault Tolerance
Automatic recovery through RDD lineage tracking.
Dynamic Scalability
Scales from single machines to thousands of nodes.
Apache Spark is ideal if you need to process large volumes of data quickly.
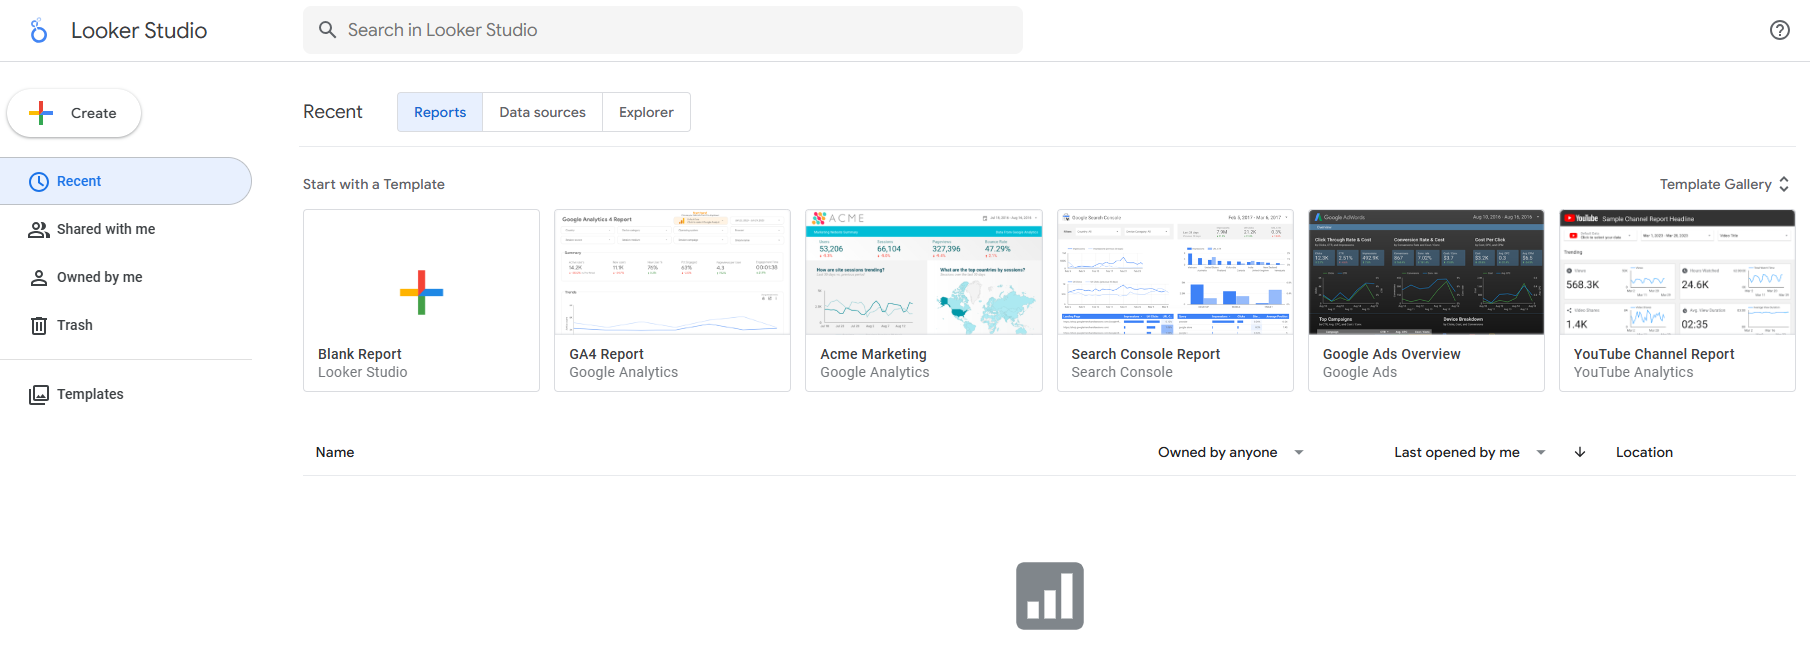
Looker is a modern data analytics tool that focuses on data modeling and integration. You can connect Looker to major cloud data warehouses and traditional databases. It supports Amazon Redshift, Google BigQuery, Snowflake, and more. Looker also works with SQL-on-Hadoop technologies like Apache Spark and PrestoDB.
Category
Supported Data Sources
Major Cloud Data Warehouses
Amazon Redshift, Google BigQuery, Snowflake, Microsoft Azure Synapse Analytics, Amazon Athena, Databricks
Traditional and Cloud Relational Databases
PostgreSQL, Microsoft SQL Server, MySQL, Amazon Aurora, Google Cloud SQL, Oracle, MariaDB
Other SQL-on-Hadoop Technologies
Apache Spark, PrestoDB, Trino, Dremio, SQL on Apache Hive
Looker is a strong choice if you want flexible integration with many data sources.
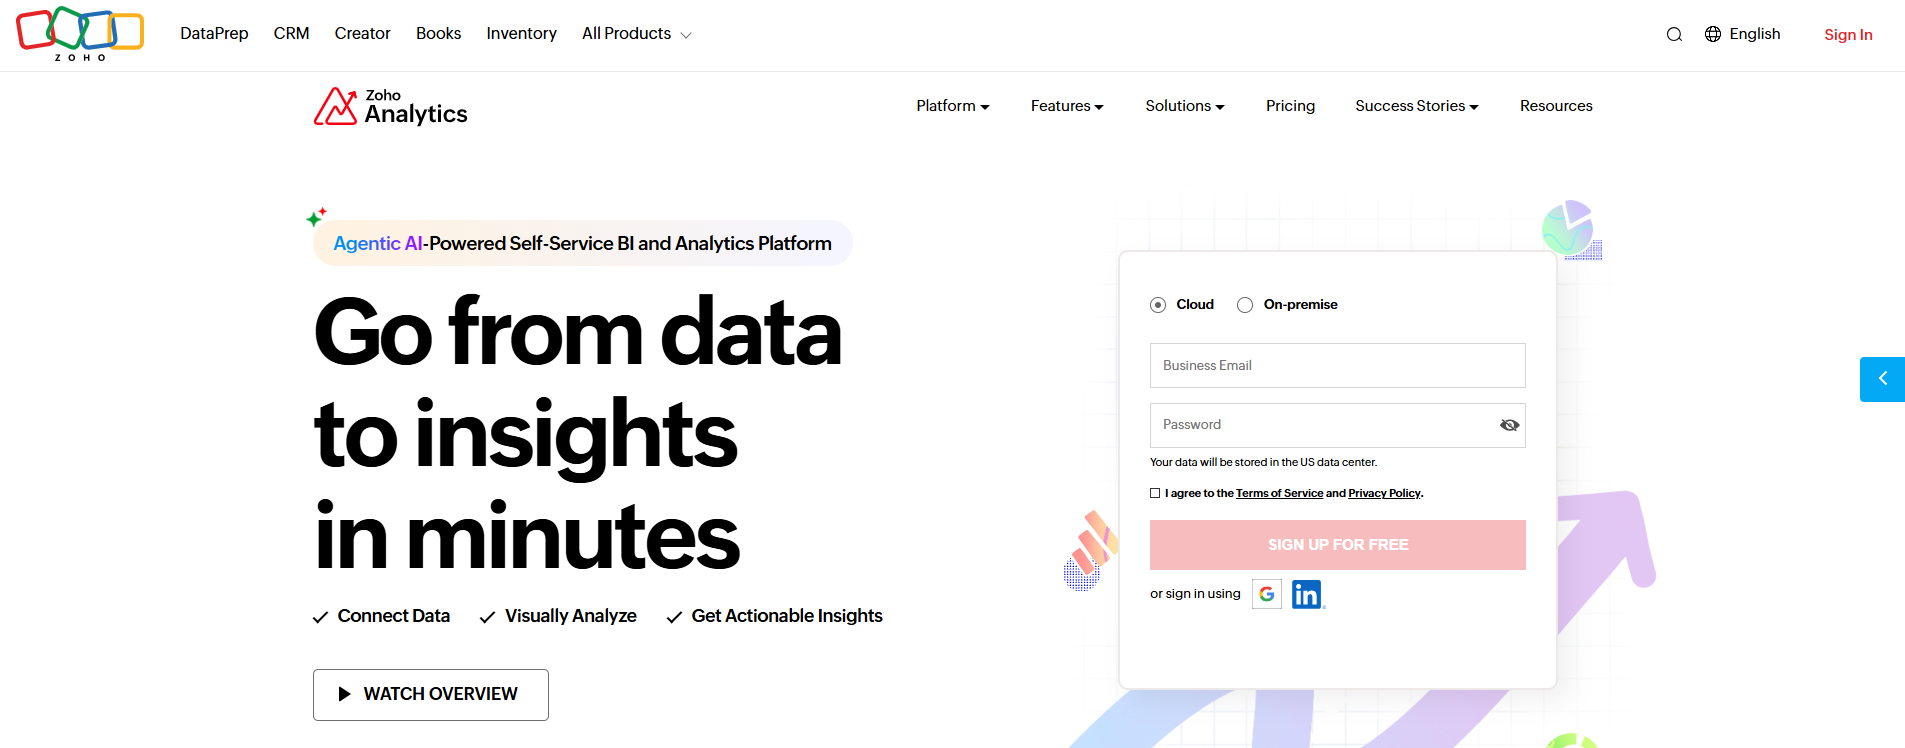
Zoho Analytics is a cloud-based business intelligence tool that offers flexible pricing and deployment options. You can choose from standard, premium, and enterprise plans, or use the always-free version for basic needs. Zoho Analytics supports a range of features and user limits, making it suitable for businesses of all sizes.
Plan Type
Features
Users
Rows
Standard
Basic features
Up to X
Y rows
Premium
Advanced features
Up to A
B rows
Enterprise
All features
Up to C
D rows
Always Free
Limited features
1 user
1000 rows
Zoho Analytics is a good option if you want an affordable and scalable data analytics tool.
You have many choices when it comes to business intelligence tools and data analytics tools. Each tool offers unique features, so you can pick the one that matches your business needs. FineBIstands out for its no-code approach, real-time analytics, and strong security. Power BI and Tableau are popular for their integration and visualization capabilities. Qlik Sense and Looker offer flexible data exploration and integration. SAS Analytics, Apache Spark, provide advanced analytics and automation. Zoho Analytics gives you affordable options for growing businesses. When you choose the best analytical tools for data analysis this year, you set your team up for smarter, faster decisions.
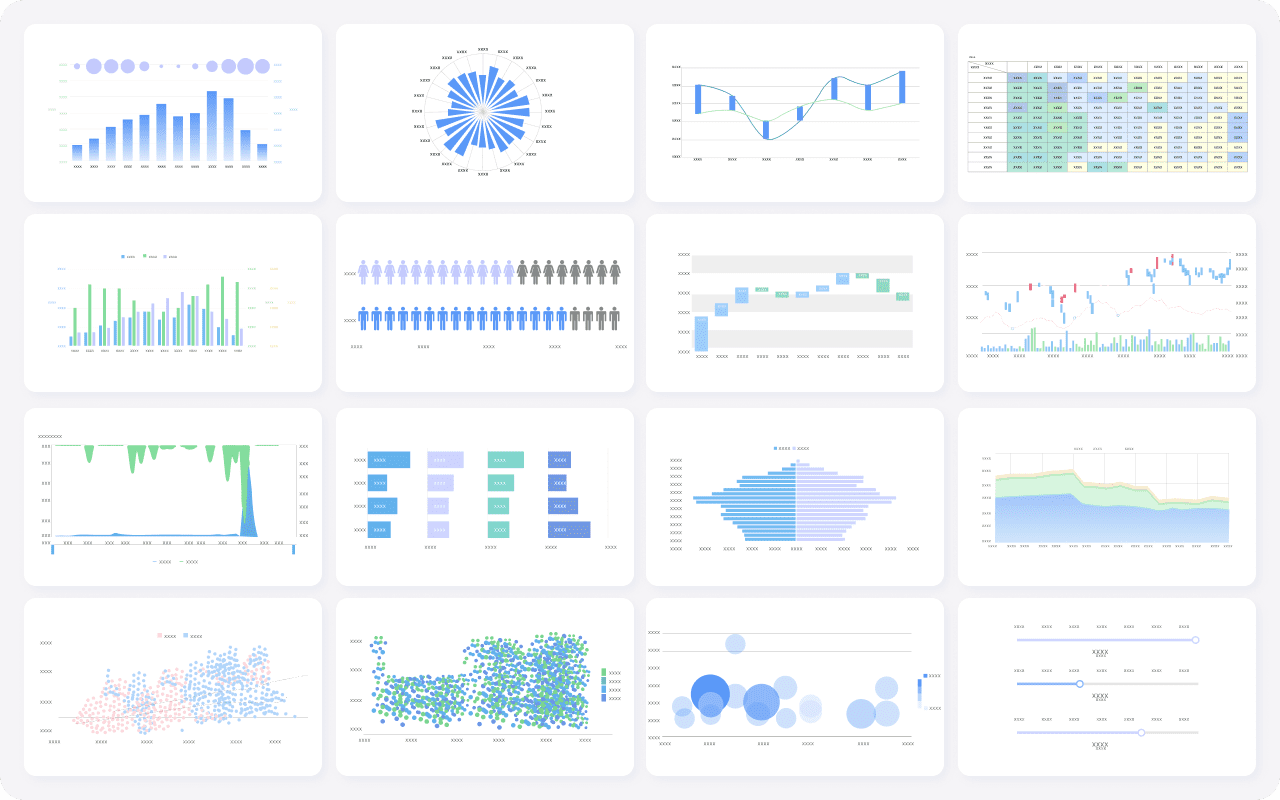
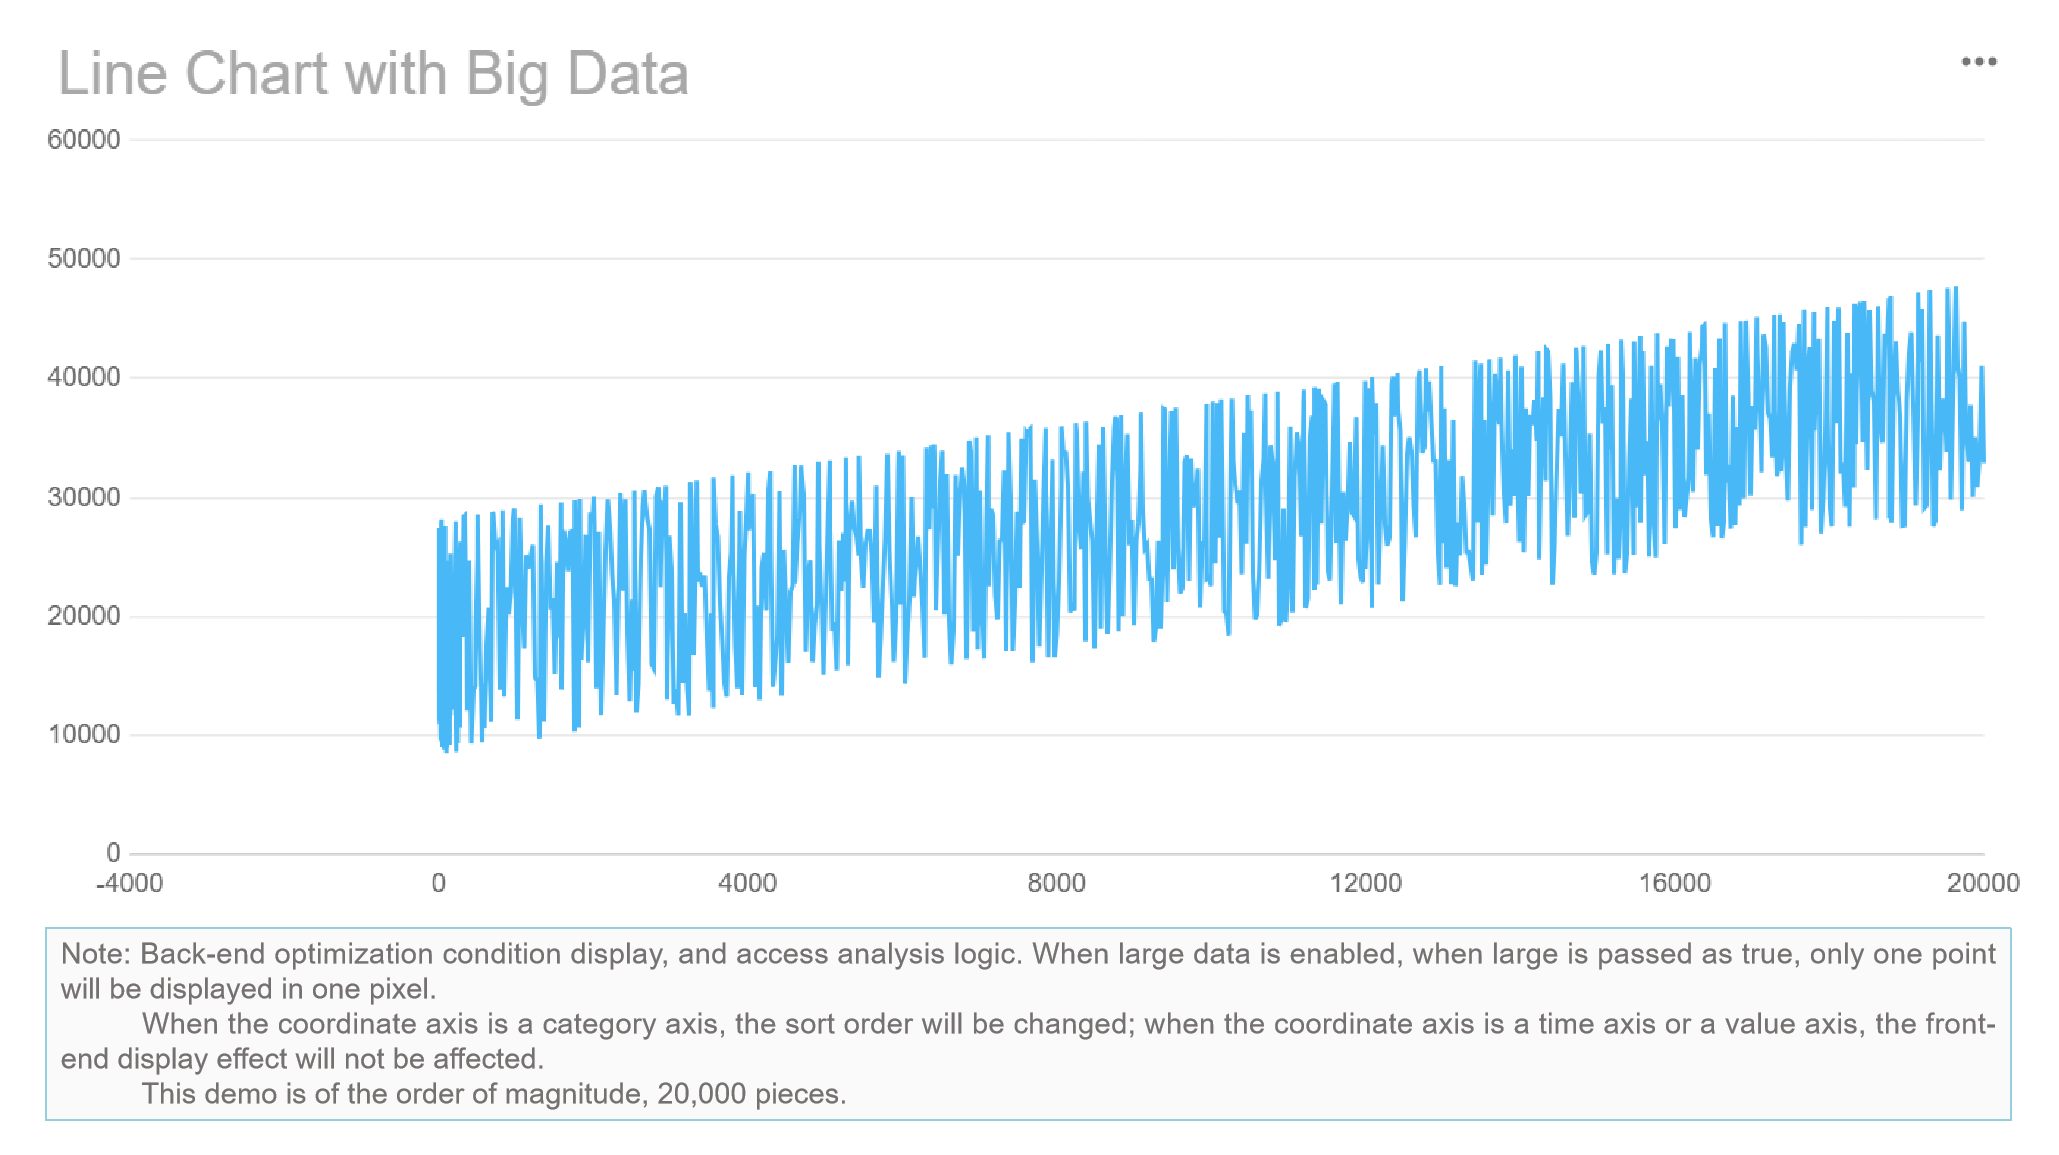
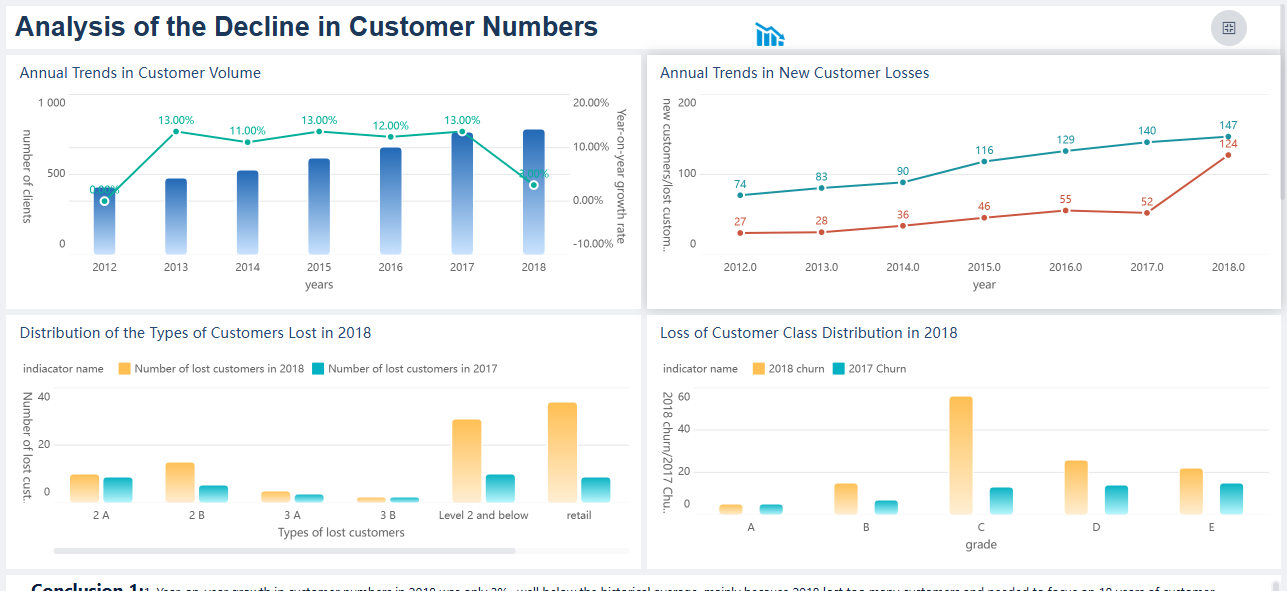
FineBI's Rich Built-in Charts For Data Visualization
Features and Pros of Analytical Tools for Data Analysis
When you explore the Best Analytical Toolsfor Data Analysis This Year, you want to know what sets these platforms apart. These tools help you connect, process, and visualize data, making your work easier and more effective. The Best Analytical Tools for Data Analysis This Year focus on giving you fast access to insights, strong security, and the ability to scale as your needs grow. Let’s break down the features that matter most.
Data Integration and Connectivity
You need a data analysis tool that connects to all your data sources. Top platforms offer no-code interfaces, so you can set up connections without technical skills. Many tools provide pre-built connectors for databases, cloud apps, and APIs. You get automation for data updates and flexible ETL or ELT support for transforming data. Security and compliance features protect your sensitive information. For example, FineBIlets you connect to over 60 data sources, including big data platforms and cloud warehouses, all through a simple workflow.
No-code setup for easy data integration
Pre-built connectors for popular databases and cloud services
Automated data updates and flexible transformation options
Data visualisation is where you see the real power of these tools. You can drag and drop to build dashboards, use interactive charts, and get real-time updates. Many platforms now include AI data analysis features, so you spot trends and outliers quickly. FineBI, for example, gives you over 60 chart types and lets you create dashboards that work on any device. Here’s how top tools compare:
Feature
Description
AI Agents
Conversational answers and analysis
Analyst Studio
Connects to cloud data and prepares it for advanced analytics
AI-Augmented Dashboards
Real-time, interactive insights with pattern and anomaly detection
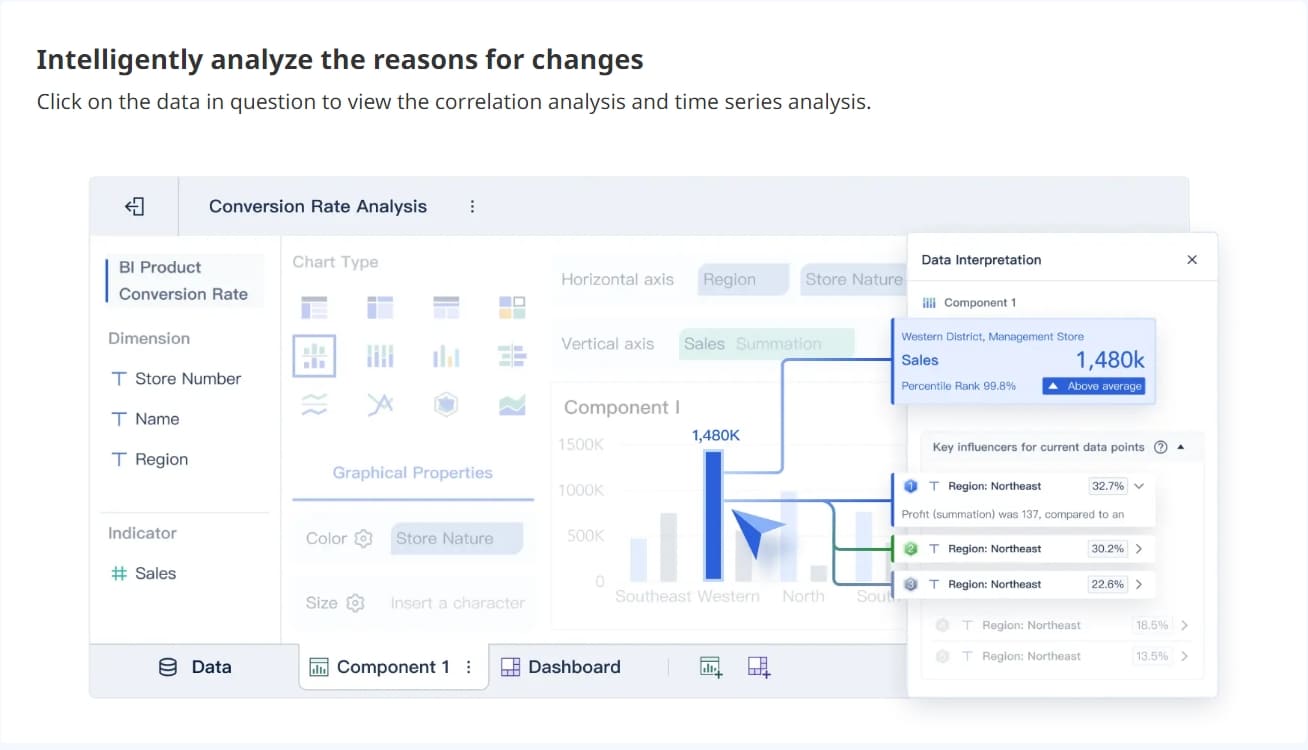
AI data analysis is changing how you work with data. You can ask questions in plain language, get instant answers, and use predictive analytics to forecast trends. Tools like FineBIand DataRobot use AI-powered insights to help you make smarter decisions. You don’t need to be a data scientist to use these features. AI data analysis helps you find patterns, predict outcomes, and automate routine tasks. This makes advanced analytics available to everyone.
Scalability and Performance
As your data grows, you need a platform that keeps up. The Best Analytical Tools for Data Analysis This Year deliver fast processing, high throughput, and reliable performance. FineBI, for example, supports over 10,000 users and handles massive datasets with its in-memory engine. Here’s what you should look for:
Security is a top priority. You want your data protected and your analytics platform to meet industry standards. Leading tools offer role-based access, audit logs, and compliance with certifications like DAMA CDMP, DGSP, and ISO/IEC 38505. FineBIprovides enterprise-grade security, including row-level permissions and audit trails, so you control who sees what.
Role-based access and data masking
Audit logging for user activity
Compliance with top data governance certifications
With these features, you can trust your data analysis is secure, scalable, and ready for the future.
Use Cases for Analytical Tools for Data Analysis
Business Intelligence
You use theBest Analytical Tools for Data AnalysisThis Year to make business intelligence accessible to everyone in your company. These tools help you turn raw data into clear charts and dashboards. You can spot trends, monitor performance, and share insights with your team. With business intelligence, you get a unified view of your operations, which supports faster and more accurate business decisions. You can also use data mining and statistical analysis to uncover hidden patterns that drive data-driven decision-making.
Create dashboards for real-time performance monitoring
Integrate data from multiple sources for unified reporting
Use artificial intelligence to automate pattern recognition
Predictive Analytics
The Best Analytical Tools for Data Analysis This Year let you move beyond looking at the past. You can use predictive analytics to forecast what might happen next. FineBIand other leading platforms make this easy with features like real-time data processing and automated reporting. Here’s a quick comparison:
Feature
FineBI
Power BI
Real-Time Data Processing
Yes
Yes
Automated Reporting
Yes
Yes
Advanced Visualization
Yes
Yes
User-Friendly Interface
Drag-and-Drop
Interactive Dashboards
Scalability
Enterprise-level Security
Connects 500+ sources
With predictive analytics, you can make smarter business decisions and support data-driven decision-making across your organization.
You want to react quickly to changes. The Best Analytical Tools for Data Analysis This Year give youreal-time data analysis so you can make decisions on the spot. You see market trends as they happen and catch issues before they grow. Real-time data analysis helps you stay competitive and supports data-driven decisions. Some challenges include choosing the right tools and managing collaboration, but the benefits—like faster decision-making and instant trend identification—make it worth the effort.
You can apply the Best Analytical Tools for Data Analysis This Year in almost any industry. For example, Fitbit uses data analytics to help users make better lifestyle choices. Dominos analyzes customer behavior to boost revenue and cut ad spending. Bayer Crop Science uses edge analytics for real-time anomaly detection in agriculture. Lufthansa increased efficiency by 30% with self-service reporting. FineBIhelped BOE, a global leader in IoT and displays, reduce inventory costs by 5% and boost operational efficiency by 50%. These examples show how data analysis and exploratory data analysis drive data-driven decision-making and improve business decisions in real-world settings.
How to Choose the Right Analytical Tools for Data Analysis
When you look for theBest Analytical Tools for Data Analysis This Year, you want a solution that fits your business goals and helps you make sense of your data. These tools let you connect, analyze, and visualize data from many sources. The right choice gives you the power to turn raw information into insights that drive your business forward.
The Best Analytical Tools for Data Analysis This Year offer features like self-service dashboards, strong integration, and security. You need to match these features to your needs. Here’s how you can pick the right tool for your organization.
Assessing Business Needs
Start by thinking about what your business wants to achieve with data. Ask yourself:
Does the tool align with your company’s goals and mission?
Will it support your IT requirements, like technology compatibility and flexibility?
Are you building new infrastructure or adding to existing systems?
Do you need to meet strict security and compliance standards?
Who will use the tool—data analysts, scientists, or non-technical staff?
If you have specific needs, look for a tool that integrates easily. If you’re just starting, you have more freedom to explore options.
Integration and Compatibility
You want a tool that works well with your current systems. Check for:
Compatibility with CRM, ERP, and other business platforms
Support for different data formats for easy import and export
Integration with databases and enterprise apps, including API support
FineBI, for example, connects to over 60 data sources and offers flexible integration, making it a strong choice for businesses with complex environments.
Your data will grow as your business expands. Choose a tool that can keep up. Look for:
Feature
Description
User Interface
Easy for non-technical users to access and analyze data
Advanced Analytics
Finds patterns and predicts future outcomes
Integration
Combines data from many sources into one dashboard
Customization
Lets you tailor the tool to your needs
Flexibility/Scalability
Adapts to your business as it grows
Security Features
Protects sensitive data as your organization expands
A scalable tool like FineBIsupports thousands of users and large data sets.
User Experience and Support
Pick a tool that feels easy to use. You want clear workflows, drag-and-drop features, and helpful support. A good user experience means your team can focus on analyzing data, not learning complicated software.
Tip: Try a demo or free trial to see how the tool fits your workflow.
Security and Compliance
Protecting your data is critical. Look for features like:
Feature
Description
Change, access, and configuration auditing
Tracks who accesses and changes data for accountability
Reporting
Helps with compliance and audit documentation
Log aggregation
Centralizes logs for monitoring and analysis
Data classification
Organizes data by sensitivity and compliance needs
Security risk assessment
Identifies and manages potential risks
Automated auditing and reporting make compliance easier. Tools like FineBIoffer robust security controls and help you meet regulations like GDPR and HIPAA.
Choosing the Best Analytical Tools for Data Analysis This Year means finding a solution that matches your business needs, integrates with your systems, scales as you grow, feels easy to use, and keeps your data safe.
You have seen how the top analytical tools for data analysis help you unlock the power of data. FineBIstands out with its self-service features and strong security. You can match each tool’s strengths to your business needs. Try a demo or explore product documentation to see which platform fits best. If you want expert advice, reach out for support. The right data analytics tool will help you make smarter decisions and get more value from your data every day.
Continue Reading About Analytical Tools for Data Analysis
Access a wealth of case studies, industry insights, and solution guides to accelerate digital transformation.
FAQ
What does Best Analytical Tools for Data Analysis This Year mean?
You want tools that help you collect, process, and understand your data quickly. The Best Analytical Tools for Data Analysis This Year give you features like self-service dashboards, AI insights, and strong security. These tools help you make smarter decisions every day.
How do I pick the Best Analytical Tools for Data Analysis This Year for my business?
Start by listing your business needs. Check if the tool connects to your data sources. Make sure it scales as your business grows. Try a demo or free trial to see if it fits your workflow.
Can I use the Best Analytical Tools for Data Analysis This Year without coding skills?
Yes, you can. Most of the Best Analytical Tools for Data Analysis This Year offer drag-and-drop dashboards and self-service features. You do not need to write code or rely on IT for every report.
Are the Best Analytical Tools for Data Analysis This Year secure?
You get strong security with these tools. They offer role-based access, audit logs, and compliance with industry standards. You control who can see and use your data.
Do the Best Analytical Tools for Data Analysis This Year support real-time data?
Yes, many of these tools support real-time data analysis. You can see updates instantly and react to changes as they happen. This helps you stay ahead in your business.