A weekly marketing report sample is not just a status update—it is a decision tool for enterprise teams managing multiple channels, regions, campaigns, and revenue goals at once. For CMOs, marketing operations leaders, regional directors, and demand generation managers, the challenge is rarely access to data. The real problem is turning fragmented performance data into a weekly view that is consistent, credible, and actionable. A strong weekly marketing report helps leadership spot risks early, shift budget faster, align sales and marketing priorities, and keep teams accountable for pipeline impact.
All reports in this article are built with FineReport
What a Weekly Marketing Report Sample Should Include for Enterprise Teams
In an enterprise environment, weekly reporting must serve more than one audience. Executives need a fast read on performance, risks, and business impact. Marketing leaders need enough detail to adjust campaigns and resources. Operations teams need a structure that ensures every number is traceable and repeatable. That is why the best weekly marketing report sample balances summary-level clarity with drill-down support.
At a minimum, the report should clearly define three things:
Purpose: Is the report used for executive review, campaign optimization, sales alignment, or all three?
Audience: Does it serve the CMO, regional marketing heads, business unit leaders, or revenue operations?
Decision-making role: What actions should this report trigger each week?
Without those definitions, weekly reporting becomes noise. Teams end up exporting dozens of metrics that do not support an actual decision.
Enterprise teams should also establish reporting cadence and data ownership upfront. Weekly reports often pull from CRM platforms, ad platforms, web analytics, email systems, event tools, and partner data sources. If ownership is unclear, metrics will drift, deadlines will slip, and leadership will lose trust in the report.
Core elements every enterprise weekly report should define
Reporting window: The exact weekly period being measured.
Data cut-off time: The deadline for data refresh and validation.
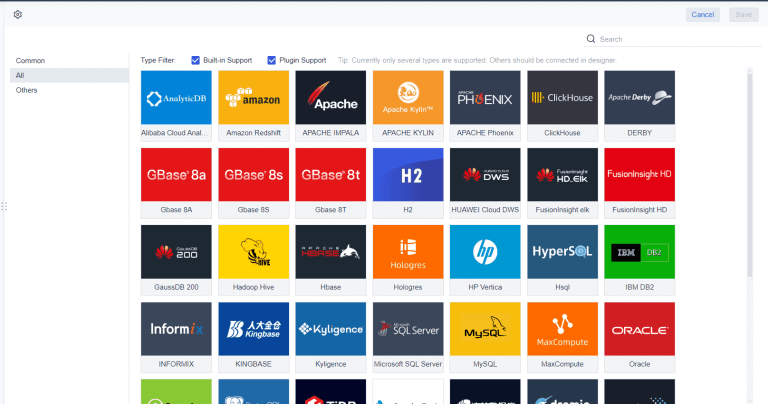
Primary data sources: CRM, ad platforms, marketing automation, analytics, and finance systems.
Metric definitions: Standard definitions for leads, MQLs, sourced pipeline, influenced revenue, and conversion rates.
Regional or business unit mapping: A shared structure so roll-ups are accurate.
Report owner: The person or team accountable for publishing and validating the report.
Action expectation: The decisions, escalations, or approvals expected after review.
Consistency matters as much as speed. If one region defines pipeline contribution differently from another, the weekly report becomes politically contested instead of operationally useful. Accuracy, standardization, and actionability should be treated as non-negotiable.
Core KPIs to Track Each Week
A useful weekly marketing report sample focuses on the KPIs that matter most to enterprise decision-makers. The goal is not to show everything. The goal is to show enough to evaluate business impact, diagnose performance changes, and decide what to do next.
Key Metrics (KPIs)
Sourced pipeline: The total pipeline value created directly by marketing efforts during the week.
Influenced revenue: Revenue associated with opportunities touched by marketing across the buyer journey.
Lead volume: The number of new leads generated across all tracked channels.
Lead-to-MQL rate: The percentage of leads that meet marketing qualification criteria.
MQL-to-SQL rate: The rate at which qualified marketing leads are accepted or progressed by sales.
Opportunity conversion rate: The share of qualified leads that become pipeline opportunities.
Cost per lead (CPL): Total channel or campaign spend divided by lead volume.
Cost per opportunity: Total spend divided by created opportunities.
Return on ad spend (ROAS): Revenue or pipeline generated for each unit of paid media spend.
Email engagement rate: Combined view of opens, clicks, and downstream response quality where relevant.
Website conversion rate: The percentage of site visitors completing target actions such as form fills or demo requests.
Sales handoff speed: Time from marketing qualification to sales engagement.
Follow-up timing: Speed of first sales or SDR action after lead assignment.
Budget pacing: Current spend versus plan, by channel or region.
Attribution coverage: The percentage of performance that can be confidently attributed to tracked touchpoints.
At the executive level, marketing performance must connect to revenue outcomes. Weekly reporting should summarize how marketing is contributing to pipeline creation, opportunity progression, and revenue influence—not just top-of-funnel activity.
Start with the three numbers leadership cares about most:
Sourced pipeline this week
Influenced revenue this week
Conversion performance across key funnel stages
These metrics should always be compared against both:
Weekly targets
Period-to-date benchmarks such as month-to-date or quarter-to-date performance
This dual comparison matters because a strong week may still leave the business behind plan, while a weak week may be acceptable if the period is already ahead.
Useful executive framing includes:
Whether pipeline creation is accelerating or slowing
Which segments are driving the majority of impact
Whether conversion rates support future revenue confidence
Whether shortfalls are due to volume, quality, or sales progression issues
Channel and campaign performance
Once the revenue view is established, the next layer is channel efficiency. Enterprise teams typically manage a mix of paid media, organic search, email, webinars, events, partner programs, ABM plays, and regional campaigns. The report should make it easy to see which channels are producing efficient pipeline and which are consuming budget without sufficient return.
Weekly channel review should include:
Spend
Lead volume
Qualified leads
Opportunities created
Pipeline or revenue contribution
Efficiency metrics such as CPL, cost per opportunity, or ROAS
This section becomes even more valuable when segmented by region, business unit, or audience. A campaign that underperforms globally may still be highly effective in a specific market. That is why enterprise reporting should support both roll-up and drill-down analysis.
Funnel health and operational metrics
Strong top-line numbers can hide process issues. A weekly marketing report sample should include funnel health metrics that reveal whether demand generation and sales follow-through are functioning properly.
Key operational checks include:
Lead volume trends
Qualification rates by source or region
Sales handoff speed
Follow-up timing
Lead aging
Rejected or recycled lead rates
Attribution or tracking anomalies
These indicators help separate a campaign problem from an operational problem. For example, declining opportunity creation may not reflect weak lead quality. It may signal delayed follow-up by SDR teams or routing issues in the CRM.
Operational commentary should also flag data issues that may affect interpretation, such as:
Tracking tags missing on a major paid campaign
Delayed CRM sync from a regional business unit
Event leads not yet deduplicated
Attribution model changes affecting week-over-week comparison
That context protects decision quality and prevents overreaction to incomplete data.
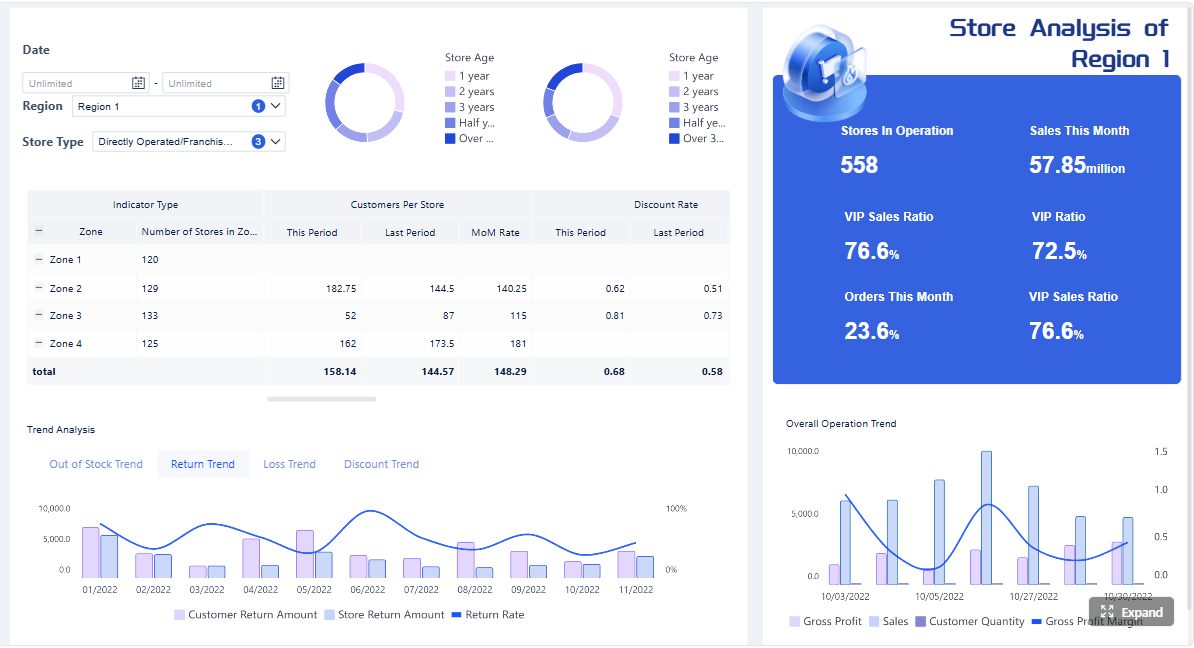
Recommended Dashboard Layout for Executive Review
A weekly report should be designed for speed. Enterprise executives do not need to hunt for answers across multiple tabs or dashboards. The layout should follow a simple logic: first show the headline outcome, then explain the performance drivers, then document the actions required.
The top of the report should answer the executive question: What happened this week, and does it matter?
This section should include:
Headline KPIs
Week-over-week changes
Performance versus target
One to three major takeaways
A strong top summary often uses KPI cards, trend arrows, and short narrative callouts. The reader should understand the weekly story in less than a minute.
Effective top-summary content may include:
Pipeline sourced was 12% above weekly target
Paid search efficiency improved after budget reallocation
EMEA lead volume dropped due to event timing shift
Follow-up SLA missed in one business unit, creating conversion risk
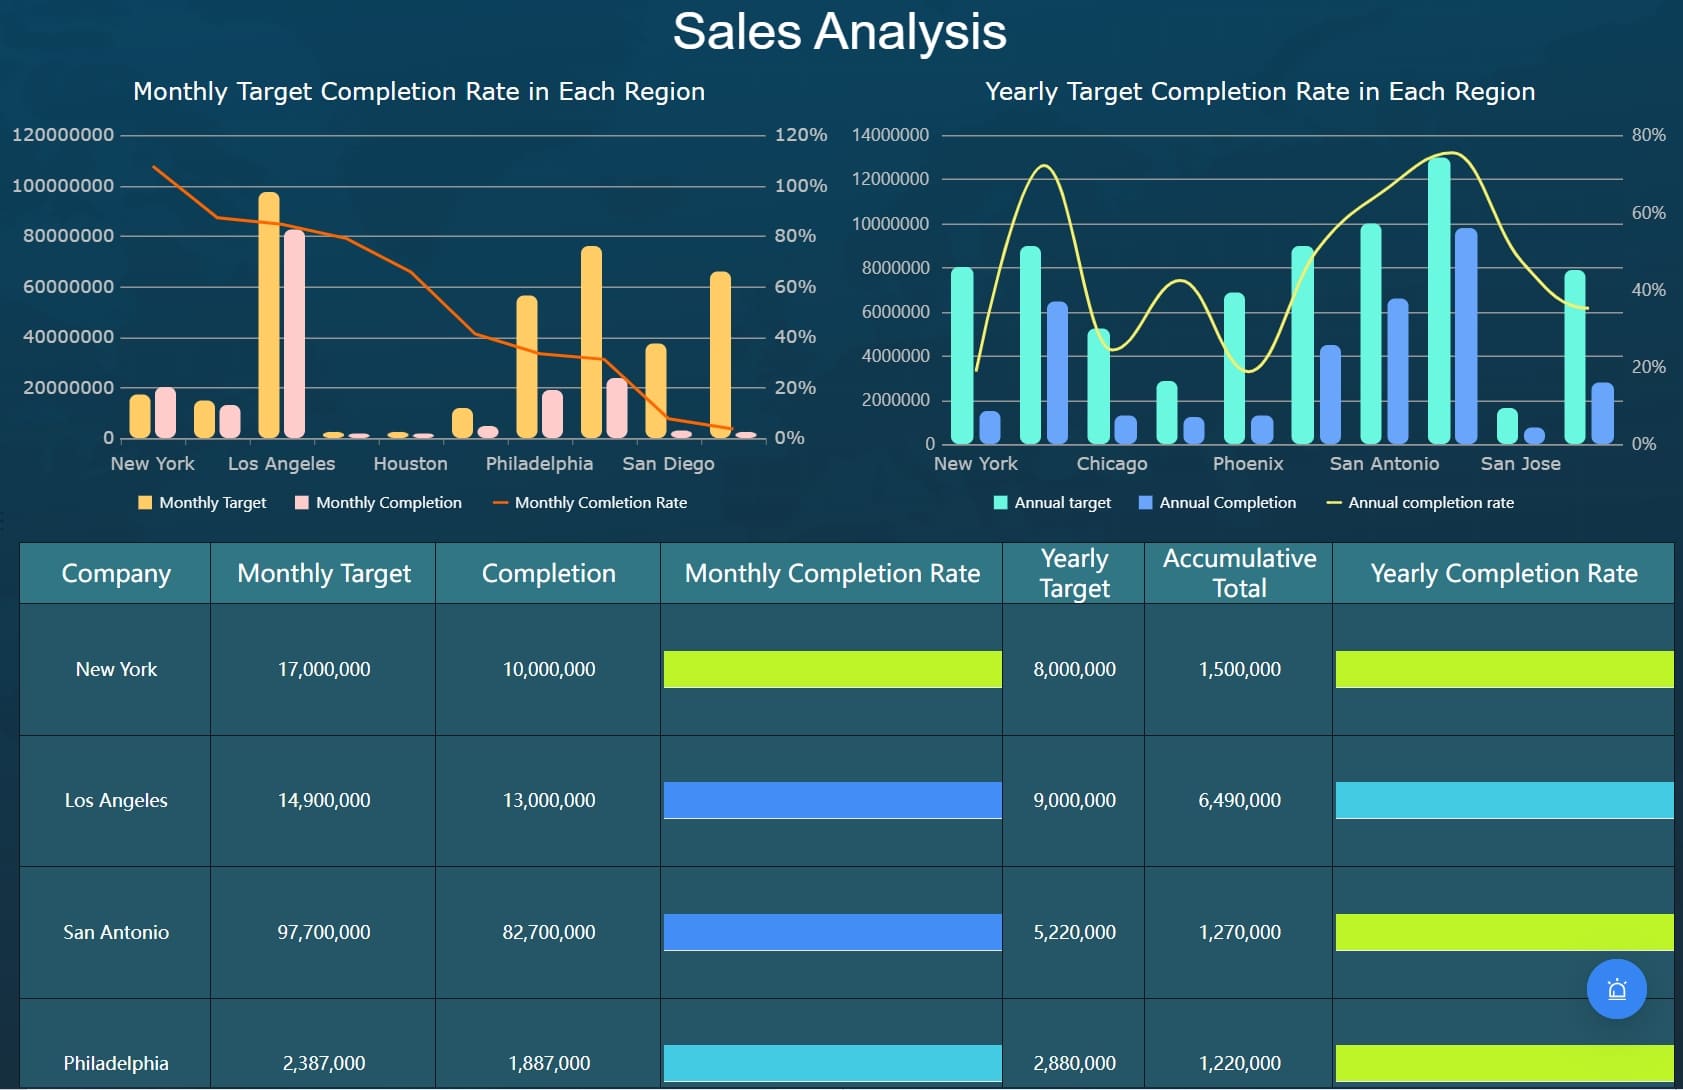
Mid-page performance breakdown
The middle of the dashboard is where teams explain the drivers behind the headline numbers. This section should be organized around the way the business actually operates.
Common breakdown dimensions include:
Business unit
Region
Audience segment
Channel
Campaign
Product line
This area should support comparisons that matter to leadership. For example:
Which region is ahead or behind target?
Which channel is producing the most efficient pipeline?
Which segment is responding best to current messaging?
Where should budget be shifted next week?
Use visual hierarchy carefully. Tables are useful for precision, while bar charts, line trends, and heatmaps make outliers easier to identify. The best enterprise dashboard designs combine both.
Bottom section for context and next steps
The bottom of the report is where data becomes management action. This section should summarize:
Risks
Opportunities
Experiments in progress
Immediate action items
Decisions needed from leadership
This is especially important in enterprise settings, where performance issues often require cross-functional support rather than just marketing adjustments.
Examples of bottom-section content:
North America webinar conversion lagging; revise post-event nurture sequence by Thursday
Paid social spend to be reduced 15% and reallocated to branded search
Attribution gap in APAC partner campaigns under review by marketing ops
Approval needed for accelerated event budget in healthcare segment
How to Write Executive Commentary That Drives Decisions
A dashboard alone rarely changes behavior. Commentary is what turns metrics into action. In a strong weekly marketing report sample, executive commentary should explain why performance changed, what it means for business goals, and what leaders should do about it.
Focus on insight over raw data
Do not repeat what the chart already shows. Commentary should interpret movement, not narrate the obvious.
Weak commentary:
Paid search leads increased by 18%.
Better commentary:
Paid search leads increased by 18% after budget was reallocated toward high-intent branded terms, improving both volume and cost efficiency. This suggests current non-brand spend should remain constrained until creative refresh is complete.
That shift—from observation to implication—is what executives value.
Connect marketing outcomes to business priorities
Enterprise leaders care about revenue, strategic initiatives, market expansion, and resource allocation. Commentary should tie marketing results directly to those priorities.
For example:
Pipeline growth in the manufacturing segment supports quarterly vertical expansion goals
Lower webinar conversion in EMEA may reduce next-month opportunity coverage
Faster SDR response time improved MQL-to-SQL conversion, supporting pipeline recovery
When marketing reporting uses business language instead of channel language, it earns more attention in leadership meetings.
Good commentary is brief, specific, and owned. Each point should answer four questions:
What changed?
Why did it change?
What should happen next?
Who owns the next action?
A practical executive commentary format looks like this:
Insight: Organic conversions improved in enterprise search themes.
Business impact: Lowers dependency on paid acquisition for high-value accounts.
Next action: Expand SEO content support for three priority solution pages.
Owner and timing: Content strategy lead by next Tuesday.
This structure reduces ambiguity and improves follow-through.
Common Reporting Mistakes to Avoid
Many enterprise teams already produce weekly reports, but they fail to influence decisions because the report design is flawed. Avoiding a few common mistakes can dramatically improve usefulness.
1. Overloading the report with too many metrics
A report packed with every available metric creates confusion. If leadership cannot tell which five to ten numbers matter most, the report will be skimmed and forgotten.
Best practice:
Prioritize business-impact KPIs first
Move tactical detail into drill-down tabs or secondary views
Keep the main report focused on action-driving measures
2. Mixing strategic KPIs with tactical details without hierarchy
Executives should not see bid-level ad metrics before they see sourced pipeline and conversion health. Reports need a clear hierarchy from top-line outcomes to operational drivers.
Best practice:
Start with revenue and pipeline impact
Then show channel and segment drivers
Then add operational details only where needed
3. Failing to standardize definitions across teams, tools, and regions
In enterprise organizations, inconsistent metric definitions destroy confidence. If one region counts recycled leads as new while another does not, comparisons become misleading.
Best practice:
Publish a shared KPI dictionary
Align CRM, automation, and BI logic
Audit definitions regularly across regions and business units
4. Omitting next actions, risks, or decisions needed from leadership
A weekly report without recommendations is just a summary. Leaders need to know what requires escalation, what can be optimized locally, and where support is needed.
How Enterprise Teams Can Turn the Report Into a Weekly Operating Rhythm
The highest-performing marketing organizations do not treat weekly reporting as an isolated deliverable. They use it as the backbone of a recurring operating rhythm that improves planning, alignment, and execution.
To make the weekly marketing report operationally valuable, follow these best practices:
1. Build one standardized reporting template for all regions and teams
Create a master structure that every business unit uses. Standardization improves trust, speeds consolidation, and makes cross-region comparisons possible.
Implementation steps:
Define mandatory KPIs and fixed calculation logic
Set standard filters for time, region, business unit, and channel
Create common dashboard sections for summary, breakdown, and actions
Lock metric definitions in a shared governance document
2. Align the report to the weekly leadership meeting agenda
The report should prepare the conversation, not duplicate it. Structure the dashboard around the decisions expected in the weekly leadership sync.
Implementation steps:
Identify recurring leadership questions
Design summary views to answer those questions immediately
Add commentary prompts for risks, opportunities, and approvals needed
Publish the report before the meeting with time for review
3. Create a weekly review workflow for testing and optimization
Reporting should feed execution. Each week, teams should use the report to decide what to scale, pause, test, or escalate.
Implementation steps:
Review top and bottom performing channels or campaigns
Diagnose whether issues are strategic, creative, targeting, or operational
Document the optimization decision for each major variance
Revisit the result in the next week’s report
4. Establish closed-loop feedback between marketing, sales, and operations
Pipeline performance is rarely owned by marketing alone. Enterprise reporting becomes far more effective when sales and operations participate in diagnosis and action planning.
Implementation steps:
Review sales acceptance and follow-up metrics alongside lead metrics
Flag routing, SLA, and attribution issues quickly
Assign shared owners for cross-functional bottlenecks
Use weekly findings to improve forecasting and campaign planning
These practices turn reporting from passive measurement into active performance management.
Building This Weekly Marketing Report at Scale with FineReport
Building this manually is complex; use FineReport to utilize ready-made templates and automate this entire workflow. For enterprise teams, the challenge is not just creating a dashboard once. It is sustaining a reliable reporting process across multiple systems, regions, and stakeholders every single week.
FineReport helps teams operationalize the entire reporting model by enabling:
Scheduled refreshes and consistent report delivery
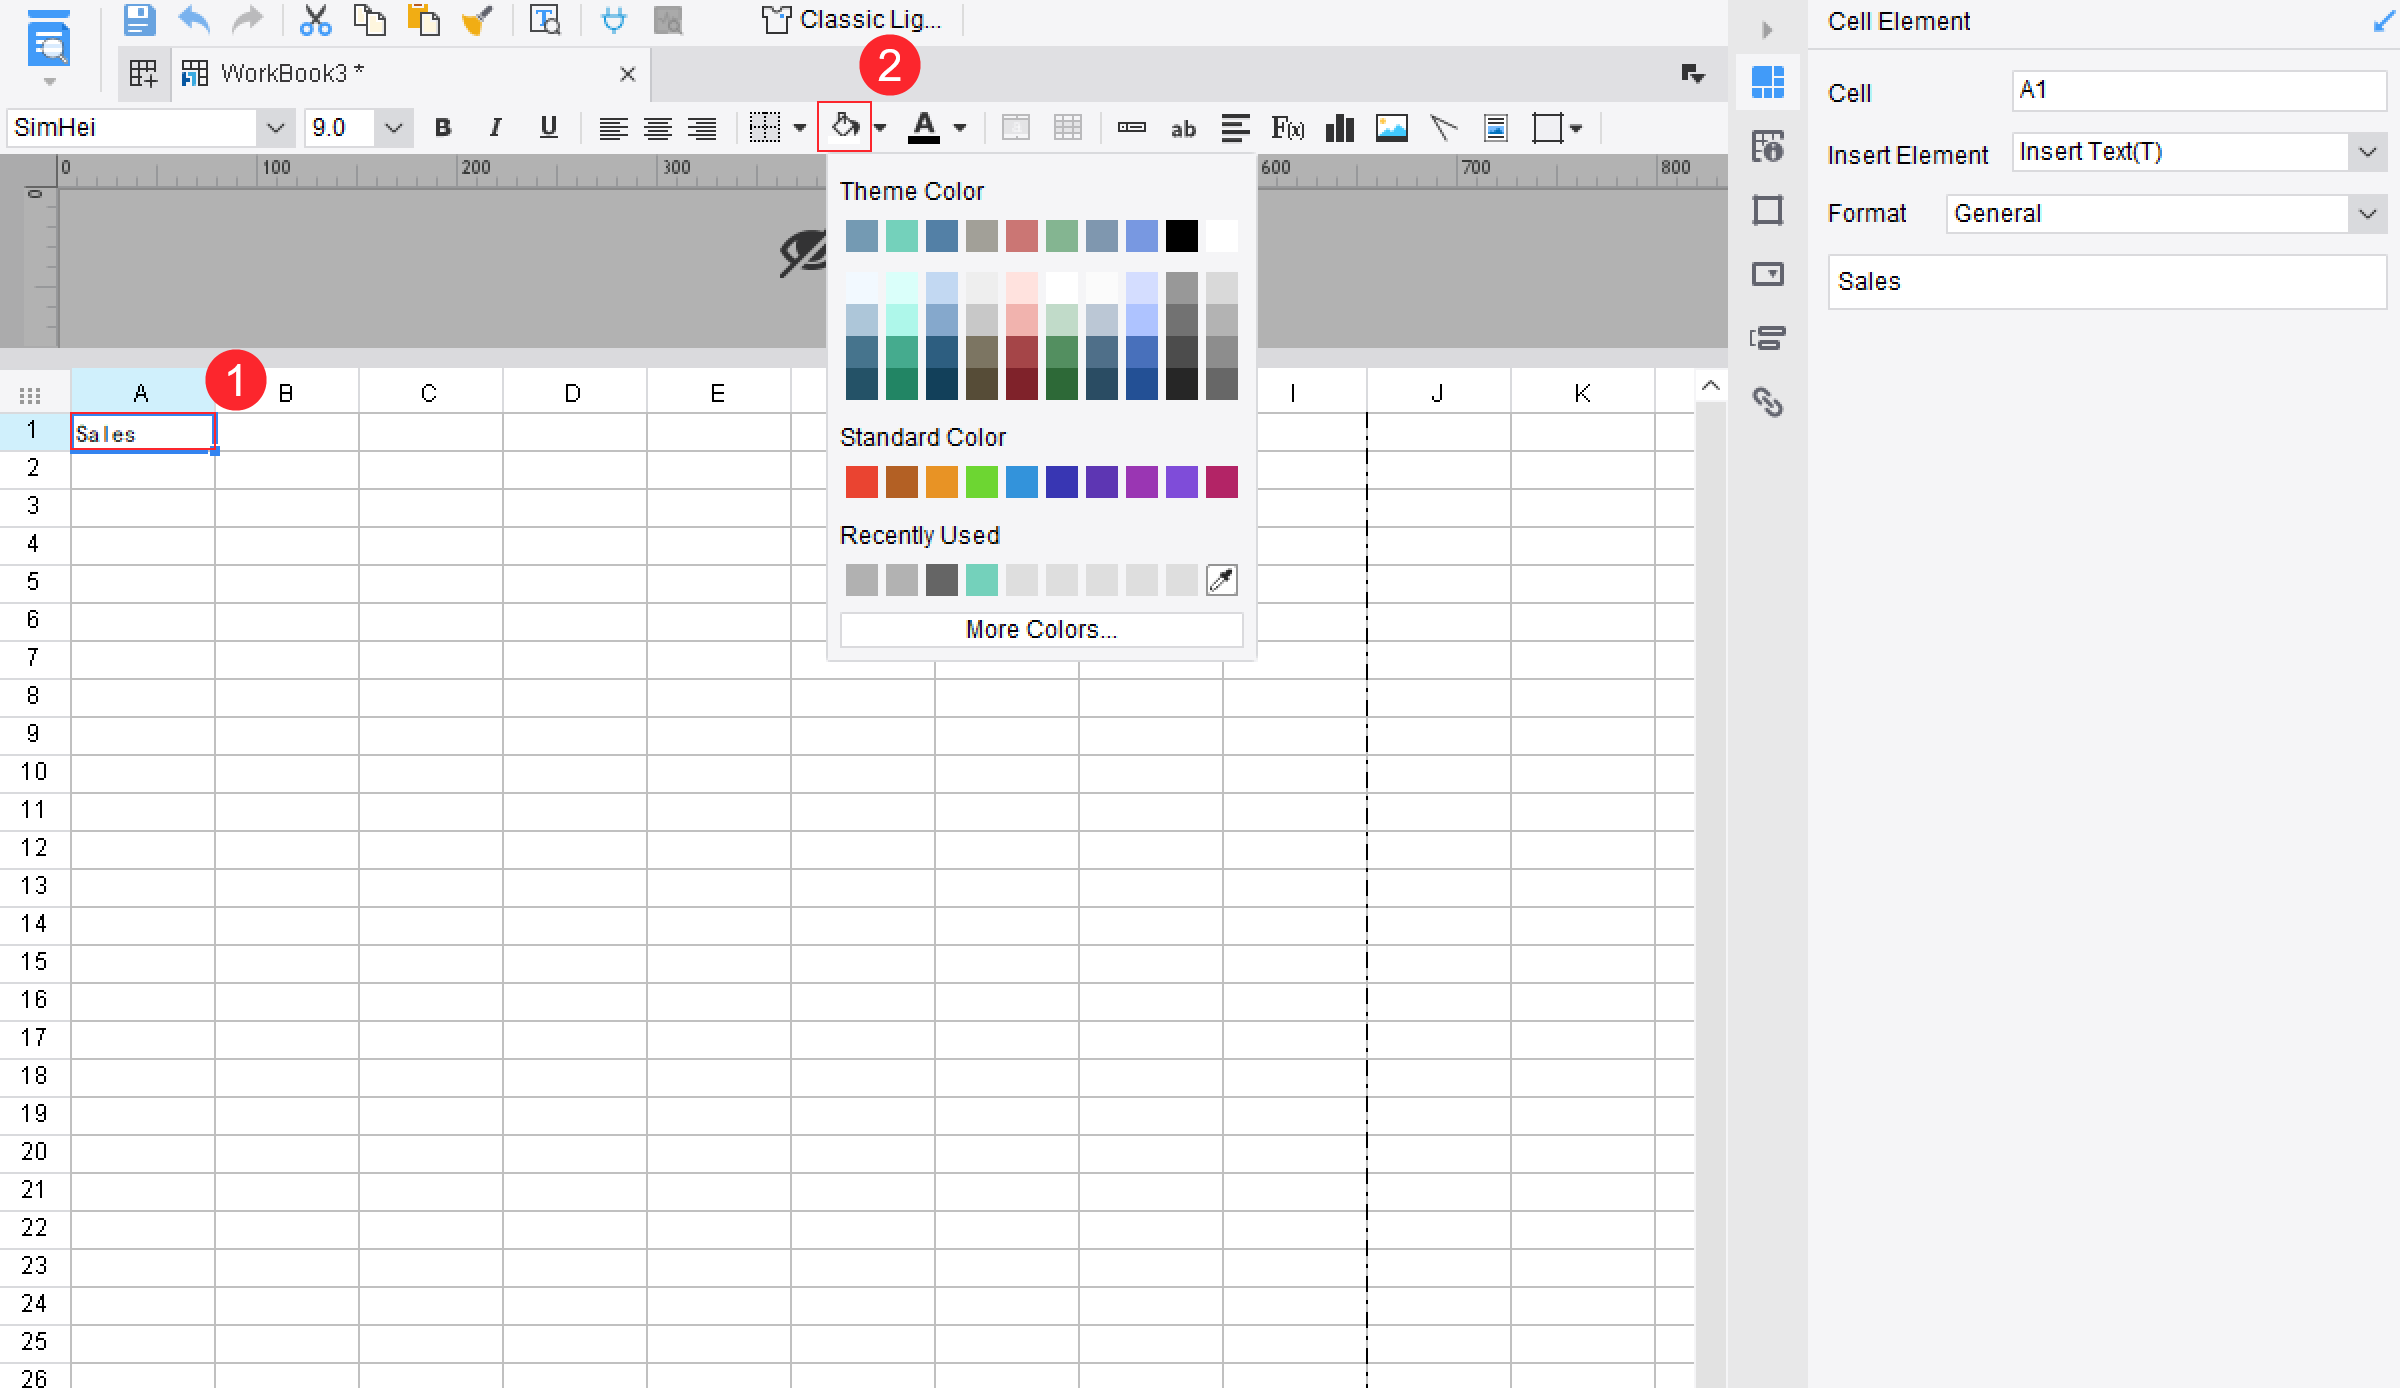
Reusable report templates for weekly marketing reviews
Visual commentary, alerts, and action-oriented reporting workflows
For enterprise organizations, this matters because manual spreadsheet reporting introduces delays, version conflicts, and definition inconsistencies. FineReport reduces that overhead and gives decision-makers a single, trusted view of weekly marketing performance.
If your team is trying to build a scalable weekly marketing report sample that supports executive visibility, channel optimization, and cross-functional accountability, FineReport offers a faster and more controlled path than stitching the process together manually.
It should include clear KPIs, the reporting window, data sources, metric definitions, regional rollups, and an executive summary with actions. The report should help leaders make weekly decisions, not just review numbers.
The most important KPIs usually include sourced pipeline, influenced revenue, lead volume, funnel conversion rates, cost efficiency metrics, and budget pacing. Enterprise teams should prioritize metrics that show business impact and performance changes quickly.
A dashboard shows live or regularly refreshed metrics, while a weekly marketing report adds context, commentary, and recommended actions. The report turns performance data into a decision-ready summary for leadership.
They should standardize metric definitions, set a fixed data cutoff time, assign report ownership, and align source systems across regions and channels. Consistency builds trust and makes weekly comparisons meaningful.
Executive commentary explains what changed, why it changed, and what the team should do next. It helps leaders focus on risks, opportunities, and decisions instead of interpreting raw metrics on their own.
Product Trial
FineReport
Pixel-perfect reports · Interactive dashboards · Easy data entry · Digital twins