You might wonder, what is a data model? Imagine sorting your closet. You group shirts, pants, and shoes so you can find what you need fast. A data model works the same way. It organizes and labels your data so you can use it efficiently. In business, data modeling helps you make better decisions by showing how data connects. Companies use data modeling to boost efficiency, personalize marketing, and predict trends. When you use a data model, you see patterns, improve processes, and quickly adapt to changes. Data modeling shapes how you manage, analyze, and act on information every day.
A data model is an abstract way to organize and describe how you store, connect, and use data. When you ask, "what is a data model," think of it as a blueprint for your information. It helps you see how different pieces of data fit together, making it easier to manage and analyze. Industry standards, like the ANSI/SPARC model, break down data modeling into three main types. Each type serves a different purpose in helping you understand and use your data.
You use data modeling to make sure your data matches your business needs. It helps you design systems that are easy to use, flexible, and reliable. FanRuan and FineBI use these models to unify and organize data for analytics. With FineBI, you can connect to many data sources, build relationships, and explore your data without repeating the same steps. This approach saves time and ensures everyone in your company works with the same, trusted information.

Entities are the main objects or concepts in your data model. For example, if you run a store, your entities might be "Customer," "Product," and "Order." Each entity represents something important you want to track. In a conceptual data model, you identify these entities to understand what matters most in your business.
Attributes describe the details of each entity. If "Customer" is an entity, attributes could include "Customer Name," "Email," and "Phone Number." In a logical data model, you list these attributes to show what information you need for each entity. Attributes help you capture the right data for your business goals.
Relationships show how entities connect to each other. For example, a "Customer" places an "Order," or a "Product" belongs to a "Category." You use relationships to map out how data moves and interacts. In a physical data model, you turn these relationships into database links, like foreign keys, to keep your data organized and accurate.
Tip: Drawing an Entity-Relationship (ER) diagram can help you visualize entities, attributes, and relationships. This makes it easier to spot missing connections or errors before you build your database.
You see data models in action every day, especially in business intelligence platforms. Companies use different types of data models to solve real problems and make better decisions. Here are some examples:
| Data Model Type | Real-World Example |
|---|---|
| RFM Model | Segments customers by how recently and often they buy, and how much they spend. |
| Pareto (ABC) Analysis | Groups products into A, B, or C classes to focus on top sellers and manage inventory. |
| DuPont Analysis | Breaks down financial ratios to help you understand profitability and performance. |
| AARRR Metrics | Tracks user behavior through stages like acquisition, activation, retention, revenue, and referral. |
| Shopping Basket | Finds patterns in what products customers buy together, helping you plan promotions. |
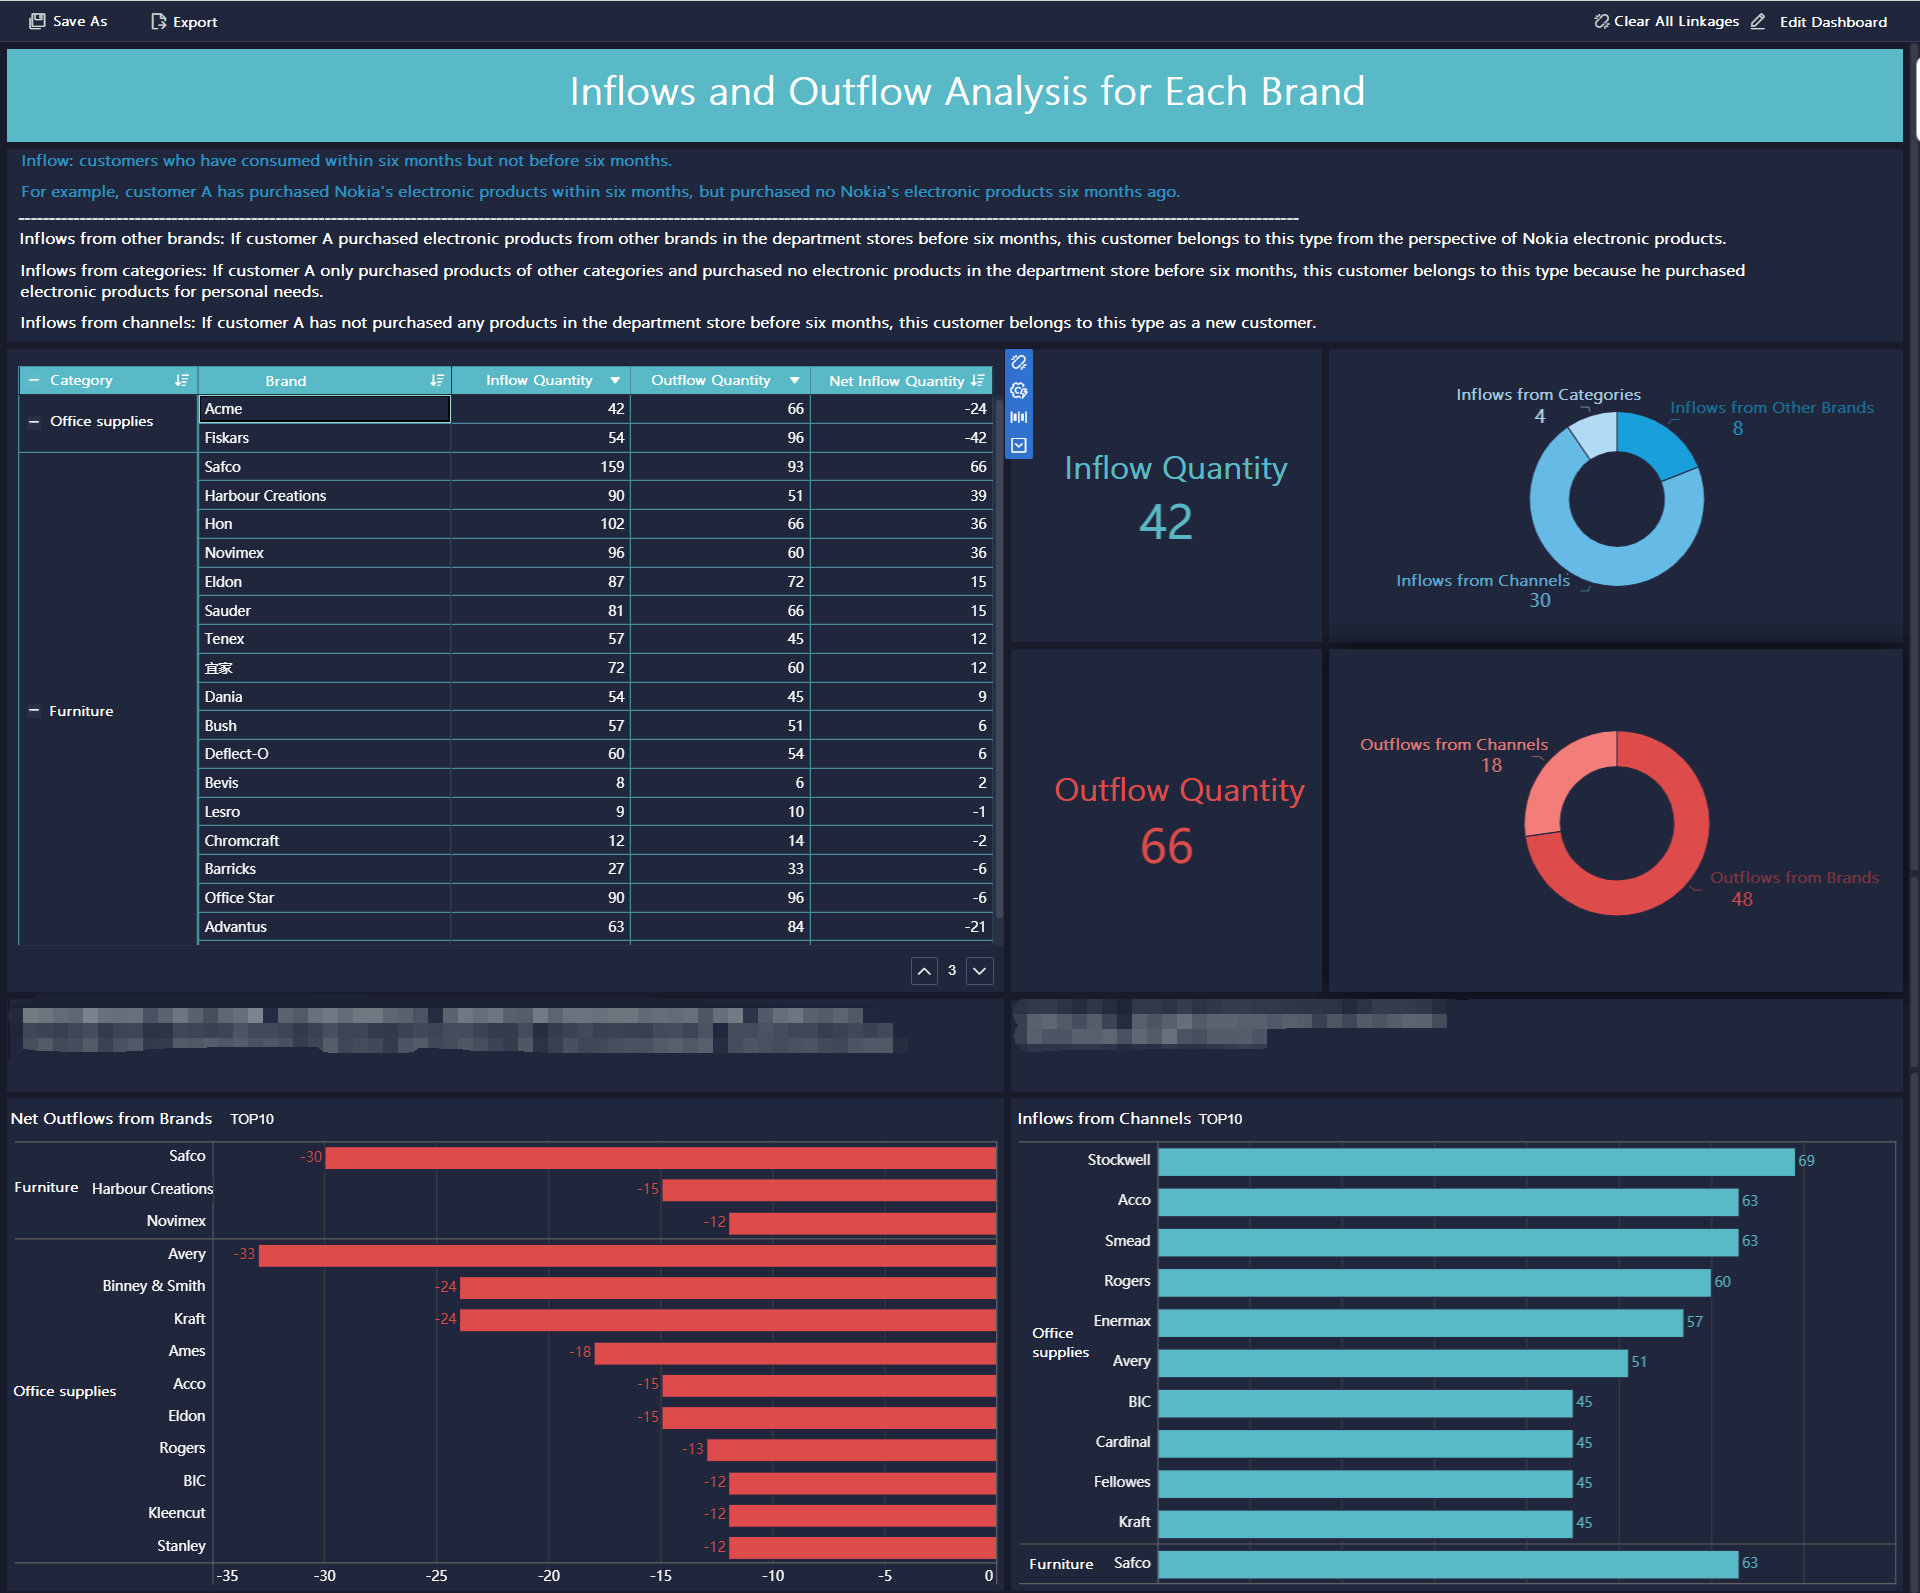
FineBI and FanRuan use these data models to bring together information from many sources. For example, you can use FineBI to build a logical data model that links sales, inventory, and customer data. This lets you analyze trends, spot problems, and make quick decisions. You do not need to set up the same connections every time. The platform remembers your data model, so you can focus on finding insights.
When you understand what is a data model and how to use it, you gain control over your data. You can design systems that grow with your business and support smarter analytics. Data modeling is not just for IT experts. With tools like FineBI, anyone can build, explore, and share data models to drive results.
Understanding the importance of data modeling can transform how you approach business intelligence, analytics, and daily operations. A well-designed data model acts as the foundation for your entire data strategy. It connects your business requirements to the way you collect, store, and use information. When you use data modeling, you create a clear structure that supports better decisions, faster analysis, and stronger teamwork.
A strong data model delivers measurable business value. You gain the ability to turn raw data into actionable insights that drive growth and efficiency. Here’s how data modeling supports your business:

Data modeling also plays a key role in data integration. It acts as a blueprint that brings together information from different sources, such as databases, APIs, and cloud systems. This unified view helps you break down silos and ensures everyone works with the same trusted data. When you align your data model with your business requirements, you create a common language that supports collaboration and reduces confusion.
Note: Companies using effective data modeling have seen real results. They report increased revenue from targeted marketing, faster product launches, and improved customer experiences. Some organizations have saved millions by optimizing operations and reducing time spent on data preparation.
Collaboration improves when you involve different teams in the data modeling process. You clarify data definitions, resolve discrepancies, and uncover hidden relationships. Modern tools like FineBI support this teamwork by offering shared repositories and standardized naming conventions. This approach reduces errors, saves time, and helps managers see how data flows across departments.
Data quality is essential for reliable analytics and decision-making. Data modeling ensures high data quality by enforcing rules and standards throughout your systems. Here’s how it works:
When you use a data model, you create a clear structure that supports data governance and compliance. This is especially important for industries with strict regulations. By maintaining high data quality, you reduce risks, improve customer satisfaction, and support your business requirements more effectively.
Tip: Drawing entity-relationship diagrams during data modeling helps you spot gaps, redundancies, or inconsistencies before they become bigger problems.
You use demand analysis to understand what your customers want and when they want it. Data modeling helps you organize and track this information over time. For example, you can use dimensional models to separate facts, such as sales numbers, from dimensions, like product or time. This structure makes it easy to spot trends and forecast future demand. Temporal data modeling lets you keep a history of changes, so you can see how demand shifts across seasons or after a new product launch.
When you build a data model for demand analysis, you create layers. You start with raw data, then move to cleaned and organized data, and finally reach business-ready insights. This layered approach helps you meet business requirements by making sure your data is accurate and easy to use. You also use validation rules and constraints to keep your data clean. This prevents errors that could lead to wrong decisions about inventory or marketing. You can find a comprehensive guide on this topic in our dedicated article: How to Conduct a Demand Analysis for Your Business
Tip: Use normalization in your data model to reduce duplicate information. This keeps your demand analysis reliable and efficient.
Customer behavior analysis helps you learn why people buy, what influences their choices, and how they interact with your brand. You can use different data models to capture these patterns. Traditional models, like the learning or economic models, focus on how customers make decisions based on experience or price. Modern models, such as the Engel-Kollat-Blackwell or Black Box models, map out the steps customers take from discovering your brand to making a purchase.
You can answer questions like:
By structuring your data with the right model, you can link actions to outcomes. This helps you adjust your marketing and improve customer experience. You also align your analysis with business requirements, making sure you focus on the most important behaviors. You can find a comprehensive guide on this topic in our dedicated article: Essential Tips for Successful Customer Behavior Analysis
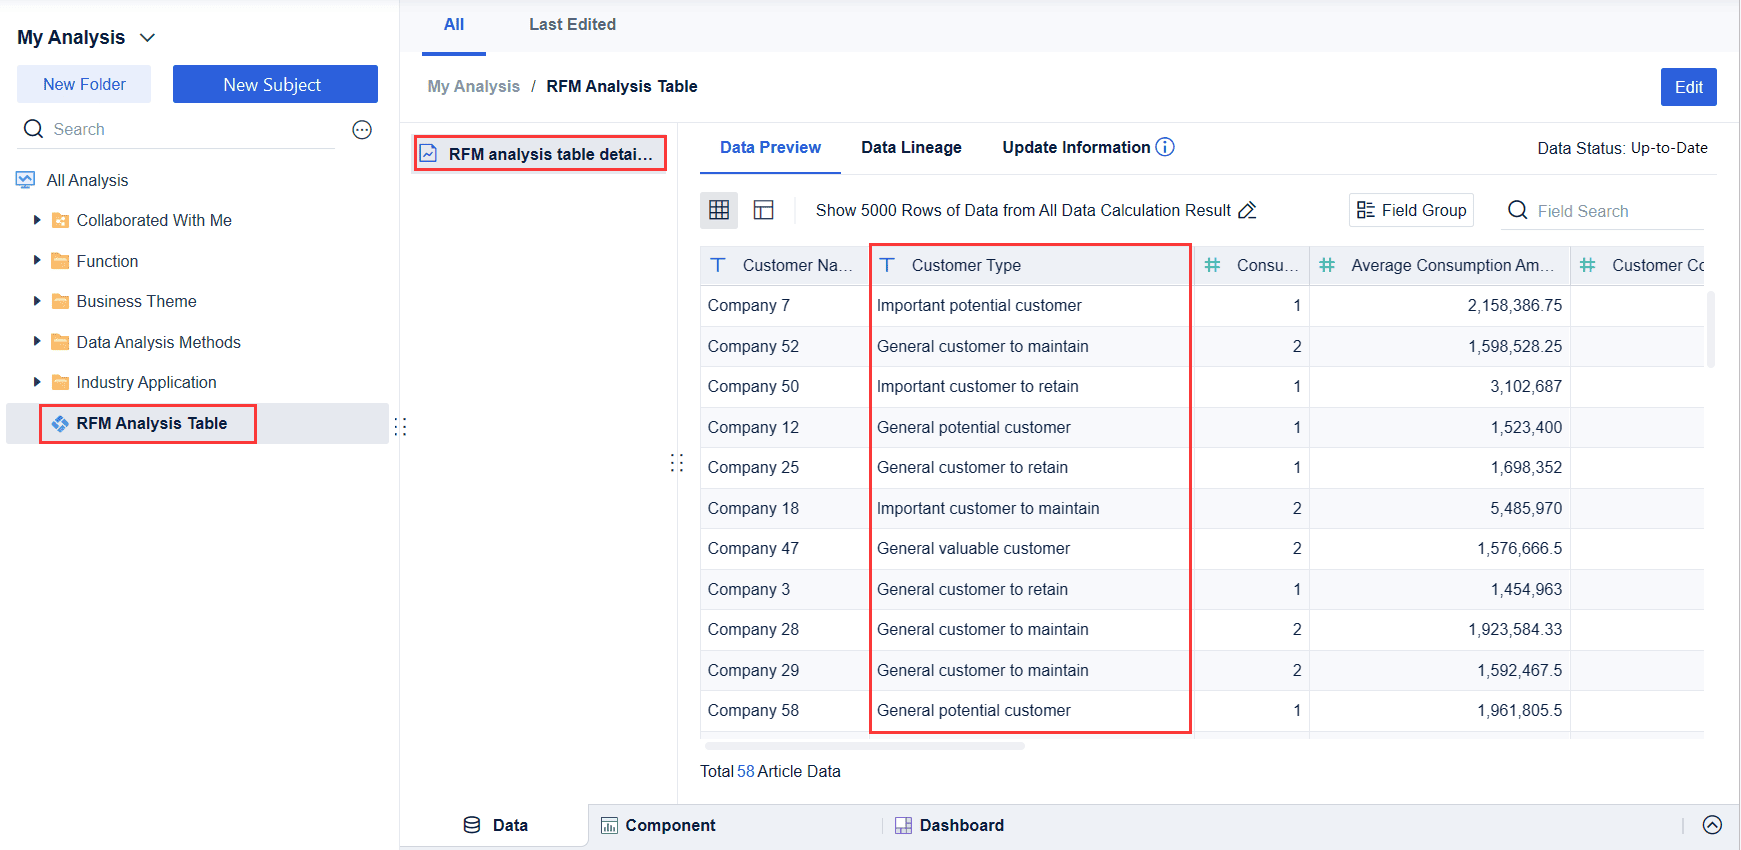
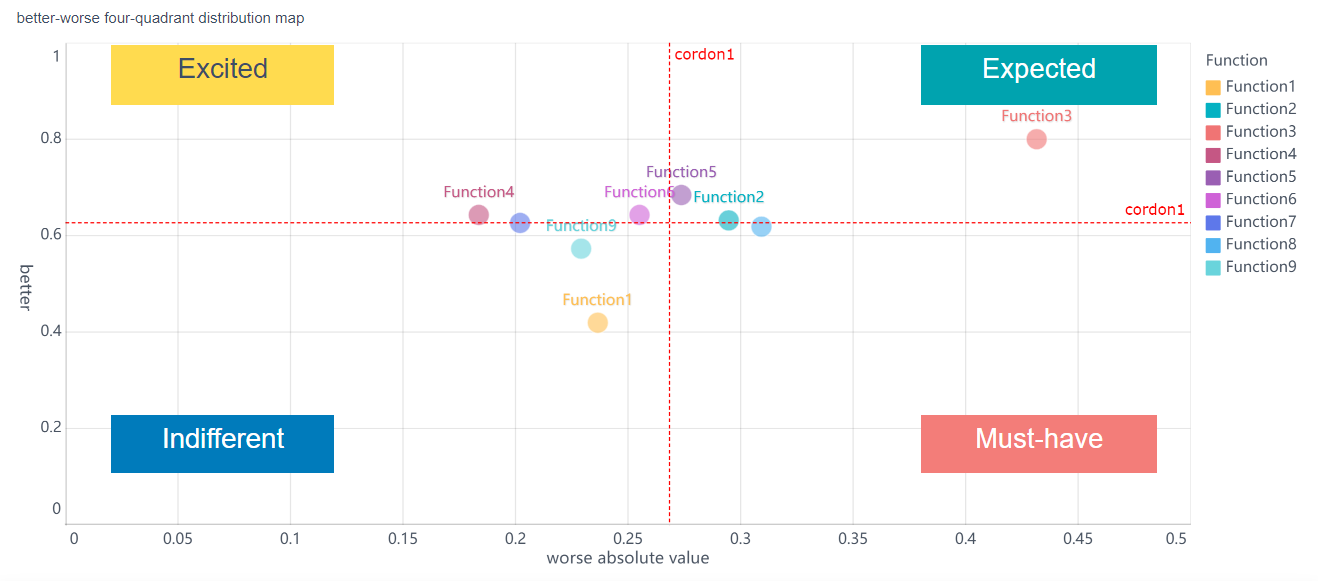
RFM analysis stands for Recency, Frequency, and Monetary value. You use this model to segment your customers based on how recently they bought, how often they buy, and how much they spend. You assign scores for each factor, then combine them to create customer groups. For example, you might find "Champions" who buy often and spend a lot, or "At Risk" customers who have not bought in a while.
This model helps you target your marketing. You can reward loyal customers, re-engage those who might leave, and find new opportunities for growth. RFM analysis turns raw transaction data into clear segments, making it easier to act on your insights. You can also adjust the scoring to fit your business requirements, focusing on the factors that matter most to your goals. You can find a comprehensive guide on this topic in our dedicated article: How to Perform RFM Analysis Step by Step
Note: Visualization tools, like graphs or tree maps, make it simple to see which customer segments need attention.
You can use the AARRR metrics framework to track and improve your business growth. This model breaks the customer journey into five key stages: Acquisition, Activation, Retention, Revenue, and Referral. Each stage helps you understand how users interact with your product and where you can make improvements.
The AARRR framework gives you a structured way to measure and optimize each stage. You can:
Tip: Use analytics tools and A/B testing to experiment with changes at each stage. This helps you find what works best for your users.
You can apply the AARRR framework to many types of businesses, especially startups and SaaS companies. Its stage-based approach makes it easy to track progress, identify bottlenecks, and focus your efforts where they matter most. By collecting and analyzing data at every step, you make smarter decisions and drive continuous growth. You can find a comprehensive guide on this topic in our dedicated article: Unlocking Business Success with the AARRR Metrics Framework. Also, you can discover more data model in Fuanruan's Blog.
Building a strong data model helps you turn raw data into valuable insights. You follow a clear process to make sure your data modeling supports your business goals and analytics needs.
You can use these steps to create a reliable data model for business intelligence:
Tip: Always start with business questions. This helps you define facts and dimensions in your data model the right way.
You have many tools to help with data modeling and analytics. Some of the most popular options include:

Note: Choose tools that match your business requirements and data sources. This ensures your data model stays flexible and scalable.
You can transform your business with FineBI’s powerful business intelligence solutions. FineBI uses advanced data model techniques to help you organize, clean, and analyze your data. The platform’s Preparation and Calculation modules work like a massage for your data, turning messy information into clear, actionable insights. When you use FineBI, you see a real difference in how your team works. Surveys and case studies show a 33% increase in collaboration efficiency and a 33% boost in data processing speed. During real-time analytics sessions, interactive visualizations help teams work together, leading to a 40% improvement in meeting efficiency. FineBI’s data model approach ensures that you always have the right information at your fingertips, making it easier to make smart decisions.
FineBI offers a range of features to support your business intelligence journey:

FineBI helps you turn raw data into practical intelligence, improving both daily operations and long-term strategy.
You can apply FineBI’s data model capabilities across many industries. In retail, you might use it to track customer buying patterns and manage inventory. In manufacturing, you can monitor production lines and spot issues before they become problems. Financial services teams use FineBI to analyze risk and improve compliance. Healthcare organizations rely on it to manage patient data and improve care quality. Each industry benefits from FineBI’s ability to bring together data from different sources, making analysis faster and more reliable.
Here is a quick look at how different industries use FineBI:
| Industry | Use Case Example |
|---|---|
| Retail | Customer segmentation and sales forecasting |
| Manufacturing | Production monitoring and quality control |
| Finance | Risk analysis and regulatory reporting |
| Healthcare | Patient data management and outcome tracking |
| Public Sector | Resource allocation and performance measurement |
You can see how a strong data model supports better decisions in every field.
You can start your journey with FineBI in a few simple steps:
To organize your data model for success, follow these best practices:
When you follow these steps, you build a strong foundation for data-driven decision-making with FineBI.
You rely on a strong data model to organize your data and drive business intelligence. With a clear structure, you improve data management, speed up retrieval, and reduce errors. Teams work better together because everyone shares the same language and rules. You see these benefits in real-world industries like healthcare, banking, and manufacturing. FanRuan and FineBI make it easy for you to build and use data models. You can connect multiple data sources, automate analysis, and create custom dashboards. FineBI supports real-time data operations, strong security, and teamwork. Start exploring data modeling in your organization to unlock better decisions and greater efficiency.
Click the banner below to try FineBI for free and empower your enterprise to transform data into productivity!

How to Conduct a Demand Analysis for Your Business
Essential Tips for Successful Customer Behavior Analysis

The Author
Lewis
Senior Data Analyst at FanRuan
Related Articles
What is Ecommerce Analytics and Why Does It Matter
Ecommerce analytics helps online stores track data, optimize sales, and enhance customer experience for better growth and profitability.
Lewis
Jan 04, 2026
What is Ad-Hoc Analysis and Why is it Important
Ad-hoc analysis lets you answer unique business questions instantly, offering flexible, real-time insights that drive smarter, faster decisions.
Lewis
Sep 16, 2025

Break Even Analysis Made Easy with Practical Step-by-Step Instructions
Break even analysis explained step by step with real examples. Calculate your break-even point, set sales goals, and make smarter business decisions.
Lewis
Jul 16, 2025


