A common size statement shows each item in a financial statement as a percentage of a base figure, making it easy for you to compare financial data across different companies or time periods. You use a common size statement to standardize numbers, so you can see trends or differences even when companies are not the same size. By turning values like revenue or expenses into percentages, you can focus on performance rather than absolute numbers. This approach helps you quickly spot strengths and weaknesses, especially when you look at companies in the same industry.
Common Size Statement Basics

What Is a Common Size Statement?
You use a common size statement to turn every line item in a financial report into a percentage of a base figure. In most cases, you see each item as a percentage of total revenue or total sales. This approach helps you compare results across different companies, time periods, or industries. When you look at common size statements, you can quickly spot trends and patterns that might stay hidden in raw numbers. For example, you might notice that one company spends a higher percentage of its revenue on marketing than another, even if their total sales differ.
Common size statements make it easier for you to analyze performance. You do not need to worry about the size of the company or the currency used. Instead, you focus on the relationship between each item and the base figure. This method works well for both income statements and balance sheets. By using common size statements, you gain a clearer view of how companies allocate resources and manage costs.
Tip: When you prepare a common size statement, always choose a consistent base figure, such as total revenue for income statements or total assets for balance sheets. This consistency ensures your comparisons remain accurate.
How It Differs from a Standard Financial Statement
Common size statements and standard financial statements present data in different ways. The table below highlights the main differences:
| Aspect | Common Size Statements | Standard Financial Statements |
|---|---|---|
| Data Presentation | Percentages of a base figure | Absolute figures |
| Comparison Ease | Easier across companies of different sizes | More challenging for comparisons |
| Example | Income statement items as a percentage of total revenue | Absolute dollar amounts for each line item |
- Common size statements express every line item as a percentage of a base figure. This format helps you analyze performance, no matter the size of the company.
- Standard financial statements show only the actual numbers. This makes it harder for you to compare companies or spot trends.
When you use common size statements, you can compare companies of any size or track changes over time. You do not get this level of insight from a standard financial statement. Common size statements give you a powerful tool for financial analysis and decision-making.
Types of Common Size Statement
When you analyze financial data, you often use three main types of common size financial statement: the income statement, the balance sheet, and the cash flow statement. Each type helps you see the financial structure and performance of a company in a standardized way.
Income Statement
A common size income statement shows every item as a percentage of total revenue or net sales. You set total sales as 100%, then express costs, operating expenses, and net income as smaller percentages. This method lets you compare companies of different sizes or track changes over time. For example, you can see how much of each dollar earned goes toward expenses or profit. You gain insights into expense ratios, profit margins, and performance trends.
Tip: Use a common size income statement to quickly spot if a company spends more on marketing or has higher profit margins than its competitors.
Here is a simple table to illustrate what you see in a common size income statement:
| Item | Percentage of Total Revenue |
|---|---|
| Cost of Goods Sold | 60% |
| Operating Expenses | 25% |
| Net Income | 15% |
You can use this format to compare companies or review your own results year over year.
Balance Sheet
A common size balance sheet presents each asset, liability, and equity item as a percentage of total assets. You use total assets as the base figure, which makes it easy to see how a company allocates resources. This approach helps you compare financial structures across companies or spot trends in asset allocation. You can see how much of every dollar in assets is funded by debt or equity.
Note: A common size balance sheet helps you identify sudden changes in debt or asset structure, which may signal financial risk.
Here are some advantages of using a common size balance sheet:
- Normalizes data for easy comparison.
- Simplifies trend analysis.
- Highlights structural shifts in assets or liabilities.
- Makes it user-friendly for stakeholders.
Cash Flow Statement
A common size cash flow statement expresses each cash inflow as a percentage of total cash inflows and each cash outflow as a percentage of total cash outflows. You use total cash inflows or outflows as the base figure. This format helps you analyze how cash moves through your business and compare cash flow patterns across periods or companies. You must classify cash flows correctly to avoid errors.
Tip: Always check your cash flow classifications to ensure accurate analysis in a common size cash flow statement.
You may face challenges with common size cash flow statements, such as misclassifying cash flows or lacking context for projections. Understanding the principles of cash flow classification is essential.
FineReport can help you automate the creation and visualization of any common size financial statement. You can use its drag-and-drop designer to build reports, connect to multiple data sources, and generate dynamic dashboards. This makes it easier to analyze and share your financial insights.
Creating Common Size Statement

Step-by-Step Process
You can create a common size statement by following a clear process. Start by gathering your financial data, such as an income statement or balance sheet. Next, choose a base figure. For an income statement, use total revenue. For a balance sheet, use total assets. Then, convert each line item into a percentage of the base figure. This method helps you compare financial data across different companies or time periods.
Here is a simple table that outlines the steps:
| Step | Description |
|---|---|
| 1 | Convert each line item into a percentage of a selected base (e.g., net sales for income statements). |
| 2 | For balance sheets, restate each line item as a percentage of total assets. |
| 3 | This process facilitates easier comparisons across different companies or periods. |
Tip: Always use the same base figure for each statement to keep your analysis consistent.
Key Formulas
You can use a straightforward formula to calculate each percentage in a common size statement:
Percentage = (Line Item Amount / Base Figure) × 100
For example, if you want to find the percentage for Cost of Goods Sold in an income statement, divide the cost by total revenue and multiply by 100. This formula works for any line item and any type of common size statement.
Example
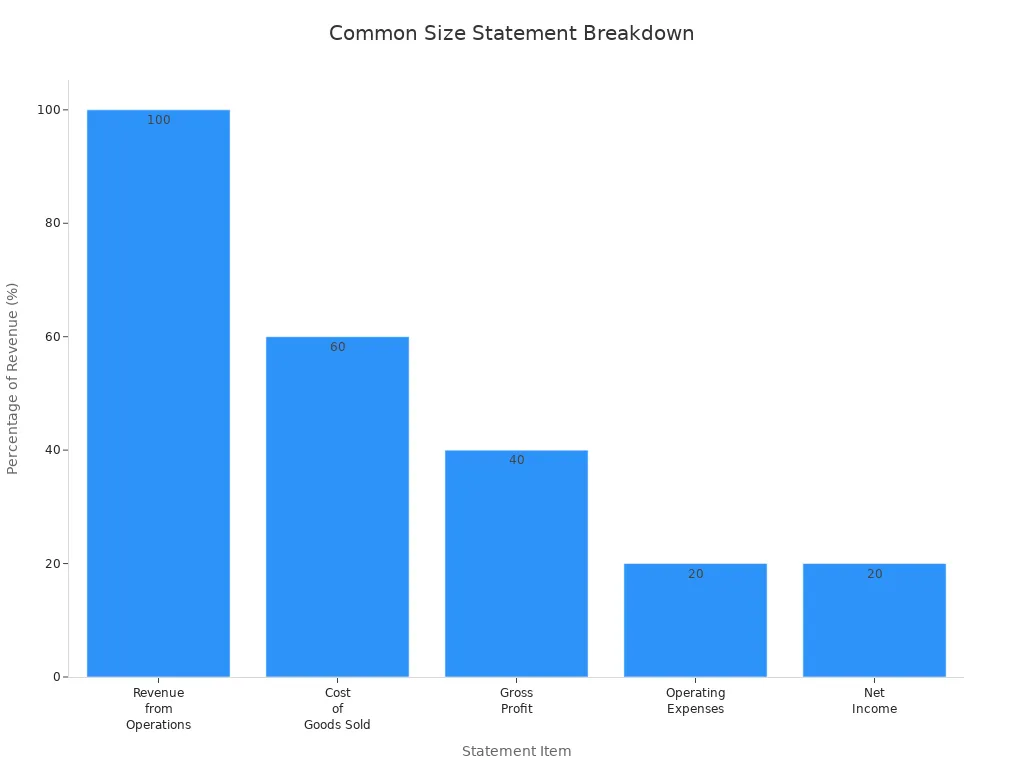
Let’s look at a practical example. Suppose you have the following income statement data:
| Item | Amount ($) | Percentage of Revenue (%) |
|---|---|---|
| Revenue from Operations | 100,000 | 100% |
| Cost of Goods Sold | 60,000 | 60% |
| Gross Profit | 40,000 | 40% |
| Operating Expenses | 20,000 | 20% |
| Net Income | 20,000 | 20% |
This table shows how each item relates to total revenue. You can see at a glance how much of your revenue goes to costs, expenses, and profit.
You can use FineReport to make this process even easier. FineReport lets you design common size statements with a drag-and-drop interface. You can connect to your data sources, apply formulas automatically, and visualize results with charts and tables. This saves you time and reduces errors, so you can focus on analyzing your financial data.
Importance of Common Size Statement
Benefits for Financial Analysis
You gain several important benefits when you use common size statements for financial analysis. Common size statements convert every item in a financial statement into a percentage of a base figure. This process, known as vertical analysis, makes it much easier for you to compare companies of different sizes or to track changes over time. You do not need to worry about the absolute numbers. Instead, you focus on the relationship between each item and the base figure.
Common size statements help you identify trends and patterns in financial performance. When you use vertical analysis on an income statement, you can quickly see if a company spends more on certain expenses compared to others in the industry. This method also allows you to benchmark your results against industry averages. By standardizing financial information, common size analysis gives you a clear view of a company’s financial health. You can spot strengths and weaknesses that might not be obvious in raw numbers.
You use common size statements to make better decisions. Investors, managers, and other stakeholders rely on these statements to assess financial health and plan strategies. When you look at a common size income statement, you can see how much of each dollar earned goes to costs, expenses, or profit. This structured view supports business valuation and helps you understand the overall financial performance.
You also benefit from easier comparisons across time periods. For example, you can use vertical analysis to compare income statements from different years. This approach helps you see if expense ratios or profit margins are improving or declining. You can apply the same method to a common size balance sheet or a common size cash flow statement. This consistency makes it easier to analyze financial statements and draw meaningful conclusions.
Note: Common size analysis is essential for financial analysis because it provides a standardized way to review financial statements, identify trends, and benchmark performance.
Here are some key advantages of using common size statements for financial analysis:
- You can compare companies of different sizes without confusion.
- You can identify trends and spot anomalies in financial data.
- You can benchmark your company’s performance against industry standards.
- You can make informed decisions based on clear, structured data.
Limitations
While common size statements offer many benefits, you should also understand their limitations. Vertical analysis does not provide information about the actual size of revenue or profit. You only see percentages, not the real dollar amounts. This lack of absolute values can make it hard to judge the true scale of a company’s operations.
Another limitation comes from differences in accounting policies. Companies may use different methods to record revenue or expenses. These differences can lead to inconsistencies when you compare common size financial statements. You might think two companies are similar, but their accounting choices could affect the results.
Common size statements also do not capture external factors. For example, they do not account for inflation, changes in exchange rates, or other outside influences that can affect financial performance. You need to consider these factors when you interpret the results of vertical analysis.
The table below summarizes the main limitations of common size statements:
| Limitation | Explanation |
|---|---|
| Lack of absolute values | You do not see the actual revenue or profit figures, only percentages. |
| Differences in accounting policies | Variations in accounting methods can cause inconsistencies. |
| Inability to capture external factors | Vertical analysis does not account for inflation or exchange rates. |
Tip: Always use common size analysis as one part of your financial analysis toolkit. Combine it with other methods to get a complete picture.
You should remember that common size statements simplify complex data, but sometimes this simplification can hide important details. Always look beyond the percentages and consider the context of each financial statement.
FineReport can help you overcome many manual challenges in preparing common size statements. You can automate the reporting process, which reduces manual errors and saves time. FineReport gives you real-time access to your financial data, so your analysis stays accurate and up to date. You can create templates that streamline data collection and reporting, making it easier to generate common size financial statements for any period or business unit. This automation enhances your financial management and supports better decision-making.
Using FineReport for Common Size Statement
Automating Financial Statement Reporting
You can streamline the process of preparing common size statements by using FineReport’s advanced features. FineReport offers a visual report designer with a drag-and-drop interface, so you do not need to write code to build complex reports. This tool makes it easy for you to create common size statements for any financial statement, including the income statement, balance sheet, or cash flow statement.
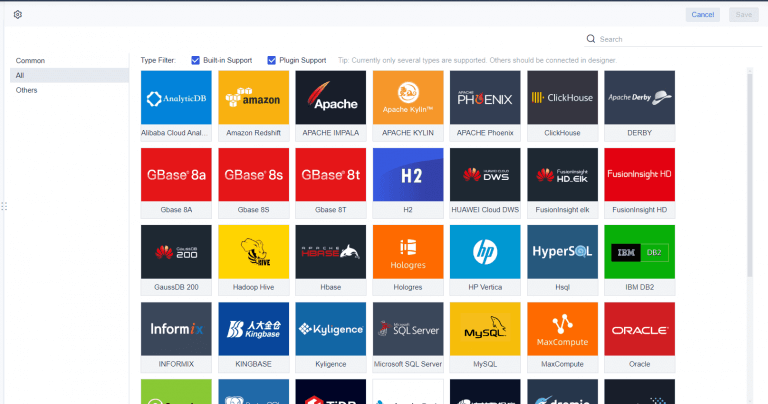
FineReport connects directly to your data sources, such as SQL databases, Excel files, or cloud services. You can pull in the latest numbers for your income statement or other financial statement with just a few clicks. Scheduled reporting lets you automate the generation and distribution of common size statements at regular intervals. You can set up reports to run daily, weekly, or monthly, ensuring your team always has up-to-date information.
The platform also provides customizable templates. You can tailor these templates to fit your business needs, saving time when you prepare new common size statements. This automation reduces manual errors and allows you to focus on analyzing your income statement data rather than formatting reports.
| Feature | Description |
|---|---|
| Visual Report Designer | Drag-and-drop interface for building common size statements and income statement reports. |
| Data Integration | Connects to databases, Excel, and cloud data for real-time financial statement updates. |
| Scheduled Reporting | Automates delivery of common size statements and income statement analysis. |
| Customizable Templates | Pre-built templates for quick creation of common size statements and income statement formats. |
Visualizing and Sharing Insights
FineReport empowers you to visualize common size statements with interactive dashboards and charts. You can transform your income statement data into clear bar graphs or pie charts, making trends and ratios easy to understand. These visualizations help you spot changes in your income statement or other financial statement over time.
You can share your common size statements with colleagues or stakeholders through FineReport's secure dashboards. The platform supports real-time collaboration, so your team can review and discuss income statement results together. You can export your common size statements to PDF, Excel, or Word, making it simple to distribute your financial statement analysis.
In real-world financial management, companies use FineReport to automate monthly income statement reviews, compare common size statements across business units, and present findings to management. The finance industry faces growing pressure for digital transformation. FineReport addresses this need by integrating data, automating reporting, and providing tools for deep analysis of every income statement and common size statement. You gain faster insights, reduce manual work, and support smarter financial decisions.
You now understand that a common size statement transforms financial data into percentages, making analysis and comparison straightforward. This tool helps you spot trends and benchmark performance, whether you review income statements, balance sheets, or cash flow statements. Business owners, analysts, and finance teams gain clearer insights and make smarter decisions. Try preparing your own common size statement using spreadsheets or FineReport for automation. For deeper analysis, explore these approaches:
| Financial Statement | Common Size Analysis |
|---|---|
| Income Statement | Comparing line items to revenue |
| Balance Sheet | Comparing line items to assets, liabilities, or equity |
| Cash Flow Statement | Analyzing cash flows in percentage terms |
- Use spreadsheets to convert statements into percentages.
- Explore online resources like Mergent Online for guidance.
- Study advanced techniques such as ratio and trend analysis.

Continue Reading About Common Size Statement
What Is a Quarterly Report and Why Investors Should Care
How to Use Inventory Report for Better Business Decisions
How to Build a Service Report Template for Your Business
What Is a Research Report and Why Does It Matter


FAQ

The Author
Lewis
Senior Data Analyst at FanRuan
Related Articles

Financial Reporting Valuation Explained: A Practical Guide to ASC 820, ASC 805, ASC 350, and ASC 718
$1 valuation is the process companies use to measure assets, liabilities, equity instruments, and reporting units for compliant $1. For CFOs, controllers, finance directors, and audit facing accounting teams, the challen
Yida Yin
Jun 25, 2026

Best Ad Reporting Tool in 2026: 8 Options Compared for Marketers and Analysts
$1 is an $1 and dashboard platform that helps teams unify ad data, build highly customized reports, and automate distribution at scale. 8 ad reporting tool options compared 1. DashThis One sentence overview: DashThis is
Yida YIn
Jun 25, 2026
Office 365 Reporting Tool Guide: Track Usage, Security, and License Waste in One Dashboard
An office 365 $1 should do more than generate static usage charts. For IT managers, operations leaders, and Microsoft 365 administrators, the real value is operational visibility: who is actually using the platform, wher
Yida Yin
Jun 25, 2026