A profit and loss statement shows your business’s income, expenses, and overall performance. Understanding profit and loss helps you track financial health and spot trends before small issues become big problems. Many small business owners face challenges like inaccurate reporting, budgeting troubles, and cash flow issues, as shown below:
| Challenge | Description |
|---|---|
| Budgeting | Many small businesses either do not budget or create unrealistic budgets, leading to financial issues. |
| Limited Cash Flow | Healthy cash flow is crucial, yet many struggle due to poor budgeting and forecasting. |
| Reporting Issues | Inaccurate financial records can lead to incorrect revenue calculations and tax issues. |
| Tax Compliance | Filing taxes based on inaccurate records can result in penalties and missed deductions. |
| Inability to Pay Debts | Overextending financially makes it difficult for owners to manage and pay debts on time. |
| Commingling | Mixing personal and business funds complicates financial management and can lead to cash flow issues. |
| Marketing Costs | High marketing costs can strain budgets, requiring careful planning and creativity. |
| Unforeseen Expenses | Planning for unexpected costs is essential to maintain cash flow stability. |
Modern tools like FineReport can automate reporting and make your financial data easier to understand, helping you manage your business with confidence.

A profit and loss statement is a key financial document that summarizes your business’s total revenue, expenses, gains, and losses over a specific period. You use this statement to see if your business made a profit or loss during that time. In accounting, the profit and loss statement helps you understand the results of your operations. It shows whether your business activities generated net income or resulted in a loss.
You will find three main sections in every profit and loss statement: revenue, expenses, and net income. Revenue represents all the money your business earns from sales or services. Expenses include all the costs you incur to run your business, such as rent, salaries, and supplies. When you subtract expenses from revenue, you get net income. This figure tells you if your business is profitable.
A profit and loss statement gives you a clear view of your financial performance. You can track total revenue and see how much you spend on different expenses. This information helps you spot trends, control costs, and make better decisions. If you want to manage your business more efficiently, you need to understand how your profit and loss statement works.
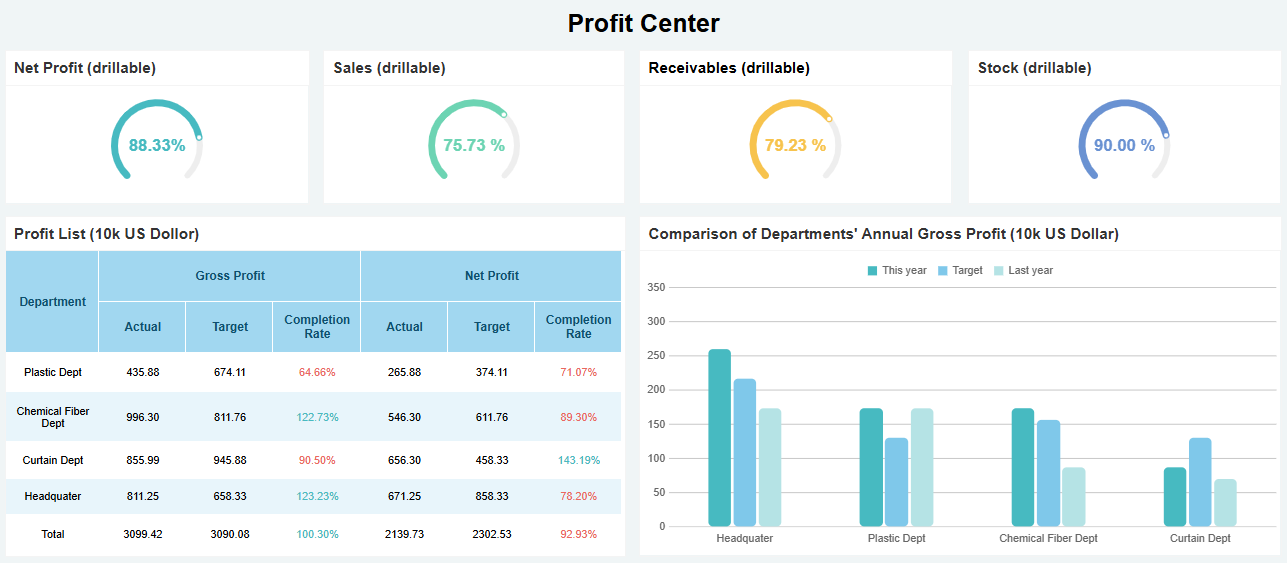
Modern tools like FineReport make it easier to create and analyze your profit and loss statement. FineReport automates the process, connects to your data sources, and generates accurate reports. You can visualize your revenue, expenses, and net income in real time, which helps you stay on top of your business finances.
You rely on your profit and loss statement for several important reasons:
Many people use the profit and loss statement, not just business owners. Internal management teams use it to evaluate performance and set goals. Investors and lenders look at your profit and loss statement to assess your business’s financial health. Company stakeholders analyze it to make strategic and budgeting decisions.
A profit and loss report provides a detailed view of your revenue and expenses. You can see how much money comes in and where it goes out. The statement shows your net income, which reflects how effective your operations and sales strategies are. This information is crucial for making informed decisions and adjusting your business strategies to improve financial health.
If you want to avoid common financial mistakes, you need to review your profit and loss statement regularly. It helps you catch issues early, such as rising expenses or declining revenue. With tools like FineReport, you can automate your financial reporting and gain deeper insights into your business performance. FineReport allows you to integrate data from multiple sources, visualize trends, and generate reports quickly. This makes it easier for you to manage your finances and plan for the future.
Tip: Reviewing your profit and loss statement each month helps you stay proactive. You can spot problems before they grow and make adjustments to keep your business on track.
Understanding the main sections of your profit and loss statement helps you see how your business performs. This key financial document breaks down revenue, expenses, and net income. Each part gives you important insights into your business’s financial health.
Revenue is the starting point of your profit and loss statement. You record all the money your business earns from selling products or providing services. This figure is often called sales, gross receipts, or fees. Revenue acts as the foundation for measuring your financial activities. You may see different categories of revenue, such as net sales of tangible products, service revenues, and income from rentals. The table below shows common revenue categories:
| Revenue Category | Description |
|---|---|
| Net sales of tangible products | Gross sales minus discounts and returns |
| Service revenues | Income from services rendered |
| Income from rentals | Earnings from rental activities |
| Other revenues | Miscellaneous income sources |
FineReport automates the collection and visualization of revenue data. You can connect your sales systems and see total revenue in real time. This helps you track trends and spot changes quickly.
Expenses represent the costs you pay to run your business. You include items like rent, salaries, supplies, and utilities in this section of your profit and loss statement. Expenses are usually grouped into categories, such as direct expenses, indirect expenses, and labor costs. The table below lists standard expense categories:
| Expense Category | Description |
|---|---|
| Accounting | Costs for accounting services and bookkeeping |
| Bank Charges | Fees for account services and transactions |
| Business Taxes | Local, county, or state taxes separate from income taxes |
| Computer Software | Subscription costs for business software |
| Charitable Contributions | Donations made by your business |
FineReport makes it easy to track and analyze expenses. You can automate expense reporting and visualize spending patterns. This helps you control costs and improve your profit and loss results.
Net income is the final result of your profit and loss statement. You calculate net income by subtracting all expenses from total revenue. The process involves several steps:
Net income shows whether your business made a profit or loss during the period. It provides a clear picture of your financial health. Lenders, investors, and managers use net income to assess performance and make decisions. FineReport visualizes net income trends, helping you compare results over time and identify areas for improvement.
Tip: Reviewing each section of your profit and loss statement regularly helps you understand your business’s strengths and weaknesses. FineReport's automated tools make this process faster and more accurate.

Creating a profit and loss statement gives you a clear picture of your business’s financial health. You can follow a straightforward process to prepare this essential report. Understanding how to do a profit and loss statement helps you track revenue, expenses, and net income, making it easier to manage your business and plan for growth.
You can prepare a profit and loss statement by following these steps:
Tip: Use a consistent process each time you prepare a profit and loss statement. This helps you compare performance across different periods.
You can use various templates to organize your profit and loss statement. Here are some common options:
| Template Name | Description |
|---|---|
| Free Small Business Profit and Loss Templates | Simple format for calculating income and expenses with flexible time frames. |
| Monthly Profit and Loss Template | Tracks monthly and year-to-date revenue and expenses, with visual graphs. |
| Annual Profit and Loss Template Sample | Pro forma income statement for yearly projections, includes sample data. |
| Quarterly Profit and Loss Statement | Records quarterly financial data, including revenue, expenses, and taxes. |
| Profit and Loss Dashboard Template | Monthly overview with charts for total income, expenses, and net revenue. |
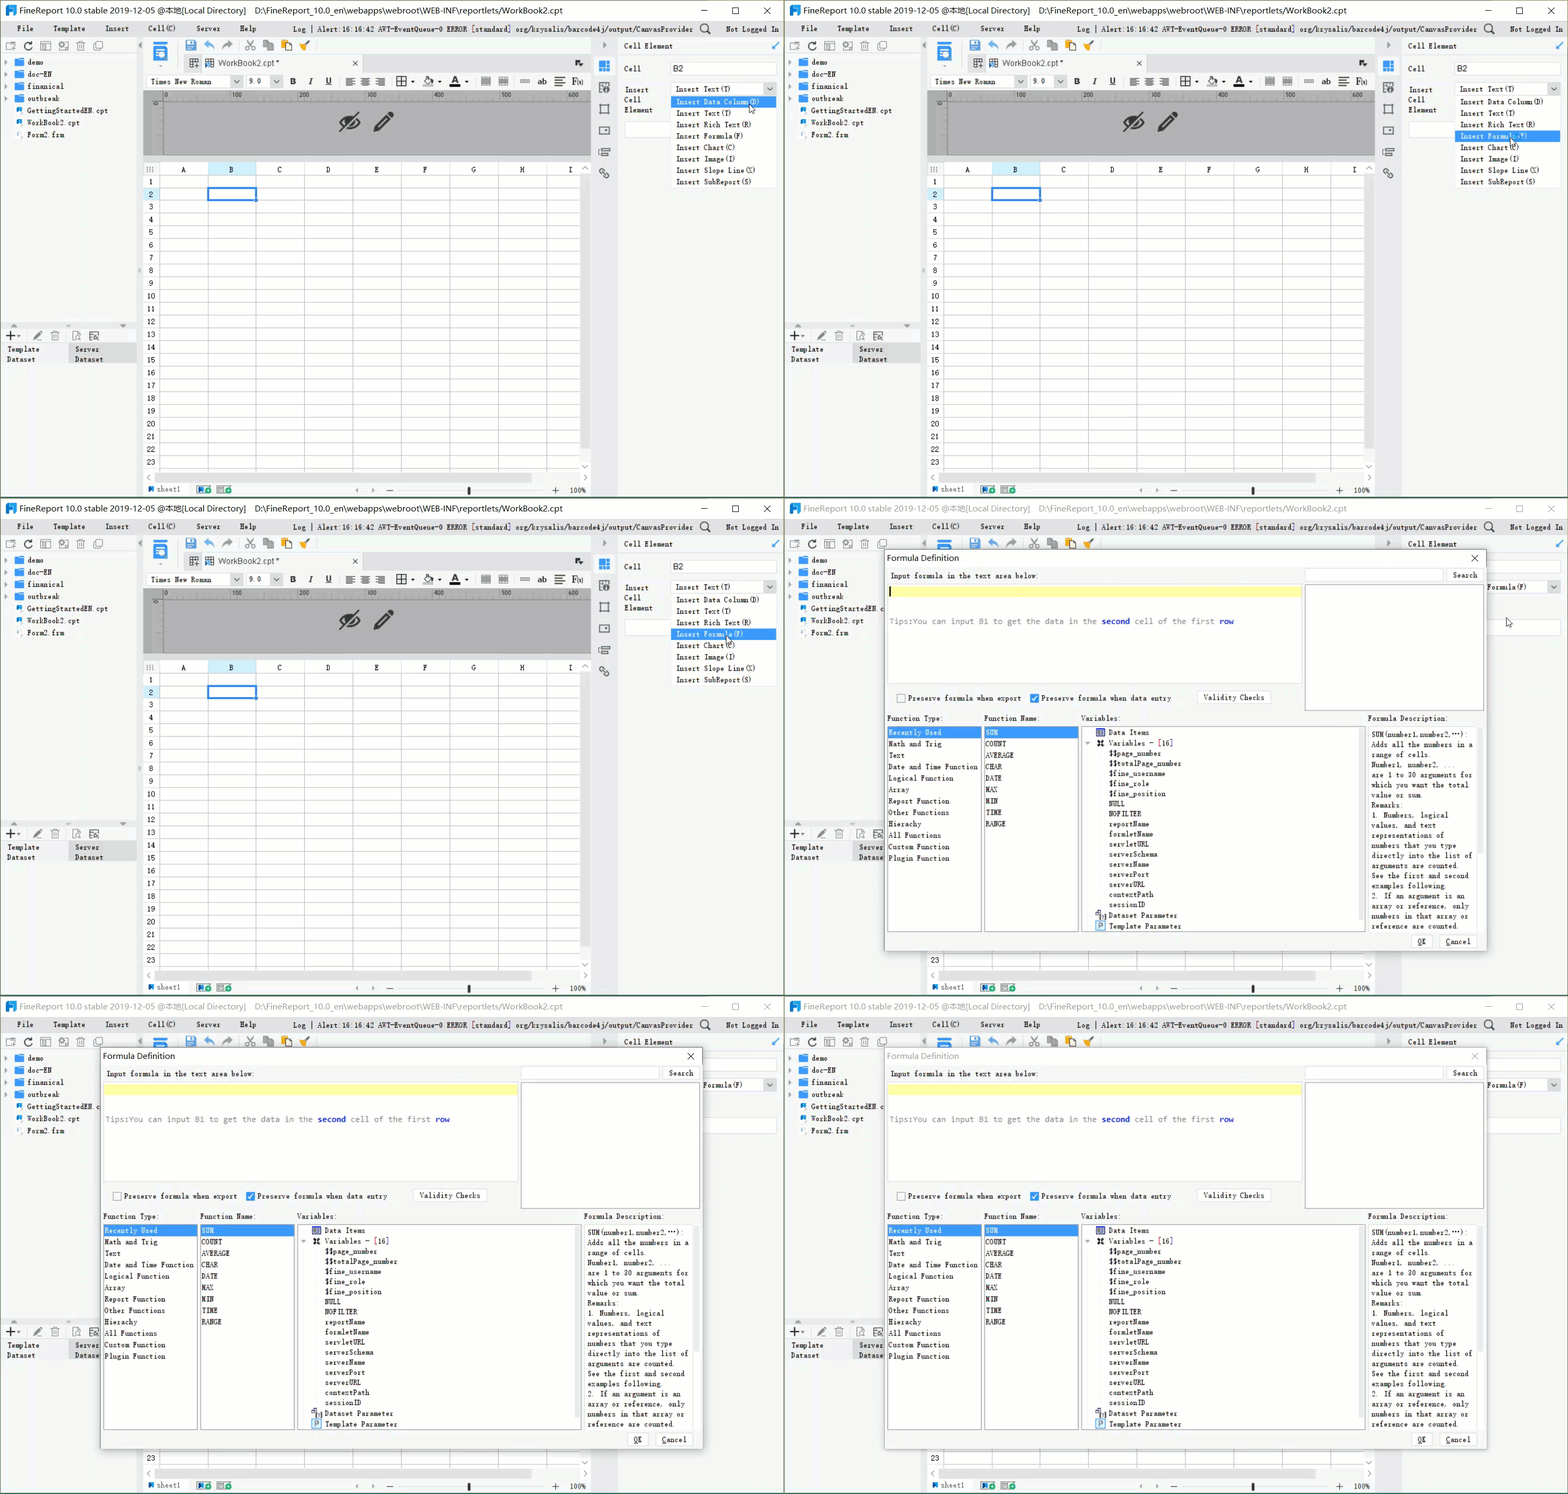
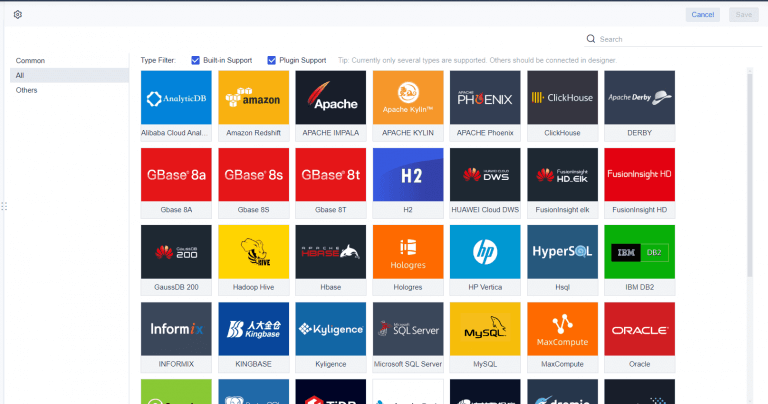
FineReport simplifies how to do a profit and loss statement. You can connect multiple data sources, automate calculations, and generate reports with a few clicks. FineReport’s drag-and-drop interface makes it easy to build custom templates that fit your business needs. You can also schedule automatic report generation, ensuring you always have up-to-date financial data.
Knowing how to read a p&l statement is just as important as preparing one. You need to interpret the numbers to understand your business’s performance and make informed decisions.
Follow these tips to read and analyze your profit and loss statement:
When you analyze your profit and loss statement, focus on both revenue and expenses. Look for patterns in income and spending. Identify areas where costs are rising or revenue is falling. Understanding these trends helps you make better decisions and improve your business’s financial health.
Note: Analyzing revenue streams and cost structures is key to understanding your profit and loss report. Break down income sources and distinguish between fixed and variable expenses for a clearer view of your business.
FineReport enhances your ability to read and interpret your profit and loss statement. The platform integrates data from different systems, automates report creation, and provides real-time visualizations. You can quickly spot changes in revenue, expenses, and net income. FineReport’s unified data platform eliminates data silos, making it easier to access and analyze your financial information. Automated scheduling and seamless integration with your business systems ensure you always have accurate, up-to-date reports.
| Feature | Description |
|---|---|
| Unified Data Platform | Integrates data from various business systems for quick, flexible reporting. |
| Enhanced Efficiency | Automates report generation, reducing manual effort and errors. |
| Seamless Integration | Connects with multiple systems to improve data accessibility and analysis. |
If you want to improve your financial management, learning how to do a profit and loss statement and how to read a p&l statement is essential. FineReport gives you the tools to automate, visualize, and understand your income statement, helping you make smarter business decisions and track your performance over time.
You can use your profit and loss statement to evaluate business performance and guide important decisions. This report gives you a clear view of revenue, expenses, and net income over time. By tracking these numbers, you see how your business performance compares to previous periods and industry benchmarks. Investors and managers often compare your profit and loss statement to industry standards to check if your projections are realistic. Benchmarks help you track growth and adjust strategies as needed.
| Metric | Description |
|---|---|
| Revenue | Total income from sales in a period. |
| Gross Margin | Profitability after costs, showing financial health. |
| Contribution Margin | Profit left after variable costs, useful for scalability analysis. |
| Net Income | Overall profitability, showing how much revenue exceeds expenses. |
| EBITDA | Operational efficiency, excluding non-operational items from net income. |
Regularly reviewing these metrics helps you spot trends and make informed decisions to improve business performance.
Many business owners make common mistakes when preparing or interpreting a profit and loss statement. These errors can distort your view of financial performance and lead to poor decisions.
Other frequent errors include misclassifying expenses, ignoring seasonal trends, and incorrectly accounting for owner draws. To avoid these mistakes, maintain accurate records, classify revenues and expenses properly, and audit your statements regularly.
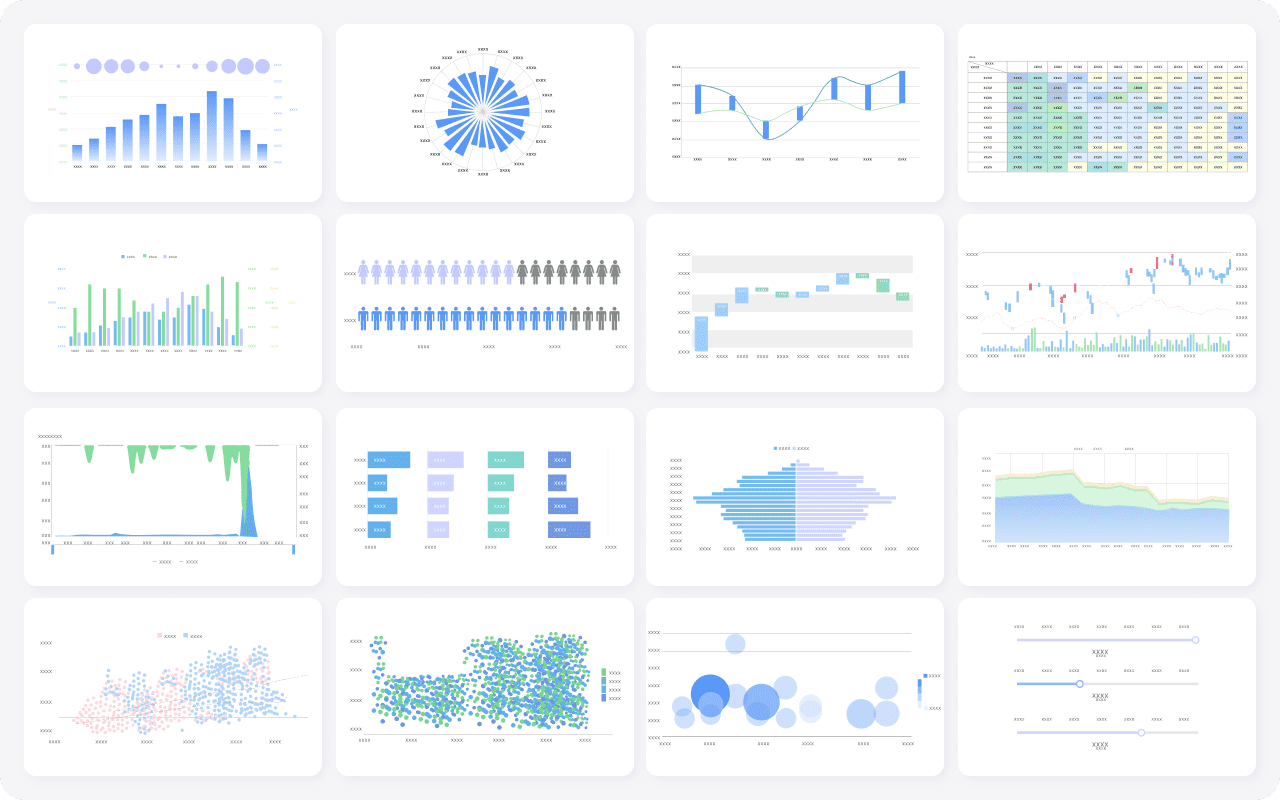
After you understand your profit and loss statement, you can use modern tools to manage your finances more effectively. FineReport offers a user-friendly design that lets you create complex reports with drag-and-drop simplicity. You can integrate data from multiple sources, centralize your business data, and analyze revenue, expenses, and net income in one place. FineReport supports rich chart analysis and custom reporting, making it easier to interpret your profit and loss report and improve business performance.
In the finance industry, companies like Founder Securities have used data-driven solutions to transform their operations. By adopting advanced reporting tools, they improved efficiency and made better decisions based on real-time financial performance. FineReport empowers you to do the same, helping you avoid common mistakes and make smarter choices for your business.
Understanding your profit and loss statement gives you a clear view of your business’s financial health. When you analyze your financial statements, you gain insights that help you make better decisions and improve performance. You can:
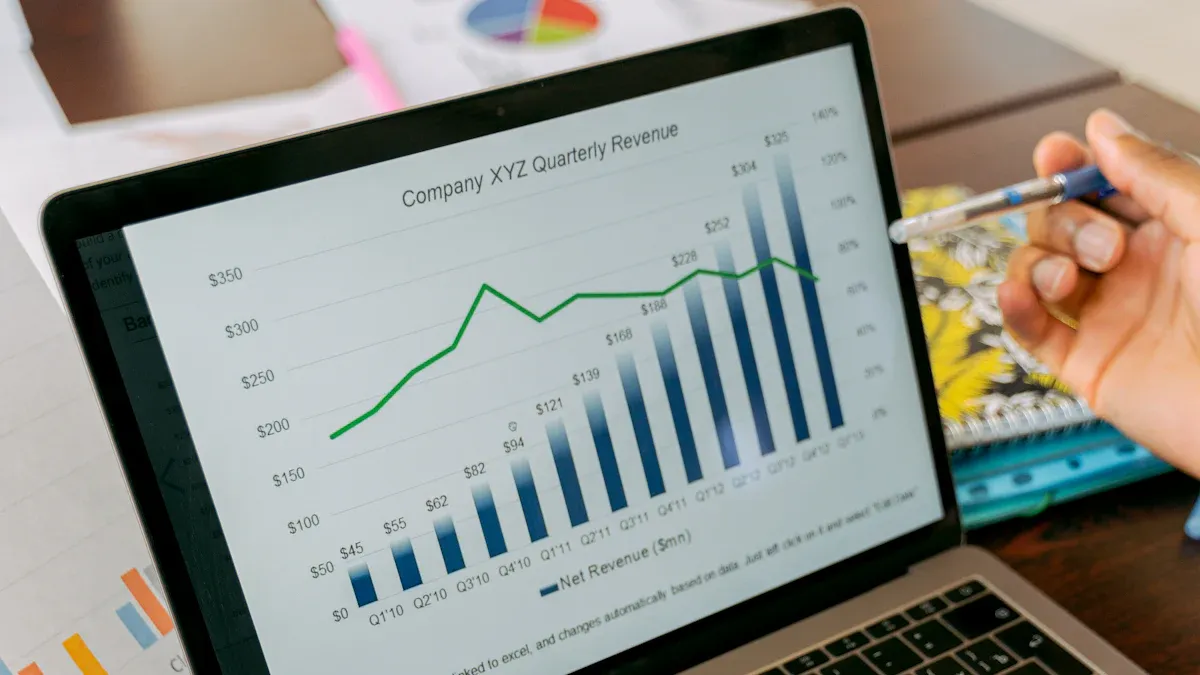
Automated tools like FineReport simplify financial statement creation and reporting. The platform connects to real-time data, offers customizable templates, and reduces manual effort. You save time, improve accuracy, and scale easily as your business grows. Small businesses benefit from cost efficiency, compliance, and smarter decisions. Start using FineReport to automate your quarterly profit and loss statement and manage your profit and loss with confidence.
What Is a Quarterly Report and Why Investors Should Care
How to Use Inventory Report for Better Business Decisions
How to Build a Service Report Template for Your Business
What Is a Research Report and Why Does It Matter

The Author
Lewis
Senior Data Analyst at FanRuan
Related Articles

Top 10 Best Automation Reporting Tool Picks for Businesses
Compare the top 10 best automation reporting tool options to streamline business data, automate reports, and boost decision-making efficiency.
Lewis
Jan 03, 2026
Top 10 Reporting Systems and Tools for Businesses
See the top 10 reporting systems that help businesses automate data, build dashboards, and improve decision-making with real-time analytics.
Lewis
Jan 03, 2026
What is integrated reporting and why is it important
Integrated reporting combines financial and non-financial data, offering a full view of value creation, transparency, and stakeholder trust.
Lewis
Dec 12, 2025