Sales mix refers to the proportion of each product or service you sell compared to your total sales. This simple concept holds major importance for your business. By understanding your sales mix, you can see which items drive profit and which may need improvement. Market Mix Modeling gives you data-driven insights, helping you adjust pricing, promotions, and resources for better results. Many companies use tools like FineBI from FanRuan to visualize and analyze their sales mix in real time. As you read, consider how your own sales mix shapes your business’s success.
You need to understand the definition of sales mix to make better business decisions. Sales mix refers to the relative proportion of different products or services you sell compared to your total sales. Leading business organizations define sales mix as the calculation that determines the share of each product in your overall sales. This concept matters because each product or service often has a different profit margin. When you change your sales mix, you can directly impact your company’s profitability.
For example, if you run a hardware store, you might sell both lawnmowers and hammers. If hammers have a higher profit margin, increasing their share in your sales mix can boost your net income. In product-based businesses, you focus on sales volume, contribution margin, and inventory costs. In service-based businesses, you look at the mix of services sold and their financial contribution, since inventory is not a factor.
Sales mix analysis helps you identify which products or services drive your profits. By tracking the sales mix, you can shift your focus to higher-margin items and plan your business to reach your target net income. Investors and analysts also use sales mix data to assess your company’s growth and profitability.
Sales mix percentage shows you the exact share each product or service has in your total sales. You calculate the sales mix percentage by dividing the unit sales of a specific product by the total unit sales of all products, then multiplying by 100. This calculation works for both sales volume (units sold) and sales revenue.
Let’s look at a simple example of sales mix in action. Imagine you own a furniture store that sells ergonomic chairs and modular desks. In one month, you sell 100 chairs and 200 desks. Here’s how you calculate the sales mix percentage for each product:
| Product | Unit Sales | Total Unit Sales | Sales Mix Percentage Calculation | Sales Mix % |
|---|---|---|---|---|
| Ergonomic Chairs | 100 | 300 | (100 ÷ 300) × 100 | 33.33% |
| Modular Desks | 200 | 300 | (200 ÷ 300) × 100 | 66.67% |
You see that modular desks make up 66.67% of your sales, while ergonomic chairs account for 33.33%. This sales mix percentage helps you understand which products contribute most to your business.
Small and medium-sized enterprises use sales mix calculations to analyze product performance and improve profitability. For instance, a company selling wired and Bluetooth speakers will compare profit margins and sales mix percentages to decide where to focus marketing and resources. A smartphone company might plan its sales mix as 20% low-margin models, 50% medium-margin, and 30% high-margin, using these percentages to forecast profits and adjust strategies.
Tip: Tracking your sales mix percentage regularly helps you spot trends and make quick adjustments to your product mix.
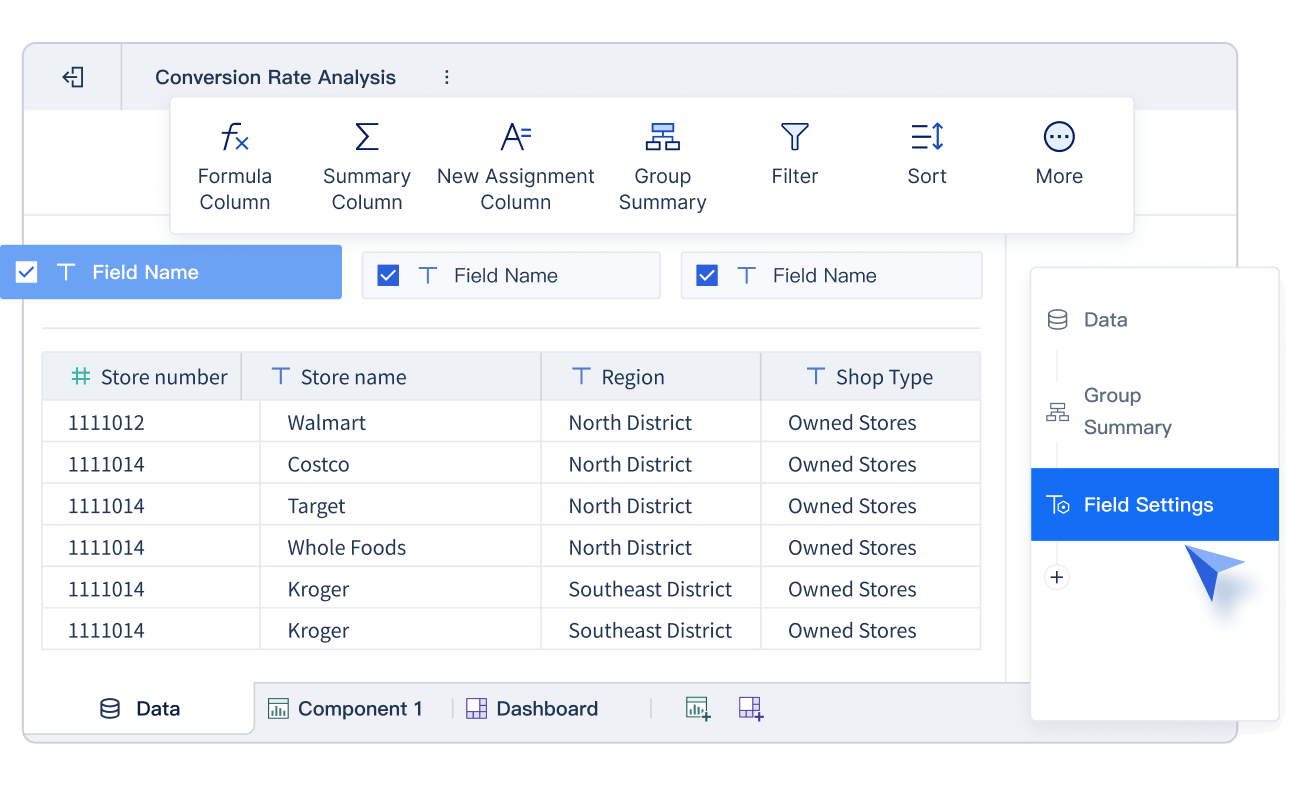
Data analytics tools like FineBI from FanRuan make it easy to centralize and visualize your sales mix data. With FineBI, you can:

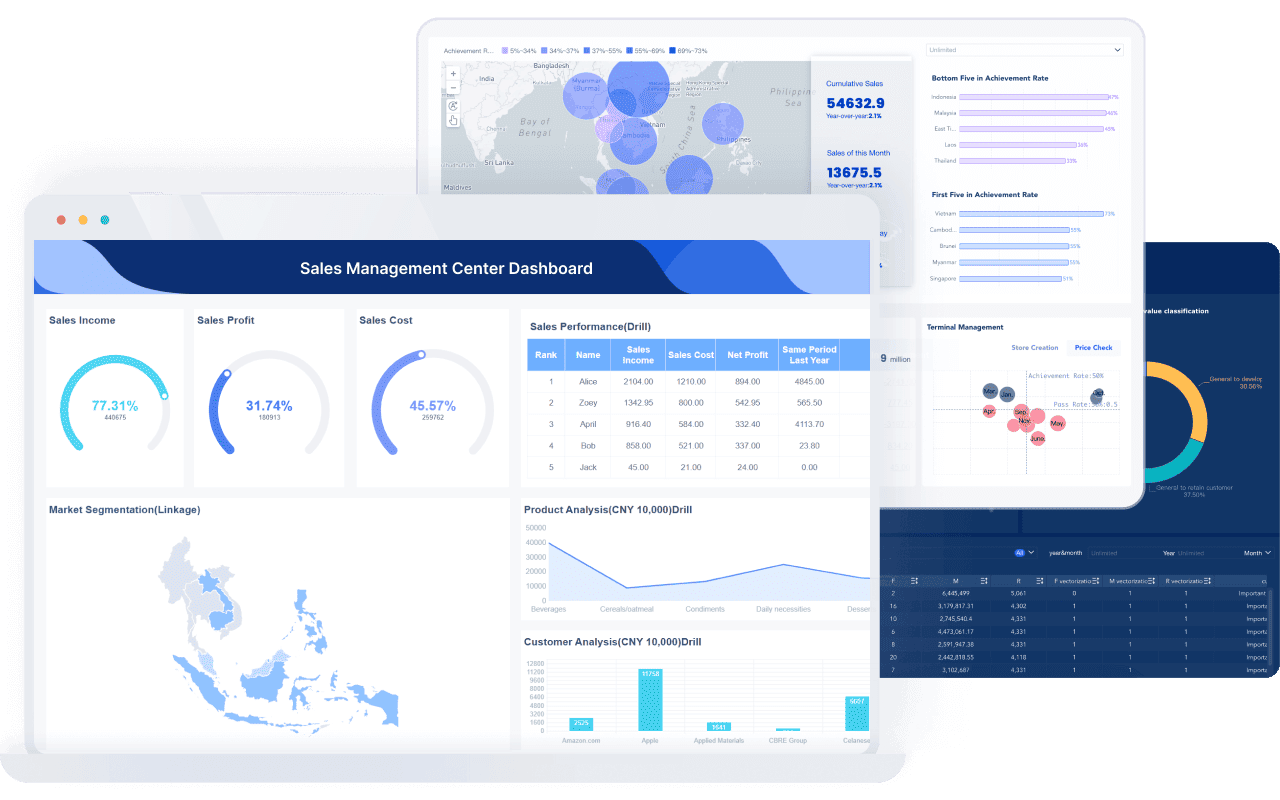
FineBI helps you see your sales mix at a glance, so you can act quickly and confidently to improve your business results.
Understanding the importance of analyzing sales mix gives you a clear advantage in managing your company profit. Each product or service you offer has a different profit margin. When you analyze your sales mix, you see which items bring higher returns and which ones may need improvement. Shifting your focus to products with a higher sales mix contribution margin can increase your overall company profit.
Changes in your sales mix can have a direct impact on profitability. For example, if you sell more high-margin products, your gross profit margin improves. If low-margin items dominate your sales, your profits may suffer. Regularly reviewing your sales mix variance helps you spot these trends early. You can then adjust your pricing or marketing strategies to promote items that boost your bottom line.
Note: Sales mix variance measures the difference between your expected and actual sales mix. This variance shows how changes in your product mix affect your revenue and profit margin.
Analyzing sales mix data also helps you identify underperforming products. When you compare actual sales proportions to your targets, you can see which items contribute less to profitability. You may decide to discontinue or revamp these products. This approach ensures your resources go to products with different degrees of profitability, maximizing your returns.
If you fail to analyze your sales mix regularly, you risk missing out on profitable opportunities. You may overlook negative trends in price or volume that reduce your gross profits. This oversight can lower your operating income and reduce your Return on Sales (ROS). By staying on top of your sales mix variance, you protect your financial health and keep your business competitive.
Analyzing your sales mix plays a key role in strategic planning and resource allocation. You need to know which products drive your sales and which ones lag behind. This knowledge allows you to make informed decisions about where to invest your time and money.
Large organizations often use frameworks like the BCG Matrix to categorize products based on market share and growth. You can group your offerings into Cash Cows, Stars, Question Marks, and Dogs. This method helps you decide where to invest, optimize, or divest. By aligning your resources with market opportunities, you improve your return on investment and avoid wasting effort on low-performing items.
Sales mix variance analysis gives you a clear picture of which products generate the highest sales mix contribution margin. You can focus your marketing and sales efforts on these items. At the same time, you can identify products that underperform and decide whether to improve or discontinue them. This process supports dynamic and efficient strategic planning.
Tip: Regular sales mix analysis helps you adapt quickly to market trends and customer preferences. You can maintain customer satisfaction and stay ahead of competitors.
FineBI from FanRuan makes analyzing sales mix data simple and effective. With FineBI, you can:
By using FineBI, you gain instant access to the insights you need for better business decisions. You can spot trends, adjust your strategies, and ensure your sales mix always supports your goals.
Also, You can join our upcoming FanRuan webinar series on Data Storytelling, where we’ll go beyond metrics and dashboards to explore how to:
Conduct meaningful cost analysis with context
Interpret gross profit and cost metrics correctly
Visualize and present your findings using real-world BI tools
Use data storytelling to justify strategic decisions
Prepare your data for AI-driven insights
Whether you're an analyst looking to improve your cost reporting or a business leader driving budget decisions, this session will give you the tools and mindset to turn cost data into a clear, actionable narrative.
And of course, you'll see how FineBI helps bring your cost analysis to life through smart dashboards, dynamic charts, and story-ready visuals.
You can calculate your sales mix using two main approaches: by units sold or by revenue. The sales mix formula for units is simple. Divide the number of units sold for a product by the total units sold for all products, then multiply by 100. This gives you the sales mix percentage for each item. For revenue, use the sales revenue of a product divided by total sales revenue, then multiply by 100. Both methods help you see how much each product contributes to your overall sales.
The sales mix percentage shows the share of each product in your total sales. This number helps you understand which products drive your business.
Here are the formulas:
(Units Sold of Product ÷ Total Units Sold) × 100(Sales Revenue of Product ÷ Total Sales Revenue) × 100You should use the sales mix formula regularly to track changes and spot trends. If your planned sales mix changes, your profitability and break-even points will shift as well. Always compare your actual sales mix percentage to your planned sales mix to measure sales mix variance. This helps you see if your sales strategies work as expected.
Let’s walk through a step-by-step example. Imagine you sell three products: A, B, and C. Last month, you sold 200 units of A, 300 units of B, and 500 units of C. Your total units sold are 1,000.
| Product | Units Sold | Sales Mix Percentage Calculation | Sales Mix Percentage |
|---|---|---|---|
| A | 200 | (200 ÷ 1,000) × 100 | 20% |
| B | 300 | (300 ÷ 1,000) × 100 | 30% |
| C | 500 | (500 ÷ 1,000) × 100 | 50% |
You see that product C has the highest sales mix percentage. If your planned sales mix was different, you can now calculate the sales mix variance by comparing actual and planned percentages. This variance tells you if your sales focus needs to change.
Tip: Many businesses make mistakes by ignoring fixed or variable costs, or by assuming the sales mix percentage stays the same. Always update your calculations when prices or costs change.
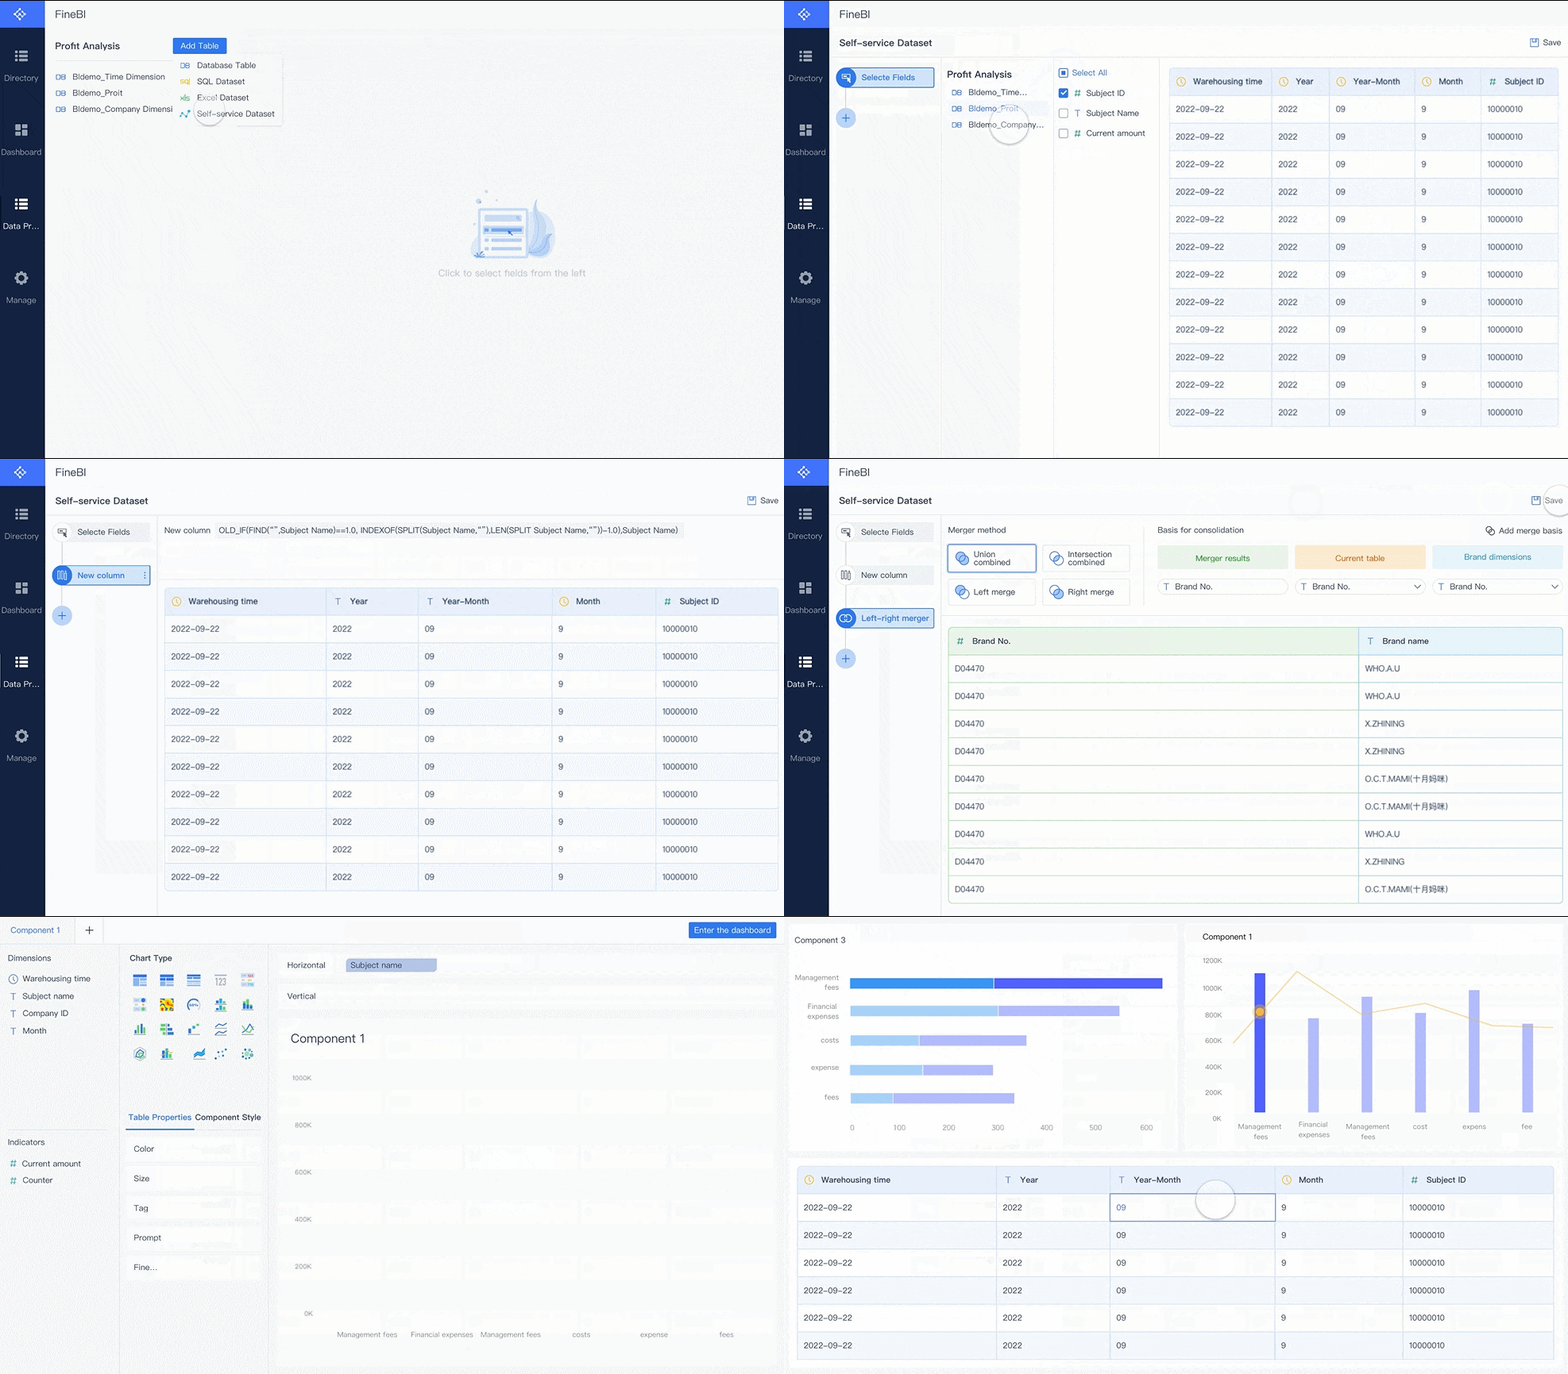
FineBI from FanRuan can automate these calculations for you. You can connect your sales data, set up dashboards, and see your sales mix percentage in real time. FineBI lets you visualize sales mix variance, track planned sales mix, and adjust your strategies quickly. This saves you time and helps you avoid errors in your sales mix analysis.

You can use data-driven analysis to improve your sales mix and reach your sales goals. Marketing Mix Modeling helps you see which marketing channels drive the most sales and profit margin. For example, you might find that paid search ads bring more sales than display ads. This lets you shift your budget to the best channels and increase your sales mix contribution margin. Companies like PUMA and Babymarkt have used real-time analytics and predictive models to boost sales and improve their product mix. When you use high-quality, integrated data, you can respond quickly to changes in demand and focus on higher-margin products. FineBI from FanRuan gives you self-service dashboards and real-time insights. You can drag and drop to create custom dashboards, drill down into sales data, and track profit margin for each product. This helps you spot trends and adjust your strategy fast.

You can use marketing campaigns and incentives to shift your sales mix toward high-profit products. Discounts, cashback, referral bonuses, and loyalty points encourage customers to try new items and buy more. These programs help you increase sales volume and improve your sales mix contribution margin. Incentives also build customer loyalty, leading to repeat purchases and a better profit margin. Digital platforms let you track results in real time and adjust your campaigns for the best outcome. When you collect customer data from these programs, you gain insights that help you refine your product mix and marketing strategy. Incentive marketing also sets your brand apart and attracts new customers, which supports your sales goals.
You need to review your sales mix regularly to keep your business strong. Start by checking key metrics like sales volume, revenue, profit margin, and customer satisfaction. Compare your products to competitors and look for gaps in your offerings. Test changes with A/B testing or pilot programs before making big moves. Remove products that do not meet your profit margin targets or sales mix contribution margin. Replace them with items that better fit your customers’ needs. Keep an eye on market trends and customer feedback to stay ahead of demand. Use FineBI to organize your findings into clear reports. This ongoing process helps you maintain an optimal sales mix and enjoy the benefits of optimizing sales mix, such as higher profits and better customer satisfaction.
Tip: Seasonal trends can affect your sales mix. Use historical sales data to adjust your inventory and promotions based on changing demand.
You can drive increased revenue and achieve improved market positioning by regularly analyzing your product performance and adjusting your strategies. Using tools like FineBI from FanRuan helps you spot trends, measure results, and make informed decisions. When you focus on high-value customers and optimize your product mix, you see enhanced customer satisfaction and long-term business growth. Keep reviewing your data, test new approaches, and use business intelligence to stay ahead in a changing market.
Click the banner below to try FineBI for free and empower your enterprise to transform data into productivity!
Unlocking Business Success with the AARRR Metrics Framework
What is Pareto Chart and How Does it Work
Essential Tips for Successful Customer Behavior Analysis
Making Metric Conversion Chart Easy for Everyday Life
What is Cost Analysis and Why Does It Matter in Business
What Is Sales Revenue and Why Is It Important for Businesses

The Author
Lewis
Senior Data Analyst at FanRuan
Related Articles

Self-Service Analytics Defined and Why You Need It
Self-service analytics lets you analyze data without IT help, empowering faster, data-driven decisions and boosting agility for your business.
Lewis
Jan 04, 2026

Best Self-Service Tools for Analytics You Should Know
See which self-service tools for analytics let business users access data, build dashboards, and make decisions faster—no IT help needed.
Lewis
Dec 29, 2025

Understanding Predictive Analytics Services in 2026
Predictive analytics services use data and AI to forecast trends, helping businesses make informed decisions, reduce risks, and improve efficiency in 2026.
Lewis
Dec 30, 2025