A data analytics strategy is a comprehensive, long-term plan for how an organization collects, manages, analyzes, and uses data to achieve specific business goals, ensuring people, processes, and technology align to turn raw data into actionable insights for better decisions, efficiency, and innovation. How to create a data analytics strategy for your business means building a plan that helps you use data to drive growth and gain an edge in your industry. You need to set clear goals, use the right tools, and make sure your team can turn data into real business value.
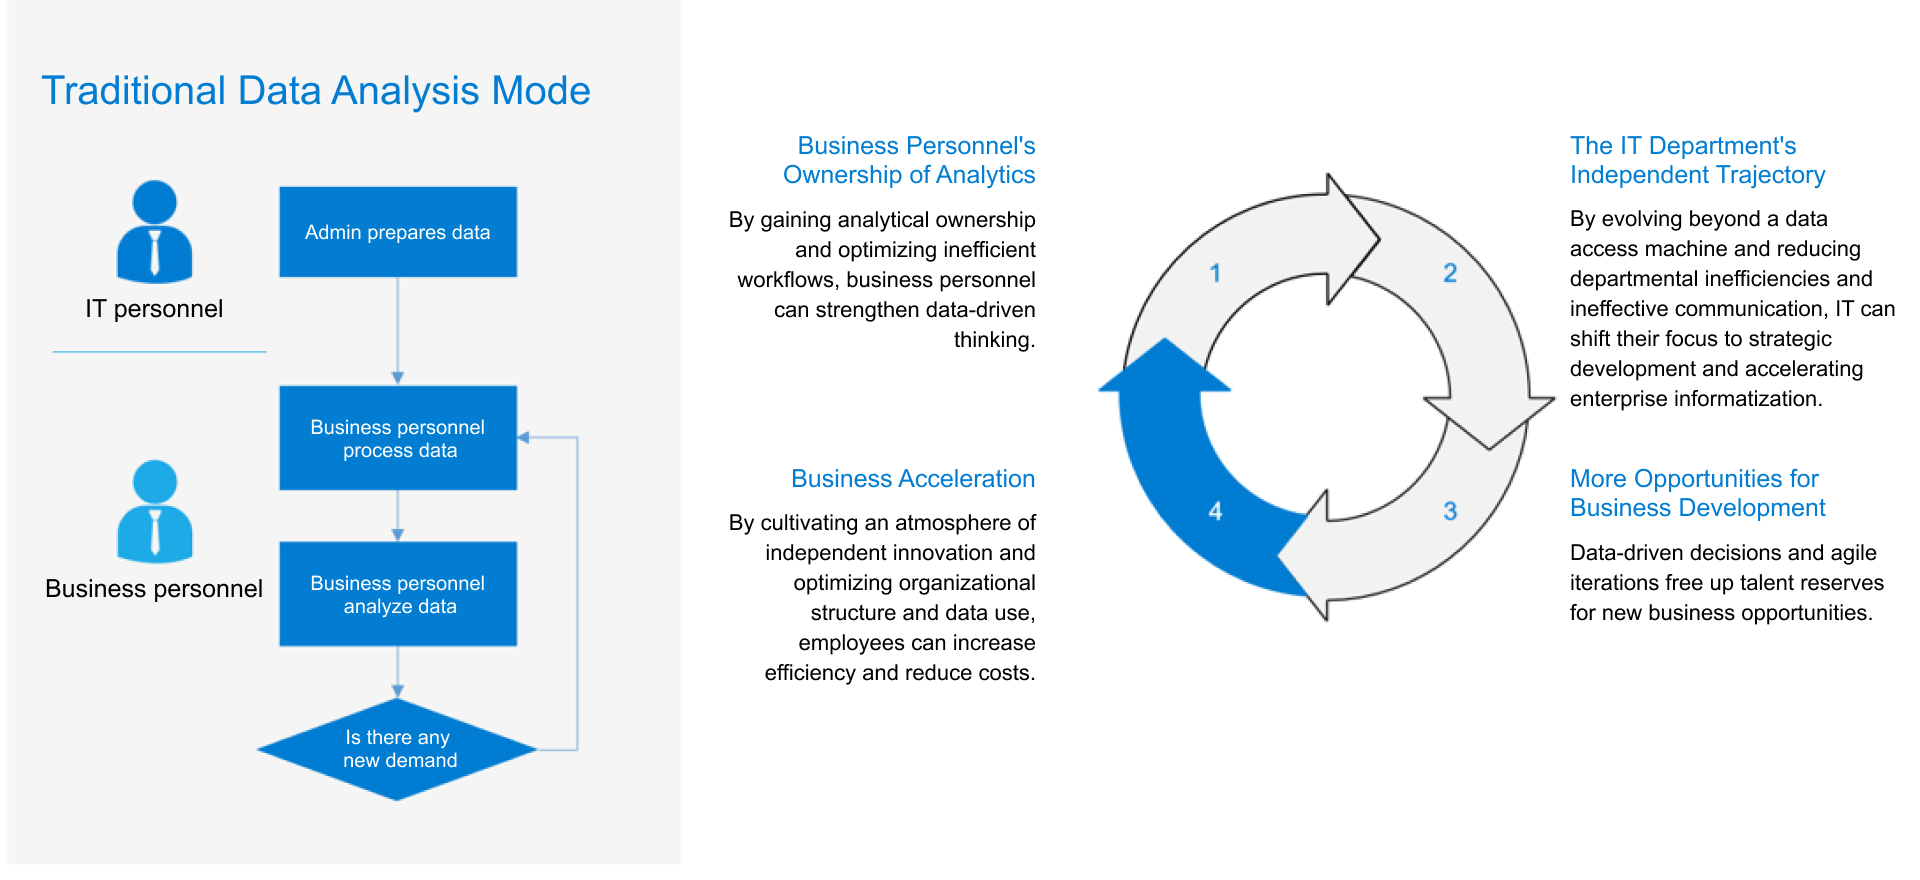
You move from old, IT-led reporting to a modern approach where you and your team use self-service analytics. This shift gives you control and speeds up decision-making, but it also brings new challenges.
- More businesses want tools that work for everyone, not just technical experts.
- The pandemic increased investments in self-service analytics tools.
- The market for these tools is growing fast, with a projected 15% annual growth rate.
- Companies need better data access and analytics to keep up with change.
| Challenge | Description |
|---|---|
| Eliminating data silos | Data silos block access and make it hard to manage and trust your data. |
| Navigating business risk management | You must trust your data. Wrong data can lead to mistakes in decision-making and taking action. |
| Keeping costs under control | Without control, you may waste resources by running duplicate reports or queries. |
| Maintaining high employee productivity | A messy data environment can lower morale and reduce productivity. |
| Avoiding chaos in data and reports | Poor control leads to confusion, making it hard to find and use the right information. |
When you align your analytics strategy with business objectives and use tools like FineBI, you empower your team to take action. A strong data analytics strategy gives you the foundation for smarter, faster decisions.
Define Business Goals for Your Data Analytics Strategy
Identify Key Objectives
You start your data strategy by identifying what matters most to your business. Clear objectives give your data analytics strategy direction and purpose. Many organizations focus on goals such as revenue growth, risk reduction, and customer experience improvement. You can see common objectives and related data initiatives in the table below:
| Business Objective | Data Initiative Examples |
|---|---|
| Revenue Growth | Customer 360, Churn Prediction |
| Risk Reduction | Supply Chain Optimization |
| Customer Experience Improvement | High-value use cases prioritization |
You may also want to increase customer retention, lower churn, or optimize and automate operations. When you define your analytics strategy, you set the foundation for your data strategy roadmap.
Align Analytics with Business Needs
You need to make sure your data strategy supports your business needs. Engage with decision-makers to understand their biggest challenges. Aligning analytics with business goals improves adoption and increases ROI. When your data strategy matches your business strategy, you can pursue new value sources and drive innovation. A recent study found that 63% of top Chief Data Officers align their data strategy with business strategy, which leads to better results. Many business leaders attribute new revenue opportunities to data and analytics initiatives. When you democratize data access, you help your team take action and innovate.
- Improved adoption of analytics solutions
- Increased ROI for analytics initiatives
- Reduced resources spent on change management
Set KPIs and Milestones
You need to create and test goals that are measurable. Set clear KPIs and milestones that align with your business objectives. Make sure all team members know the KPIs. Hold monthly meetings to review progress and discuss improvements. Adjust your KPIs as your business evolves. This approach keeps your data strategy roadmap relevant and focused. Regular reviews help you measure the ROI of your data analytics strategy and ensure you are taking action based on real results.
Tip: Involve stakeholders from different departments to refine your KPIs and share results using clear reports and visualizations.
Build Your Team and Data Analytics Strategy

Assign Roles and Responsibilities
You need a strong team to support your data strategy. Start by defining clear roles. Each member should bring a unique skill set to your analytics strategy. Use the table below to guide your team structure:
| Role | Description |
|---|---|
| Technical Proficiency | Mastery of statistical methods, programming languages, and analytical tools relevant to their role. |
| Business Understanding | Clear understanding of how the organization creates value and serves customers. |
| Communication and Storytelling | Ability to translate technical findings into compelling business narratives. |
| Problem-Solving and Critical Thinking | Navigate ambiguous challenges and develop creative solutions. |
| Collaboration and Relationship Building | Work effectively across organizational boundaries and partner with stakeholders. |
You empower your team when you assign responsibilities based on these strengths. FineBI's self-service analytics features let business users perform analysis independently, reducing the need for IT support and speeding up action.
Upskill for Data-Driven Decision-Making
You must invest in training to build a data-driven decision-making culture. Tailored training programs help your team gain hands-on experience with data tools and methods. These programs should match your business goals and industry needs. When you hire for the right skills, you close talent gaps and align your workforce with your data strategy. Data-driven development improves retention and performance. It also creates a strong talent pipeline and connects training to measurable outcomes. As your team grows, you see better results in customer experience and business performance.
Foster Collaboration Across Departments
You drive success when you break down silos and encourage cross-departmental teamwork. Collaboration leads to faster innovation and higher productivity. For example, companies like Salesforce and TRG saw improved product adoption and a 76% increase in productivity by aligning goals and sharing resources.
Collaboration isn’t a "soft" cultural value—it’s a hard driver of growth.
You can embrace a "One Company" mindset, foster empathy through cross-training, and align metrics across teams. This approach ensures your data strategy supports every part of your business, making it easier to take action and improve decision-making.
FineBI For Data Analytics Strategy
A strong data strategy depends on how well you integrate and prepare your data. When you learn how to create a data analytics strategy for your business, you must connect diverse data sources, cleanse and process your data, and create self-service datasets. FineBI gives you the tools to do this efficiently, helping you take action and drive results.
Connect Diverse Data Sources
You need to assess the different data sources your business uses. FineBI supports over 60 connectors, making it easy to bring together data from databases, cloud warehouses, big data platforms, and files. You can connect to MySQL, Oracle, SQL Server, Hadoop, Spark, and more. You also upload Excel or CSV files and link to APIs for real-time data. FineBI’s flexible integration options let you unify data from sales, finance, HR, and operations.
FineBI stands out for big data integration. You get powerful analytics tools that improve efficiency by at least 50% compared to traditional methods. You process and verify data in real time, which helps you clarify business context quickly. The table below compares FineBI with other BI tools:
| Feature | FineBI | Microsoft Power BI |
|---|---|---|
| Big Data Analytics | Powerful big data analytics tool for everyone. | Comprehensive analytics capabilities. |
| Efficiency | Improves efficiency by at least 50% compared to traditional data analysis. | Varies based on data size and complexity. |
| Real-time Data Processing | Feedback and verify data processing results in real time. | Limited real-time capabilities. |
| Business Context Clarification | Clarifies the business context at one time. | Requires additional setup for context. |
When you connect all your data sources, you build a foundation for your data strategy. You make it easier for your team to access the information they need and start taking action.
Cleanse and Process Data
Clean data is essential for a successful data strategy. FineBI provides user-friendly tools for data cleansing and processing. You do not need coding skills to use these features. You can organize, clean, and refine your data before analysis.
Common data cleansing techniques in FineBI include:
| Technique | Description |
|---|---|
| Handling Null Values | Methods to deal with null values, including ignoring, filtering, or labeling them for analysis. |
| Adjusting Fields | Organizing data by deleting unnecessary columns, converting field types, and renaming fields. |
| Deleting Duplicate Rows | Functionality to remove duplicate entries to ensure data uniqueness. |
You handle null values by ignoring, filtering, or labeling them. You adjust fields by deleting unnecessary columns, converting field types, and renaming fields. You delete duplicate rows to ensure your data is unique. These steps help you avoid errors and improve the quality of your analysis.
FineBI also supports ETL and ELT processes. You extract, transform, and load data from multiple sources. You can preview your changes at any time, which helps you catch mistakes early. Clean and processed data gives you confidence in your analytics strategy and supports better decision-making.
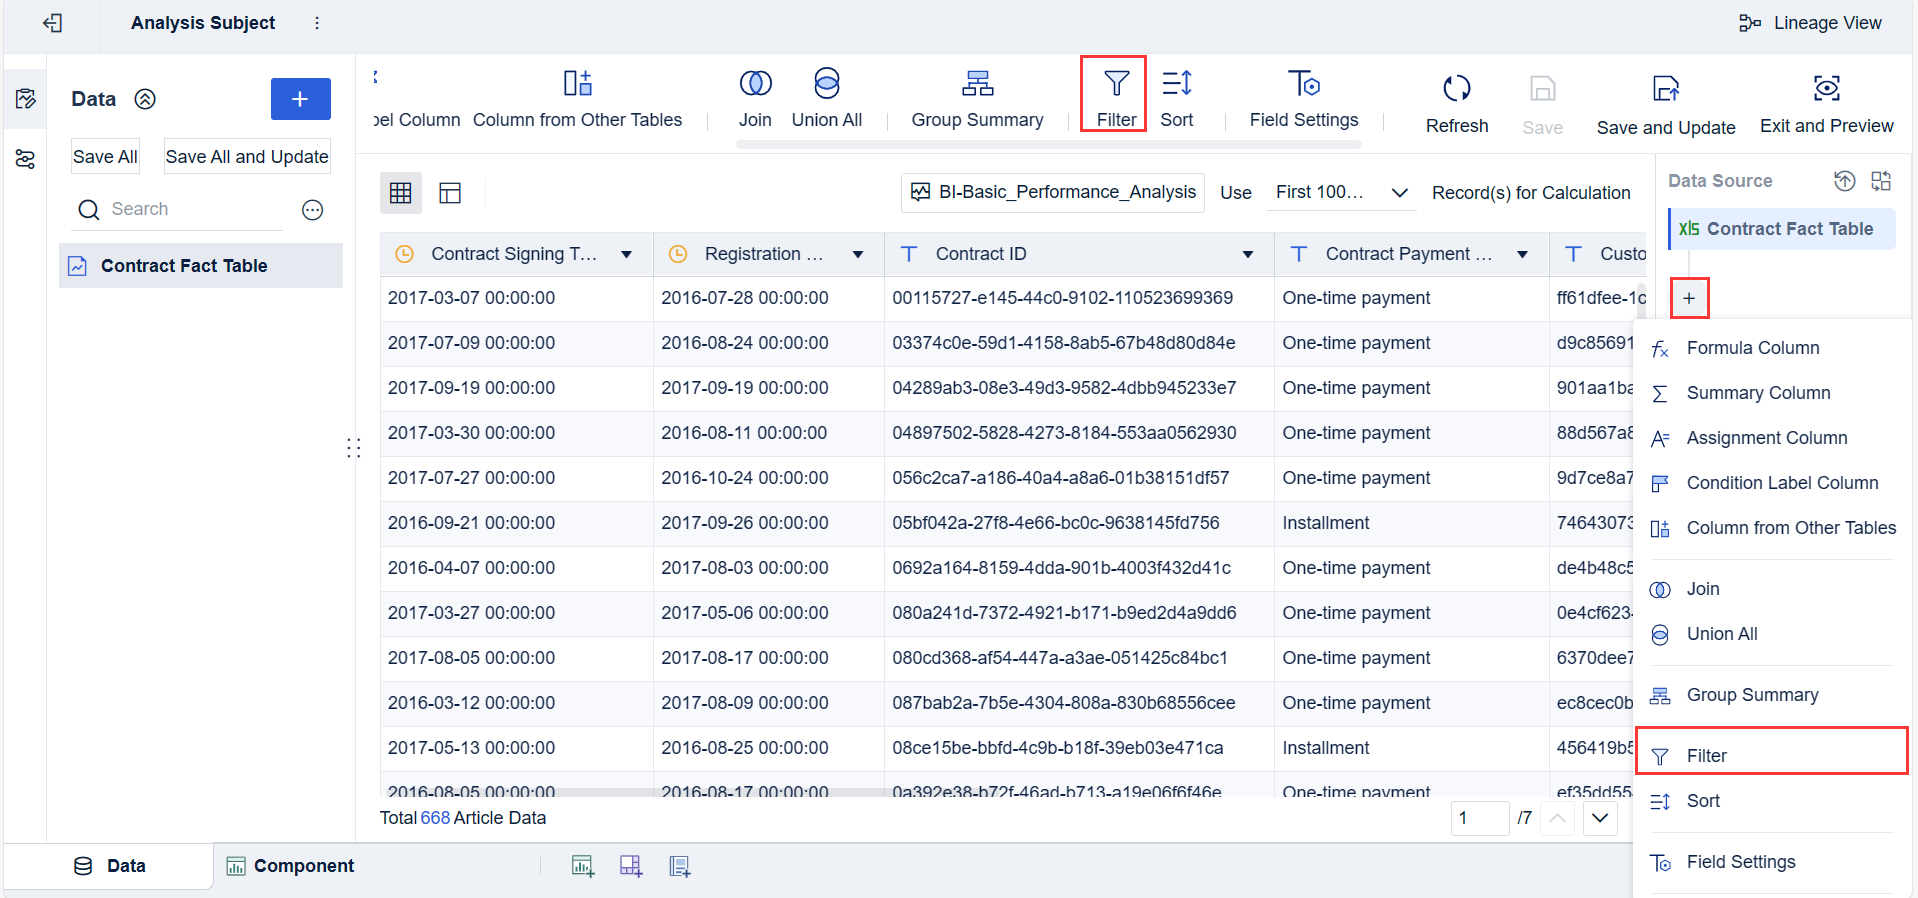
Create Self-Service Datasets
You empower your team when you create self-service datasets. FineBI lets business users select fields, join tables, add calculated fields, and apply filters without IT support. You customize datasets to match your business needs and make analysis faster.
Self-service datasets in FineBI offer several benefits:
| Feature | Benefit |
|---|---|
| Conduct self-service analysis | Enables users to analyze data independently |
| Create custom reports | Tailors insights to specific business needs |
| Access relevant data | Reduces reliance on IT teams for data access |
| Select fields and filter data | Facilitates personalized data analysis |
| Group and summarize data | Enhances efficiency in data processing |
| Modify field properties | Allows customization for better insights |
You analyze data independently, create custom reports, and access relevant data. You select fields and filter data to personalize your analysis. You group and summarize data, which improves efficiency. You modify field properties for deeper insights. These features help you take action quickly and adapt to changing business needs.
FineBI’s self-service capabilities support your data strategy by making analytics accessible to everyone. You reduce bottlenecks and speed up decision-making across your organization.
Tip: Preview your dataset changes in FineBI to ensure accuracy before building dashboards.
Real-World Impact: NTT DATA Taiwan
NTT DATA Taiwan used FineBI to integrate backend systems like ERP, POS, and CRM. They built a unified data platform using ETL processes. This approach helped them visualize data and provide role-specific insights for decision-making. Employees across departments now perform self-service analysis, which improved operational efficiency and supported a data-driven culture. The company moved from traditional BI to self-service BI, allowing teams to take action based on real-time insights.
When you follow these steps, you strengthen your data strategy and learn how to create a data analytics strategy for your business that delivers results. FineBI helps you connect, cleanse, and prepare your data so you can focus on taking action and driving growth.
Visualize and Govern Data Analytics Strategy
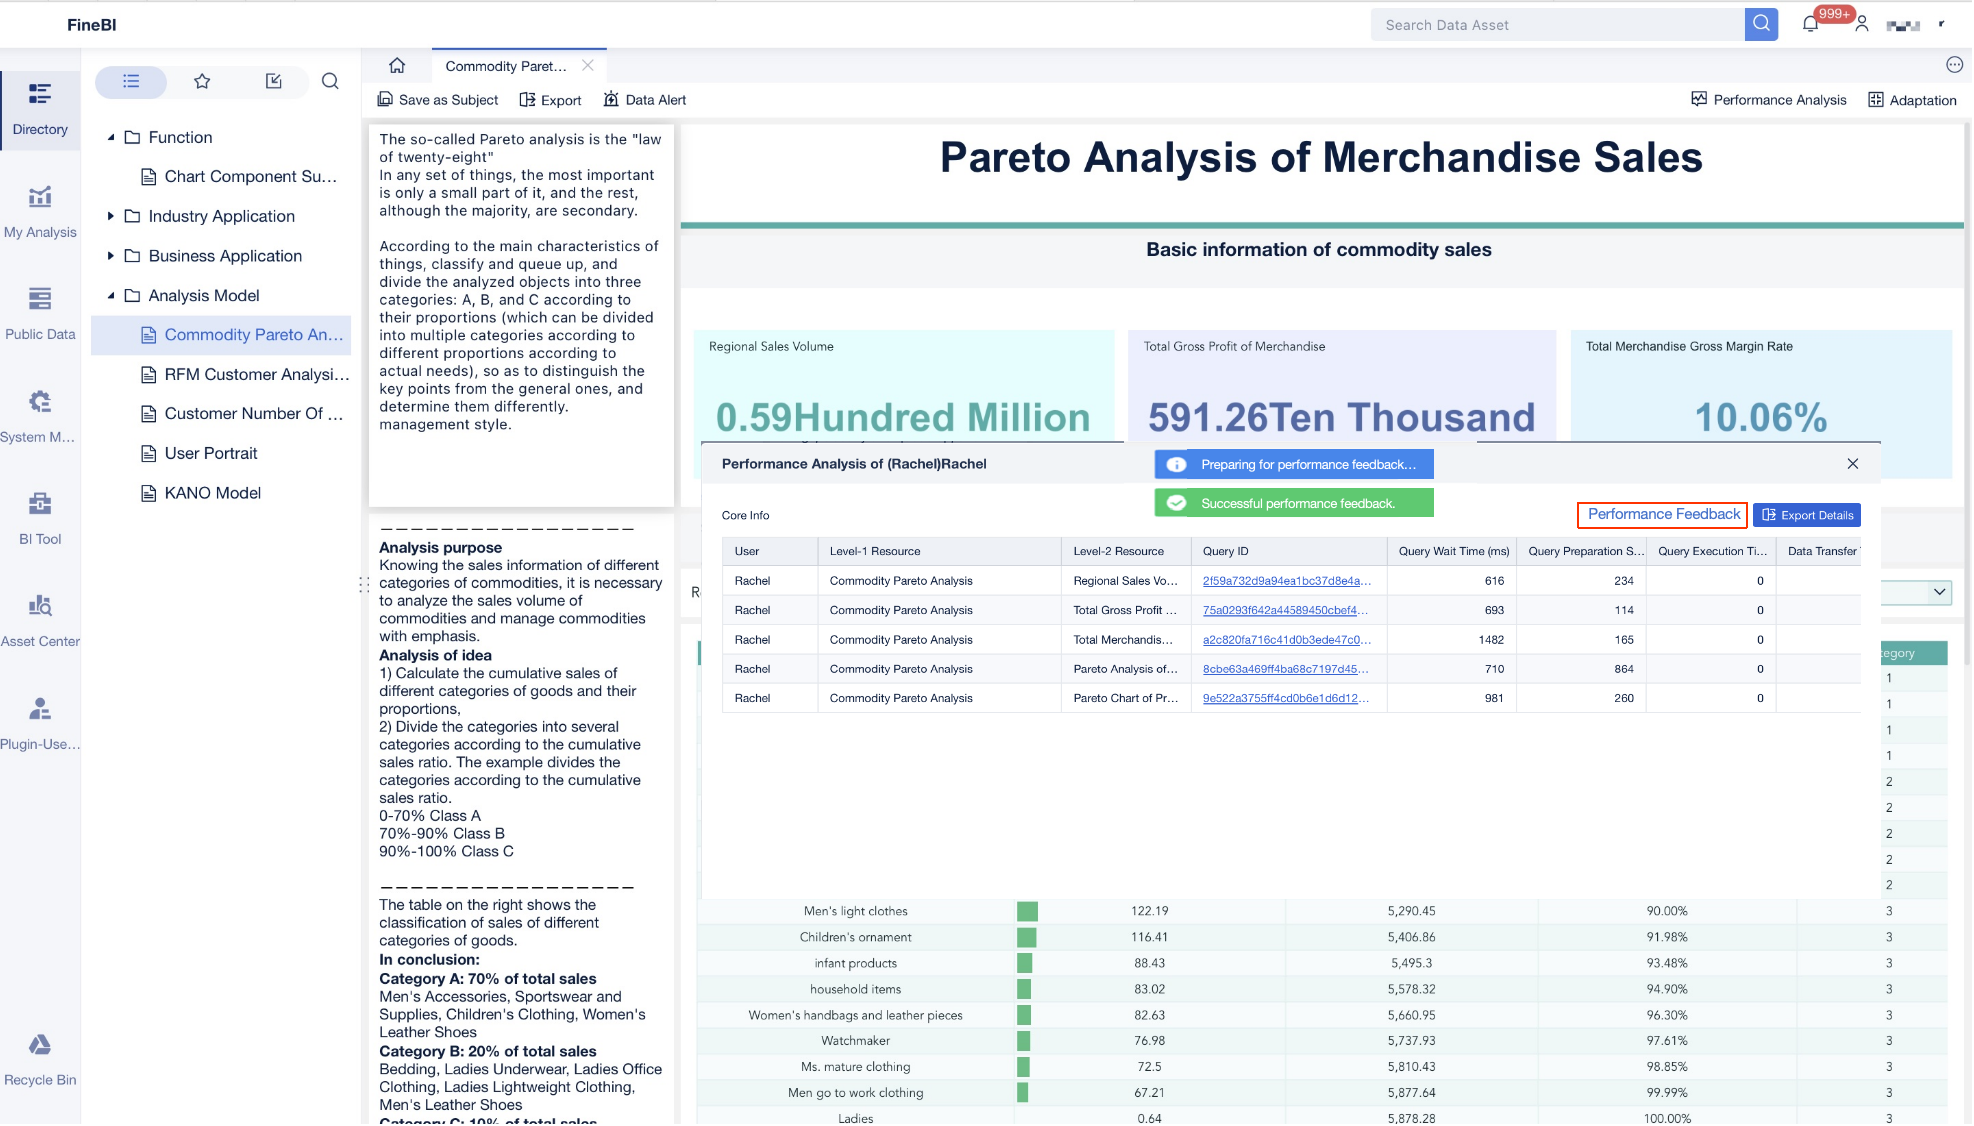
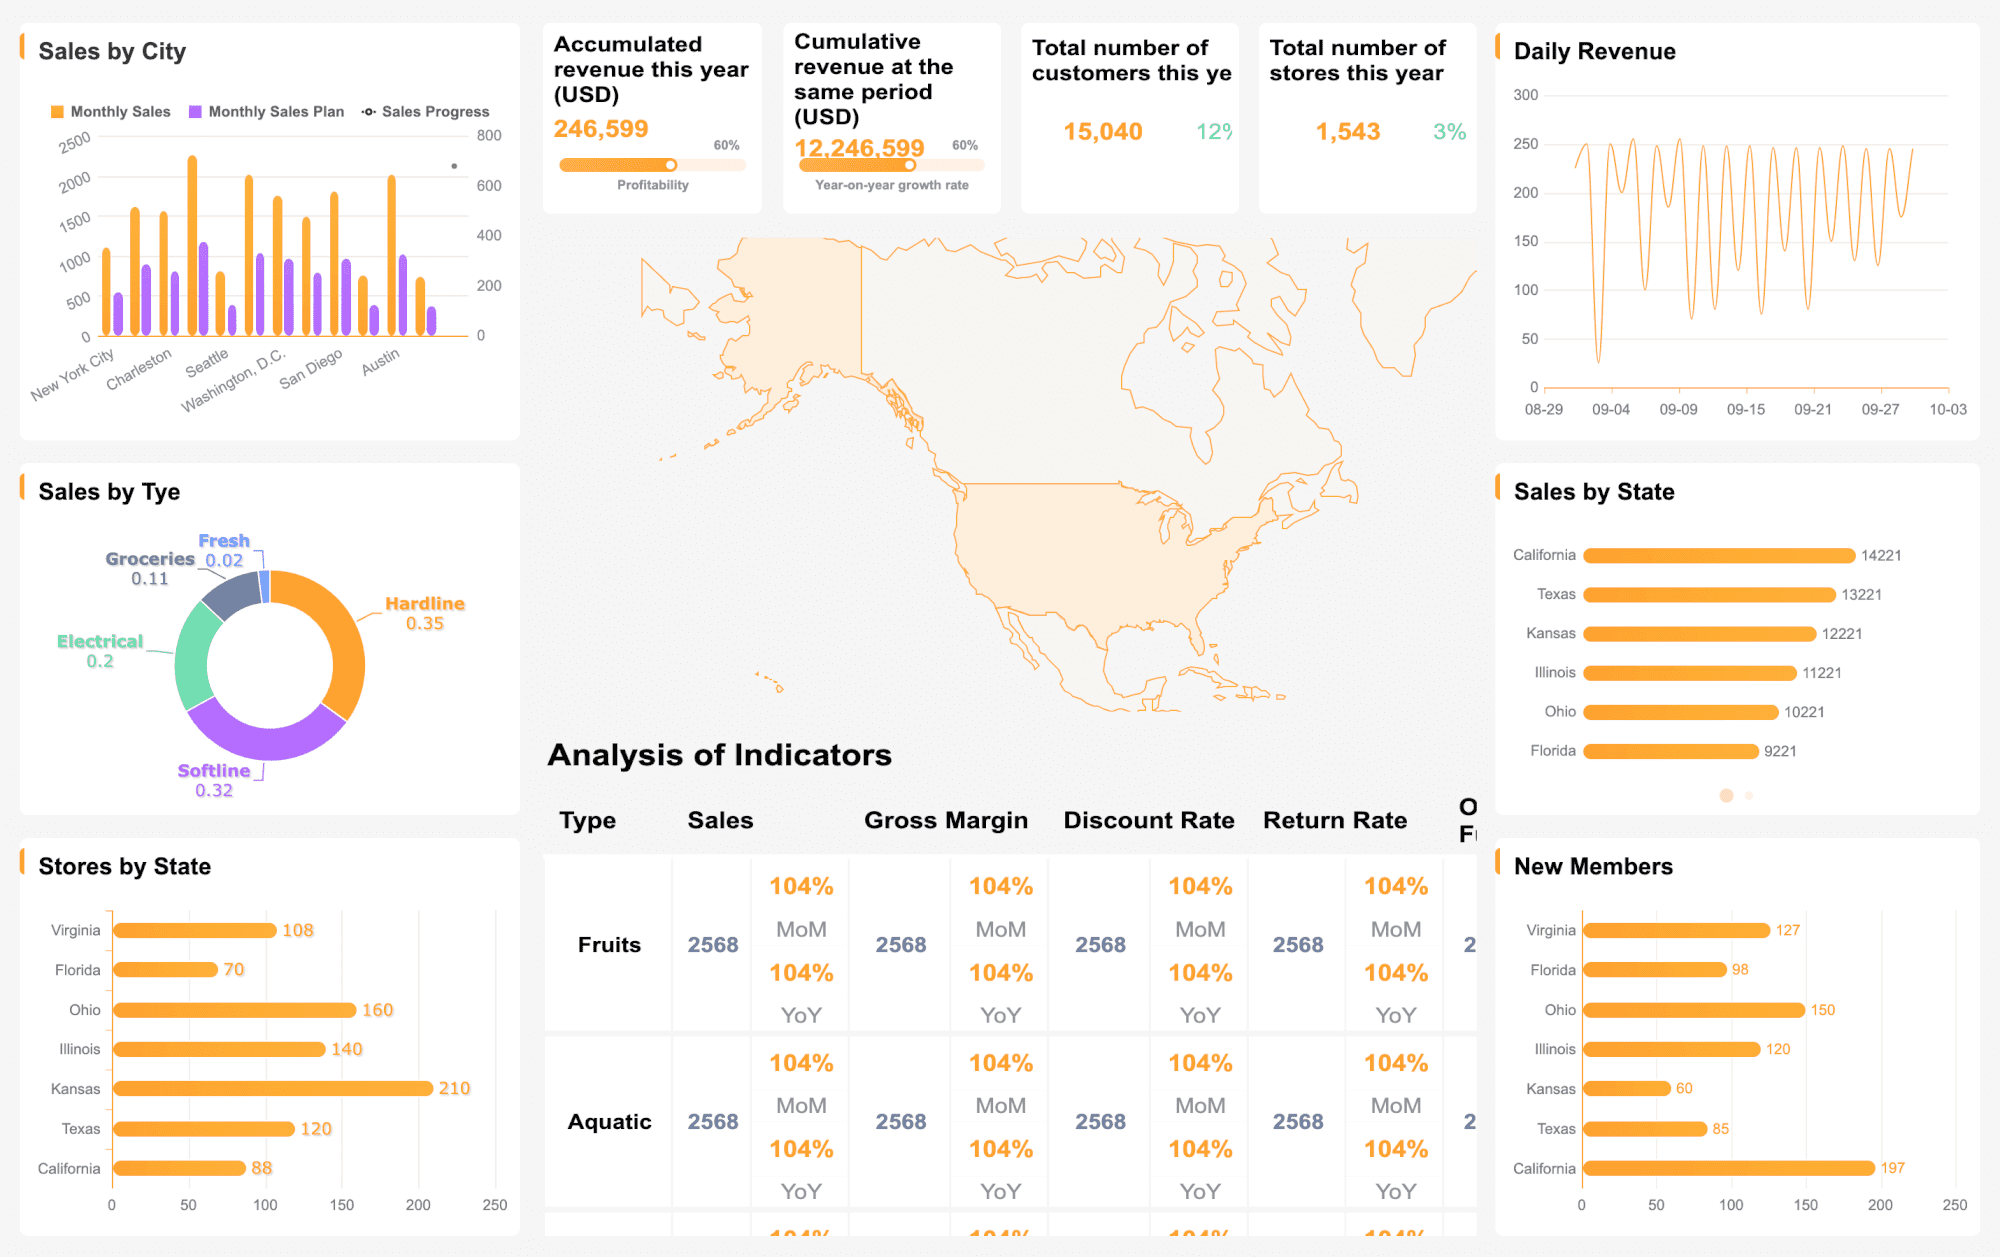
Build Interactive Dashboards
You need to turn your data into clear, actionable insights. FineBI helps you do this with interactive dashboards. You can use a drag-and-drop interface to build reports quickly, even if you do not have technical skills. Real-time calculation and analysis ensure you always work with the latest data. Advanced data visualization lets you customize dashboards for your business needs. You can share insights with your team and support better decision-making across your organization.
| Feature | Contribution to Decision-Making |
|---|---|
| Intuitive Drag-and-Drop Interface | Empowers users to create reports quickly without technical expertise. |
| Real-Time Calculation & Analysis | Ensures decisions are based on the latest data. |
| Advanced Data Visualization | Allows for highly customized dashboards tailored to business needs. |
| Data Collaboration & Sharing | Facilitates teamwork and sharing of insights across the organization. |
FineBI's dashboards help you take action by making complex data easy to understand and use.
Ensure Data Governance and Security
You must protect your data and follow regulations. A strong data strategy includes data governance and security. FineBI supports role-based access control, so only the right people see sensitive information. You can manage data accuracy and quality, making sure your business decisions rely on trusted data. Cross-organizational data management helps you share data safely and meet compliance standards.
| Key Component | Description |
|---|---|
| Data Accuracy and Quality Management | Implementing effective governance to maintain data quality across all sources. |
| Cross-Organizational Data Management | Facilitating data democratization and ensuring regulatory compliance. |
| BI Resource Optimization | Reducing poor data quality through metadata management and enabling self-service BI tools. |
Data governance standards define how you create, protect, share, and maintain data. They ensure data accuracy, security, and compliance throughout the data lifecycle. By aligning your data strategy with standards like GDPR, CCPA, HIPAA, and the UK Data Protection Act, you build trust and reduce risks.
Monitor and Audit Data Usage
You need to monitor and audit data usage to maintain data security and privacy. FineBI provides tools for tracking who accesses data and how they use it. You can define audit objectives, set compliance criteria, and analyze access logs. Regular reviews and automated monitoring help you spot risks early. Scheduled audits and compliance reports keep your business on track. When you find issues, you can take corrective action and update your policies for continuous improvement.
Tip: Regular monitoring and auditing support your data analytics strategy by ensuring ongoing data quality and security.
By focusing on visualization, governance, and monitoring, you strengthen your analytics strategy and support your business in taking action with confidence.
Foster a Culture For Data Analytics Strategy
Promote Data Literacy and Training
You need to build data literacy across your business to support a strong data-driven culture. Start by tailoring learning objectives to each role. Simplify data management concepts so everyone can understand and use them. Develop structured training programs that match your organization’s maturity. Communicate the goals of your data literacy program and measure its effectiveness regularly. FineBI makes this process easier by offering intuitive dashboards and collaborative tools. You can use FineBI’s team features to share best practices and encourage ongoing learning. When your team understands data, you see better decision-making and improved customer experience.
- Tailor learning objectives to specific roles.
- Simplify data management concepts.
- Develop structured data literacy programs.
- Communicate and measure program effectiveness.
Encourage Leadership Support
Leadership plays a key role in building a data-driven culture. When leaders prioritize data usage, they show its importance to everyone. Authentic leadership also builds trust in data, which encourages employees to engage with analytics. Appointing a dedicated leader for data initiatives ensures your analytics strategy stays on track. The table below shows how leadership support influences your business:
| Leadership Action | Impact on Data-Driven Culture |
|---|---|
| Prioritize data usage | Signals importance to the entire organization |
| Promote high ethical standards | Fosters trust in data and open engagement |
| Appoint a dedicated data leader | Ensures focus and consistency in data initiatives |
You avoid common pitfalls by treating data as a business priority, not just a technology project. This approach helps you overcome resistance to change and makes it easier to show the value of data-driven decisions.
Set Up Continuous Improvement Processes
Continuous improvement keeps your data analytics strategy effective. Set clear objectives and metrics for improvement. Collect and integrate data from all sources into a central system. Use advanced analytics tools like FineBI to gain deeper insights and identify new opportunities. Foster a data-driven decision-making mindset throughout your business. Regularly monitor performance and adapt your strategies as needed. FineBI’s alerts, portals, and team collaboration tools help you track progress and drive adoption. You can set up alerts for key metrics and use portals to give teams easy access to dashboards. This process supports taking action and ensures your business adapts to change.
| Continuous Improvement Process | Description |
|---|---|
| Establish objectives and metrics | Define goals and measure progress |
| Collect and integrate data | Centralize data for comprehensive analysis |
| Use advanced analytics tools | Gain deeper insights and identify opportunities |
| Foster a data-driven culture | Encourage data-driven decision-making across the organization |
| Monitor and adapt | Review performance and refine strategies regularly |
A strong data-driven culture helps you make better decisions, track progress, and respond quickly to new challenges. When you focus on data literacy, leadership support, and continuous improvement, you create a business environment where data-driven decision-making leads to real results.
You can build a strong data analytics strategy by following key steps. Align business goals with data initiatives, establish a solid data architecture, and ensure data governance. Foster a data-driven culture and set a clear roadmap for improvement. FineBI gives you self-service analytics, real-time analysis, and secure governance. Start your analytics journey by assessing your current state, defining objectives, and gathering essential tools. Regular evaluation and adaptation help your business stay competitive and improve customer experience.
| Key Steps for Building a Data Analytics Strategy | Description |
|---|---|
| Align Business Goals with Data Initiatives | Set clear business goals that match your analytics approach to turn raw data into insights for growth. |
| Establish a Solid Data Architecture | Choose technology and tools that fit your business needs and support advanced analytics. |
| Ensure Data Governance | Create a framework for data quality, usage policies, and security to maintain data integrity. |
| Foster a Data-Driven Culture | Encourage data literacy and accountability among employees to make data-informed decisions. |
| Implement a Data Strategy Roadmap | Define measurable milestones and continuously improve the strategy based on evolving business needs. |

Continue Reading About Data Analytics Strategy
How to Do Retention Analysis for Business Success
What is Pareto Chart and How Does it Work
How DuPont Analysis Helps You Understand Your Business


FAQ

The Author
Lewis
Senior Data Analyst at FanRuan
Related Articles

What Recruiters Look for in a Data Analysis Portfolio: 10 Criteria to Score Yours Fast
A $1 is not judged like a school assignment. It is judged like a hiring shortcut. Recruiters, hiring managers, and analytics leads use it to answer one question fast: Can this person solve business problems with data in
Lewis Chou
May 29, 2026

What Is Data Analytics Consulting? Beginner’s Guide to Services, Deliverables, and Business Value
$1 helps organizations turn raw data into decisions they can trust. For many business leaders, the challenge is not a lack of data. It is a lack of clarity. Reports conflict, teams track different KPIs, dashboards are un
Lewis Chou
Jun 03, 2026

Data Analyst Job Description [+2026 Guide]: Compare Responsibilities, Skills, and Salary by Industry
A strong $1 does more than list tasks. It defines how a company turns raw data into business decisions, which teams the analyst supports, and what measurable outcomes the role is expected to influence. For employers, tha
Lewis Chou
Jun 02, 2026