What is a business performance dashboard? You use this tool to visualize key metrics and track progress toward goals. The dashboard brings together data from multiple sources, helping you make informed decisions and monitor business health in real time.
| Reason for Adoption | Description |
|---|---|
| Enhancing Decision-Making | Dashboards give you instant access to performance metrics. |
| Tracking Performance | You measure progress and identify areas for improvement easily. |
| Increasing Efficiency | Dashboards promote awareness and help you focus on critical goals. |
What is a Business Performance Dashboard
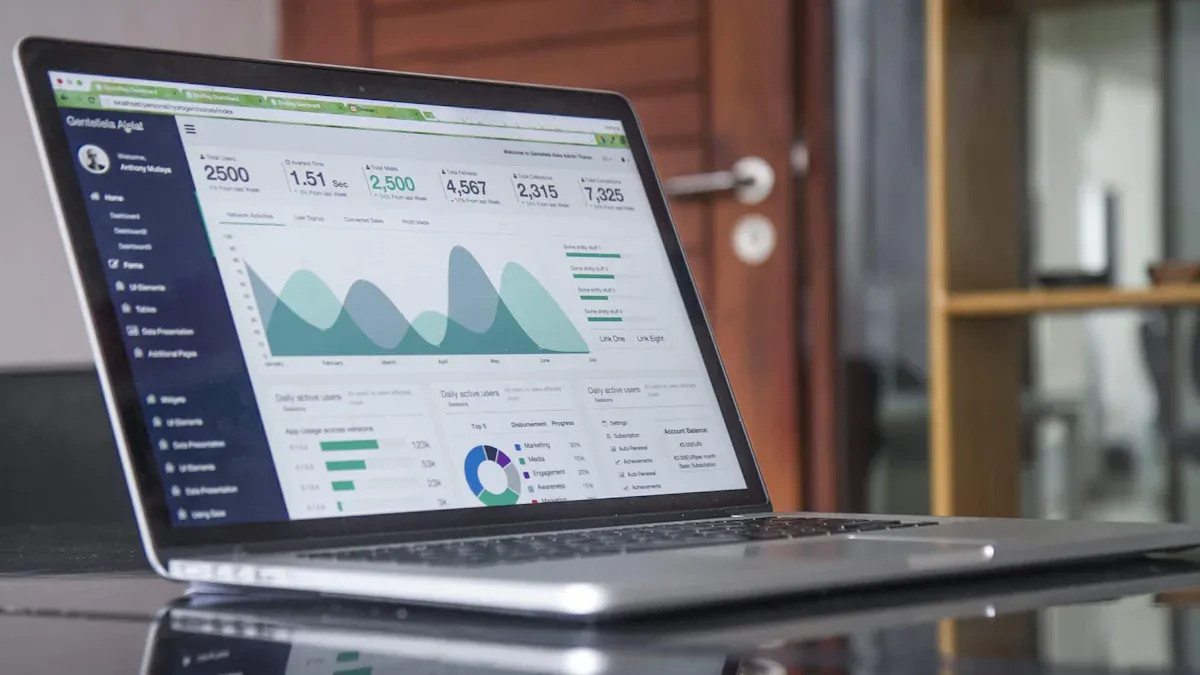
A business performance dashboard is a digital tool that lets you track, analyze, and visualize key metrics in one place. You use it to monitor progress toward goals, identify trends, and make informed decisions. This dashboard brings together data from different sources, giving you a real-time view of your business health.
You can think of a business performance dashboard as your command center for business insights. It displays measurable KPIs, highlights trends, and allows you to customize views based on your needs. With this tool, you gain clarity and control over your operations, helping you respond quickly to changes and opportunities.
Core Purpose and Role
The main purpose of a performance dashboard is to help you monitor, analyze, and manage your business. You see all your important metrics in one place, which makes it easier to spot problems and take action. Industry experts agree that a performance dashboard should include measurable KPIs, trend analysis, customization, and data visualization. Here is a summary of these key elements:
| Key Element | Description |
|---|---|
| Measurable KPIs | Indicators that show how well a business is meeting its goals, specific and easy to track. |
| Trend Analysis | Helps in understanding patterns over time, allowing proactive actions based on early insights. |
| Customization | Allows users to tailor dashboards to their specific needs, enhancing relevance and usability. |
| Data Visualization | Utilizes visual elements to simplify complex data, aiding quick comprehension and response. |
A performance dashboard serves several functions in organizational management. You use it to monitor critical processes, analyze the root causes of issues, and manage people and resources for better results. The table below shows the main functionalities:
| Functionality | Description |
|---|---|
| Monitor | Critical business processes and activities using performance metrics that alert users to potential problems. |
| Analyze | The root cause of problems by digging into relevant and timely information. |
| Manage | People and processes to improve decisions and optimize business performance. |
You benefit from a performance dashboard because it gives you a clear view of your business. You can quickly identify areas that need improvement and support data-driven decision-making. The dashboard also helps you align team goals with your company’s strategy. When everyone sees the same data, you encourage transparency and accountability. This alignment ensures that your team’s efforts contribute to the overall success of your organization.
How a Business Performance Dashboard Works
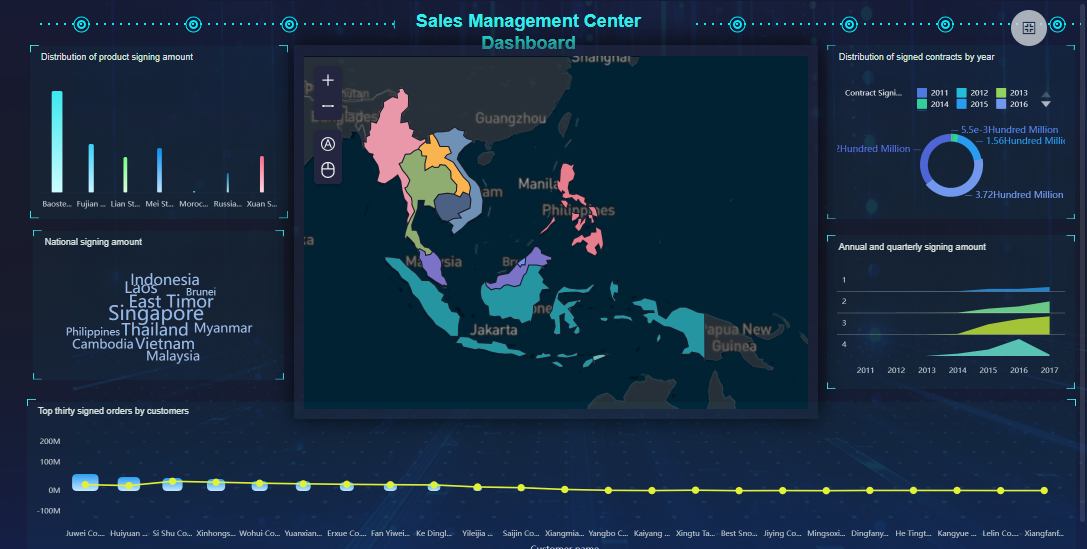
A performance dashboard works by collecting data from multiple sources and presenting it in a visual format. You connect your databases, spreadsheets, or cloud services to the dashboard. The tool then updates your metrics in real time, so you always have the latest information.
You interact with the dashboard through charts, graphs, and tables. These visualizations make it easy to spot trends, compare results, and drill down into details. You can customize your dashboard to focus on the metrics that matter most to you. For example, you might track sales performance, customer satisfaction, or operational efficiency.
Here are some ways a performance dashboard supports data-driven decision-making:
- You use it as a centralized hub for tracking KPIs and performance metrics in real time.
- The dashboard flags potential issues or anomalies, allowing you to resolve problems before they escalate.
- You gain insights into customer behaviors and preferences, which helps you improve products and services.
- The dashboard drives informed decision-making and streamlines operations, guiding you toward your goals.
- You identify inefficiencies and optimize resource allocation, maximizing your return on investment.
- The dashboard supports long-term planning by offering historical data analysis and trend forecasting.
- You promote accountability by providing visibility into individual and team performance.
- The dashboard aids in risk assessment by highlighting vulnerabilities and supporting proactive management.
- You foster a data-driven culture, encouraging decisions based on facts rather than intuition.
Real-time data integration makes a performance dashboard even more powerful. You see live updates, which means you can respond quickly to challenges and opportunities. The dashboard improves collaboration by aligning teams around shared KPIs. AI-powered insights and interactive visualizations help you make smarter decisions. The dynamic nature of the dashboard allows you to react to market changes with agility.
In today’s business intelligence landscape, you need unified, real-time analytics to stay competitive. Many organizations face challenges with fragmented systems and inconsistent data. A business performance dashboard solves these problems by bringing all your data together in one place. You get accurate, up-to-date insights that support better decisions and drive business growth.
Business Performance Dashboard Components and Features
Key Elements of a Performance Dashboard
A high-performing business performance dashboard brings together several important elements. You use these components to track your business health and make informed decisions. The most critical parts include:
- Data Sources: You connect your dashboard to databases, spreadsheets, or cloud services. This step ensures you have accurate and up-to-date information.
- Metrics and KPIs: You select the most important metrics, such as sales, financial results, operational performance, and customer satisfaction. KPIs help you measure progress toward your goals.
- Visualizations: You see your data as charts, graphs, and tables. These visuals make it easier to spot trends and compare results.
- Interactivity: You interact with your dashboard by applying filters, drilling down into details, and exploring different time periods. This feature helps you focus on the most relevant data.
A strong performance dashboard also includes features that enhance usability. You can view long-term trends, set benchmarks, and compare results across different teams or locations. The dashboard often explains why performance matters for your clients and provides guidance for interpreting trends.
Cross-filtering enhances your experience by making navigation and exploration seamless. You uncover deeper insights from complex datasets efficiently.
Interactive features improve your engagement. You personalize your view with filter widgets, reveal more details on demand, and use drilldown charts to explore data hierarchies. AI-driven queries let you ask questions and get instant insights, speeding up your analysis.
FineBI’s Workflow and Capabilities
FineBI gives you a complete solution for building and managing a business performance dashboard. You start by connecting to over 60 types of data sources, including databases, cloud warehouses, and APIs. FineBI lets you prepare and process your data with self-service tools, so you can clean, join, and refine your metrics without coding.
You create dashboards using a drag-and-drop interface. FineBI offers a wide range of charts and tables, making it easy to visualize your KPIs and performance metrics. Real-time filtering and interactive features help you analyze trends and compare results instantly. FineBI supports mobile access, so you can monitor your performance dashboard anywhere.
FineBI also provides strong data governance. You control who can view or edit dashboards, ensuring data security. The platform supports real-time analysis, so you always see the latest performance data. With AI-driven analytics, you can ask questions in plain language and receive instant answers, making your business performance dashboard even more powerful.

Types of Business Performance Dashboard
You encounter three main types of business performance dashboards in organizations. Each type serves a unique purpose and supports different roles. You use these dashboards to monitor kpis, analyze performance, and guide decision-making.
| Dashboard Type | Definition and Purpose | Key Features | Use Cases |
|---|---|---|---|
| Operational Dashboard | Monitors and manages day-to-day activities with real-time data. | Real-Time Monitoring, Detailed Metrics, Alerts and Notifications | Customer Support, Manufacturing, Logistics |
| Analytical Dashboard | Used for deep data analysis and exploratory purposes, providing insights into trends. | Data Exploration, Advanced Data Visualizations, Historical Analysis | Marketing, Sales, Finance |
| Strategic Dashboard | Offers a high-level view of organizational performance against long-term goals. | High-Level Metrics, Goal Tracking, Trend Analysis | Executive Management, Board Meetings, Investor Relations |
Operational Dashboards
You rely on operational dashboards to track daily business activities. These dashboards display up-to-the-minute data, helping you identify patterns and trends quickly. You monitor kpis such as production rates, customer support tickets, or logistics status. The dashboard provides clear visualizations, so you can assess situations and take action before problems affect performance. You use alerts and notifications to stay informed about critical changes. FineBI supports operational dashboards by allowing you to customize components, adjust layouts, and modify content to fit your workflow. You keep your team aligned and informed with real-time performance metrics.
Strategic Dashboards
You use strategic dashboards to monitor long-term goals and organizational performance. These dashboards present integrated results, benchmarks, and predictive analysis. You track high-level kpis that reflect progress toward business objectives. Executives and senior leaders depend on strategic dashboards for concise, actionable insights. You identify trends and anomalies visually, which helps you make confident decisions. FineBI enables you to tailor strategic dashboards for leadership meetings, aligning departments with common metrics and supporting strategic planning.
Analytical Dashboards
You turn to analytical dashboards for deep data exploration. These dashboards help you analyze performance trends, compare historical data, and uncover insights. You interact with metrics, apply filters, and drill down into specific details. Analytical dashboards offer advanced visualizations, such as Sunbursts and Sankey Diagrams, to help you understand complex data. FineBI supports analytical dashboards by integrating data from multiple sources and providing customizable layouts. You use these dashboards to identify improvement areas and optimize business performance.
Tip: FineBI lets you personalize dashboard content, modify titles, and adjust visibility based on your needs. You access directory templates according to your permissions, making each performance dashboard relevant to your role and industry.
Benefits of Business Performance Dashboard
Improved Decision-Making
A business performance dashboard gives you clear visibility into your key performance indicators. You see all your important metrics in one place, which helps you make better decisions. When you track kpis, you notice trends and spot issues before they become problems. You use real-time data to guide your actions and plan for the future. The dashboard makes complex information easy to understand, so you can respond quickly to changes in your business environment.
| Benefit | Description |
|---|---|
| Improved Decision-Making | Enables informed decision-making and strategic planning through real-time visibility into metrics. |
| Greater Understanding | Makes organizational insights more accessible through analytical tools. |
| Informed Decision-Making | Executive dashboards provide timely insights for leaders, enabling prompt responses to challenges. |
You rely on the dashboard to support strategic planning and drive improvement. You use the insights to set new goals and measure progress. The dashboard helps you align your team’s efforts with company objectives, making sure everyone works toward the same targets.
Real-Time Monitoring and Collaboration
You benefit from real-time monitoring with a business performance dashboard. You see live updates for your kpis and key performance indicators, which allows you to act fast when challenges arise. The dashboard encourages collaboration by giving everyone access to the same data. You share dashboards across departments, making complex insights understandable for all employees.
- Shareable dashboards help ensure that data is flowing and accessible to everyone.
- Dashboards promote collaboration by allowing employees to communicate from the same data base.
- Real-time data allows for immediate action on emerging issues.
- Transparent access to key metrics encourages responsibility among teams.
You use the dashboard to organize efforts and clarify questions. The central location for performance data helps align goals and tasks across different roles. You foster a culture of accountability and continuous improvement by making performance visible to everyone.
Case Study: BOE’s Success with FineBI
BOE Technology Group improved its business performance by implementing FineBI’s business performance dashboard. The company faced challenges with fragmented data and inconsistent key performance indicators. FineBI helped BOE build a unified operational analysis framework and standardize metrics. The dashboard enabled real-time monitoring and cross-factory benchmarking.
BOE achieved measurable improvement:
| Benefit | Outcome |
|---|---|
| Inventory Cost | Reduced by 5% |
| Operational Efficiency | Increased by 50% |
| Data Utilization | Enhanced decision-making and performance |
You see how a business performance dashboard drives improvement in efficiency, accountability, and agility. FineBI’s solution helped BOE align team goals, improve data quality, and support rapid decision-making. You can use similar dashboards to achieve better performance and continuous improvement in your organization.
Challenges and Best Practices in Business Performance Dashboard
Common Pitfalls in Dashboard Implementation
When you implement a performance dashboard, you may face several common challenges. Many organizations struggle with information overload, poor visualization choices, and inconsistent updates. These issues can reduce the effectiveness of your dashboard and make it harder to focus on critical performance data.
| Challenge | Description |
|---|---|
| Information Overload | Presenting too much information can hinder focus on critical data points. |
| Poor Data Visualization Choices | Incorrect chart types can lead to confusion and misinterpretation. |
| Inconsistent Data Updates | Lack of regular updates can erode trust in the dashboard's accuracy. |
| Lack of Customization | One-size-fits-all dashboards may not meet specific user needs. |
| Insufficient Context for Metrics | Data without context can lead to misunderstandings. |
You also encounter data silos and inconsistent metrics. These problems disrupt your workflows and limit the value of your performance dashboard. For example, 82% of enterprises report that data silos disrupt critical workflows. Leaders who lack a unified view of performance often make decisions based on incomplete information.
Ensuring Data Quality and Security
You need to ensure high data quality and security to get the most from your performance dashboard. You can use several best practices:
- Implement data validation techniques to check for accuracy and consistency.
- Use data cleaning tools to remove errors, standardize formats, and eliminate duplicates.
- Protect your performance data with encryption and access controls.
- Promote data literacy among your team to encourage best practices.
- Monitor and report data quality using dedicated metrics and dashboards.
- Leverage predictive insights to identify potential data quality issues before they escalate.
These steps help you maintain trust in your performance dashboard and support reliable decision-making with real-time data.
Best Practices with FineBI
FineBI helps you overcome common performance dashboard challenges. The platform supports seamless data integration, breaking down silos and unifying your performance metrics. You benefit from strong governance features, including role-based access and audit trails, which protect your performance data.
| Feature | Benefit |
|---|---|
| Performance Analysis | You quickly solve performance-related issues during dashboard preview or editing. |
| Bottleneck Identification | You analyze performance metrics and identify bottlenecks effectively. |
| Optimization | You optimize dashboard performance for a better user experience. |
FineBI’s self-service tools let you customize your performance dashboard, ensuring it meets your unique needs. You access real-time data, apply filters, and explore trends interactively. The platform’s design encourages user adoption and supports continuous improvement in performance management.
You gain a strategic advantage when you use a business performance dashboard. This tool helps you track progress, optimize operations, and reach your business goals. Companies that adopt dashboards see better efficiency and stronger management. You unlock actionable insights, support informed decisions, and build a culture of continuous improvement. Explore FineBI to experience how a modern dashboard can transform your organization. For more on business intelligence, consider learning about advanced analytics and data integration.

Continue Reading About Business Performance Dashboard
Best Dashboard Apps for Business Insights
What is a Call Center Dashboard and Why Does It Matter
What is a Reporting Dashboard and How Does it Work
What is An Interactive Dashboard and How Does It Work
What is a Call Center Metrics Dashboard and How Does It Work


FAQ

The Author
Lewis
Senior Data Analyst at FanRuan
Related Articles

How to Build an Investment Portfolio Reporting Dashboard for Executives: KPIs, Benchmarks, and Drill-Down Views
Investment portfolio reporting for executives is not about showing every holding, transaction, and chart your investment team can produce. It is about giving CEOs, CFOs, CIOs, boards, and investment committees a fast, re
Yida YIn
Jun 25, 2026

12 KPI Reporting Examples for Executive Dashboards: What to Show in Weekly, Monthly, and Quarterly Reviews
Executive leaders do not need more data. They need decision ready $1 examples that match how often they review the business and what actions they are expected to take. A weekly $1 should surface fast moving risks and per
Yida YIn
Jun 25, 2026

How to Build a Digital Marketing Reports Dashboard: Executive Examples, KPIs, and Templates
A $1 is the control layer that helps executives and marketing leaders turn scattered channel data into fast, confident decisions. If you are a CEO, CMO, operations director, or marketing analytics lead, the real problem
Yida Yin
May 07, 2026