A business report writing format is the standard structure professionals use to present facts, analysis, and recommendations in a way decision-makers can scan quickly and trust. If you are an operations director, department manager, analyst, or project lead, the real challenge is not just writing clearly—it is making sure the report is organized in the format your audience expects, so they can act on it without confusion. A strong format improves readability, reduces back-and-forth, and turns raw information into a decision-making tool.
What Is the Standard Business Report Writing Format?
A business report is a formal document used to communicate information for operational review, planning, compliance, performance tracking, or strategic decision-making. Unlike casual updates or emails, a formal report follows a recognizable structure so readers can locate the objective, evidence, findings, and recommendations quickly.
In practice, a formal format is usually expected when the report will be:
Submitted to senior management or external stakeholders
Used to support a decision or investment
Archived as an official business record
Shared across departments for alignment
Reviewed against internal templates or governance standards
The business report writing format is not the same as tone, purpose, or length. Those elements are related, but different:
Format is the report’s structure and section order
Tone is how formal, neutral, or persuasive the writing sounds
Purpose is why the report exists—inform, compare, recommend, or update
Length depends on the depth of the topic and audience needs
A short progress report and a long analytical report may have different levels of detail, but both still rely on a logical format.
In most organizations, readers expect to see the sections in roughly this order:
Title page
Executive summary
Table of contents
Introduction
Method or background, if needed
Findings
Conclusions
Recommendations
Appendices or supporting material, if needed
Key Metrics (KPIs) for an Effective Business Report Format
When evaluating whether a report format is working, these are the core quality indicators experienced managers look for:
Clarity: The report objective is obvious within the first page.
Completeness: All required sections are present and properly labeled.
Relevance: Every section supports the business question being answered.
Evidence quality: Claims are supported by data, examples, or documented observations.
Skimmability: Headings, bullets, tables, and summaries help readers scan fast.
Consistency: Numbering, terminology, formatting, and visual styles are uniform.
Actionability: Conclusions and recommendations are specific enough to guide next steps.
Audience fit: The level of detail matches what the intended reader needs to know.
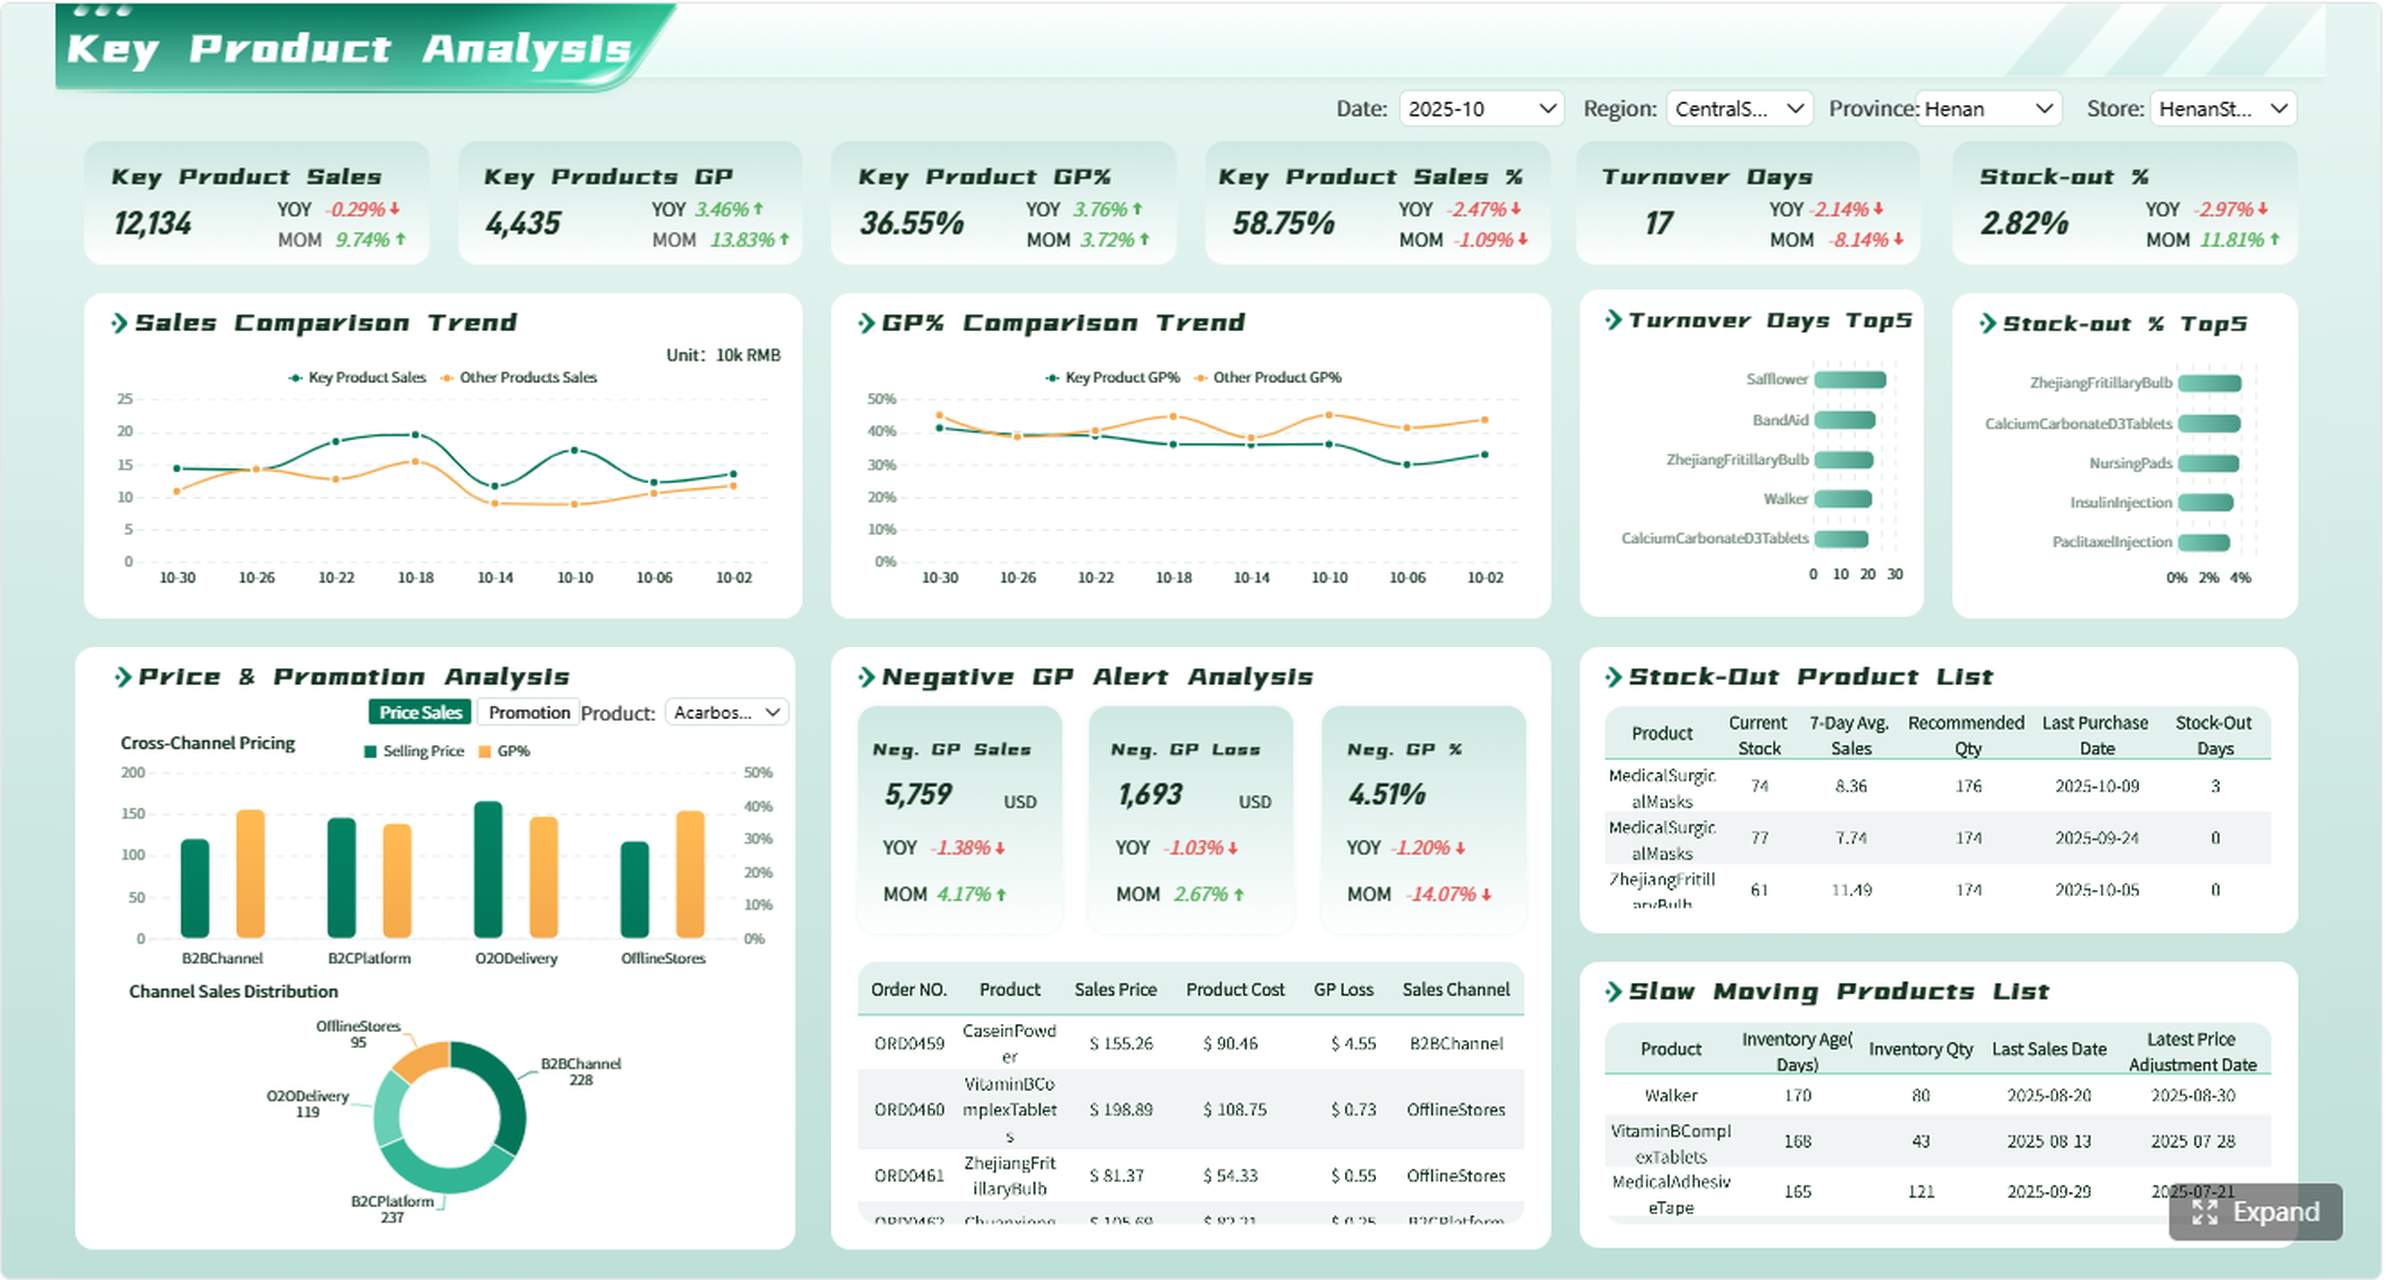
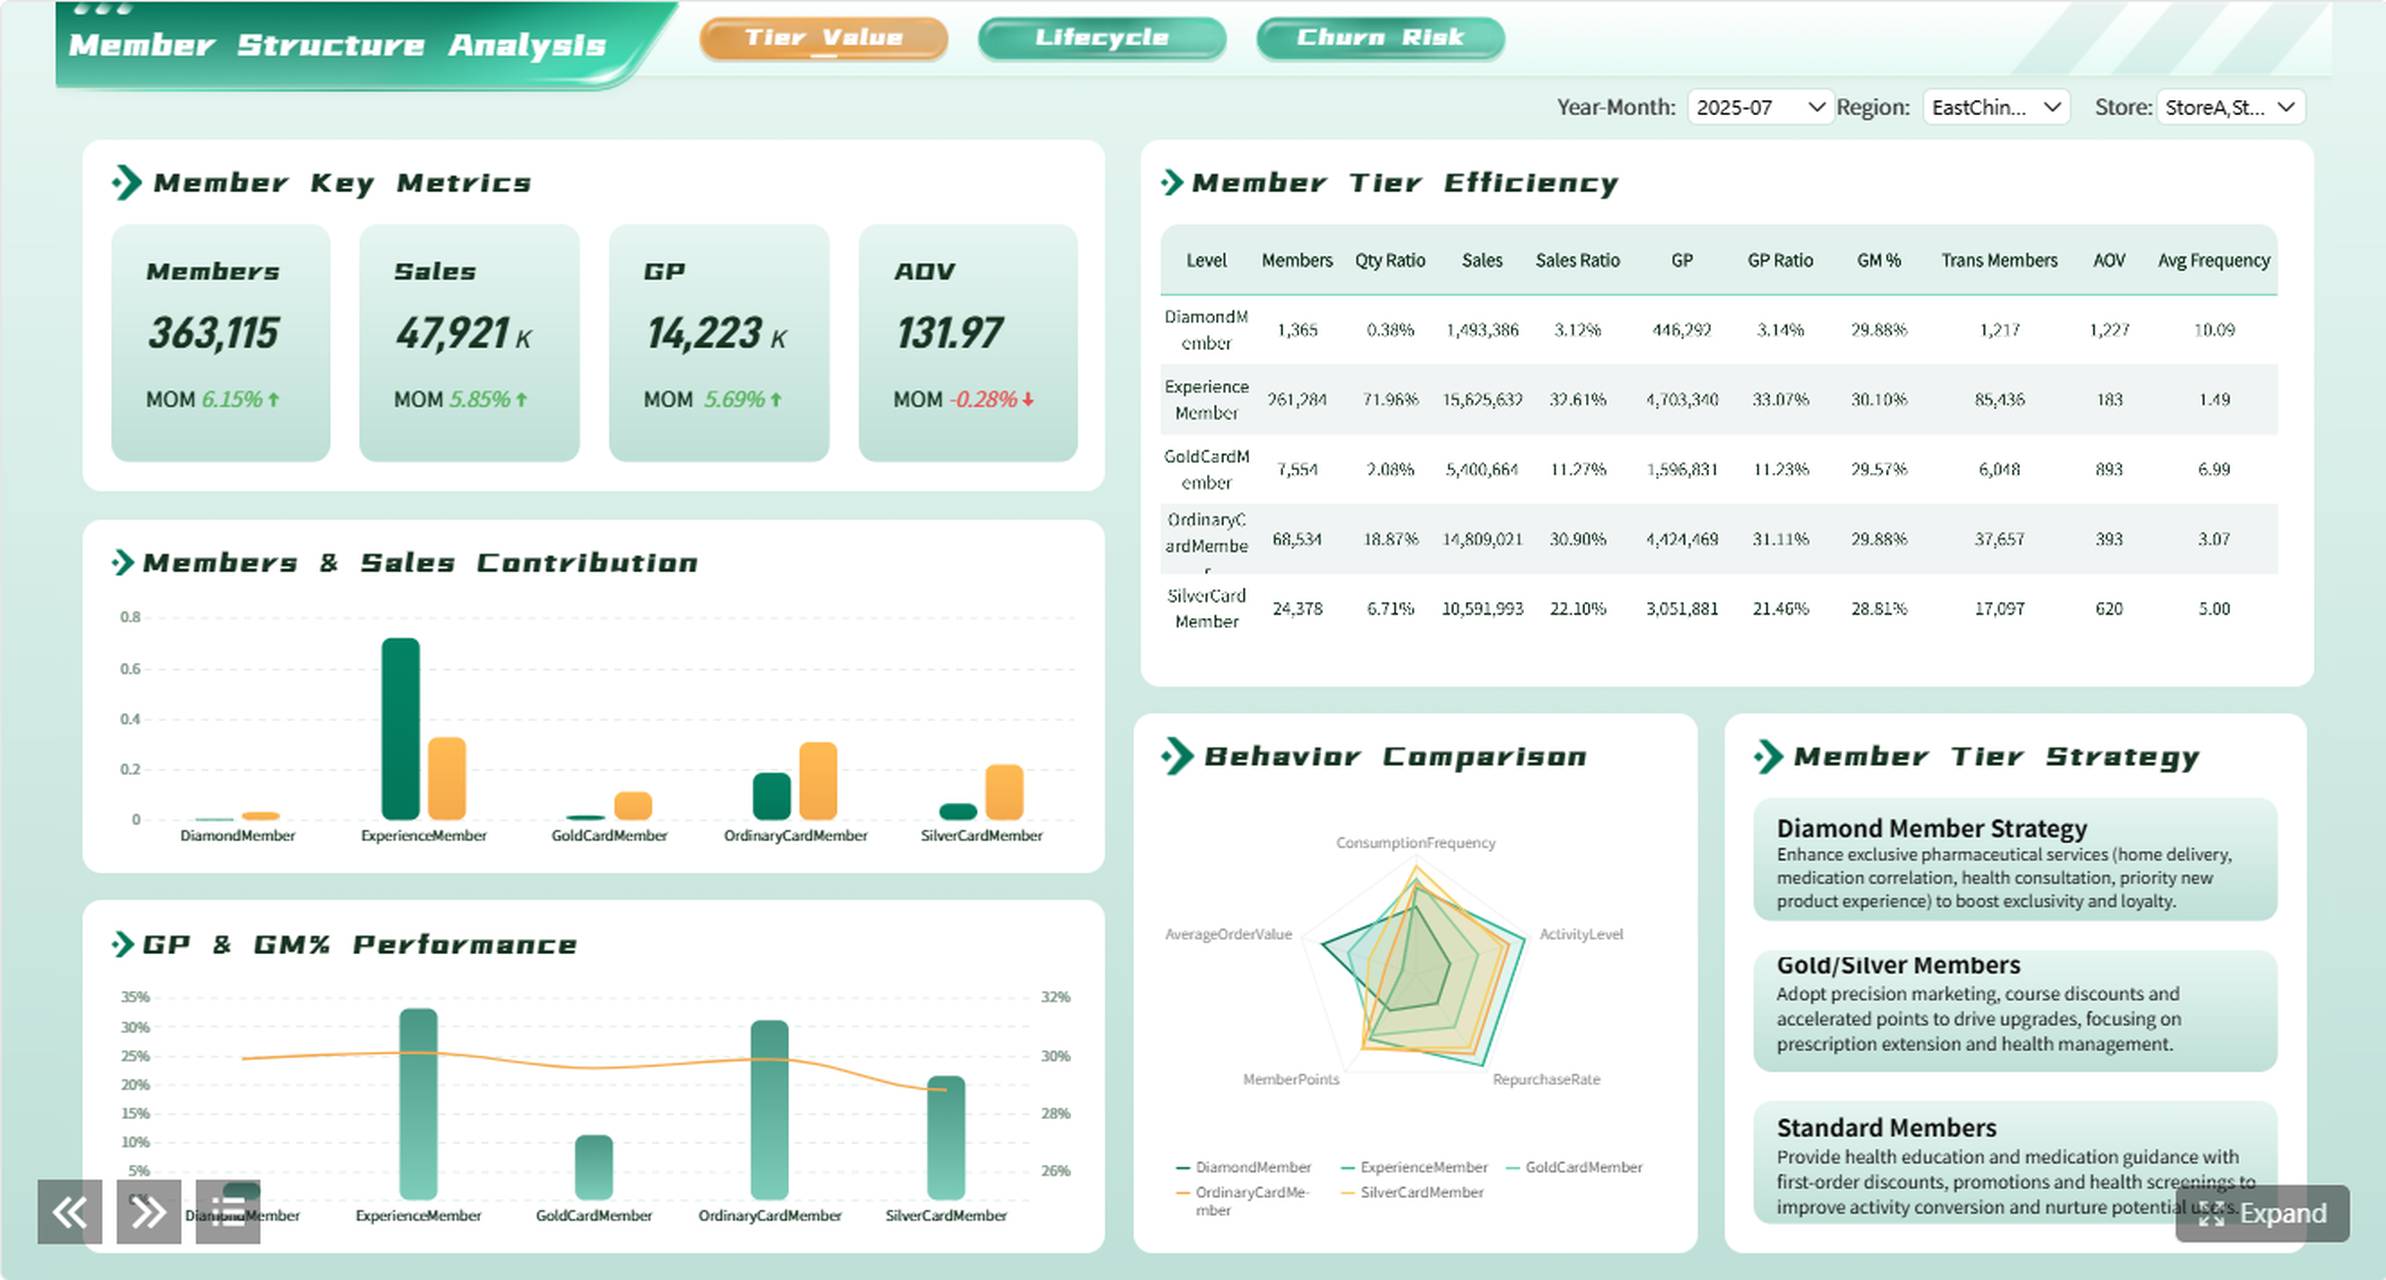
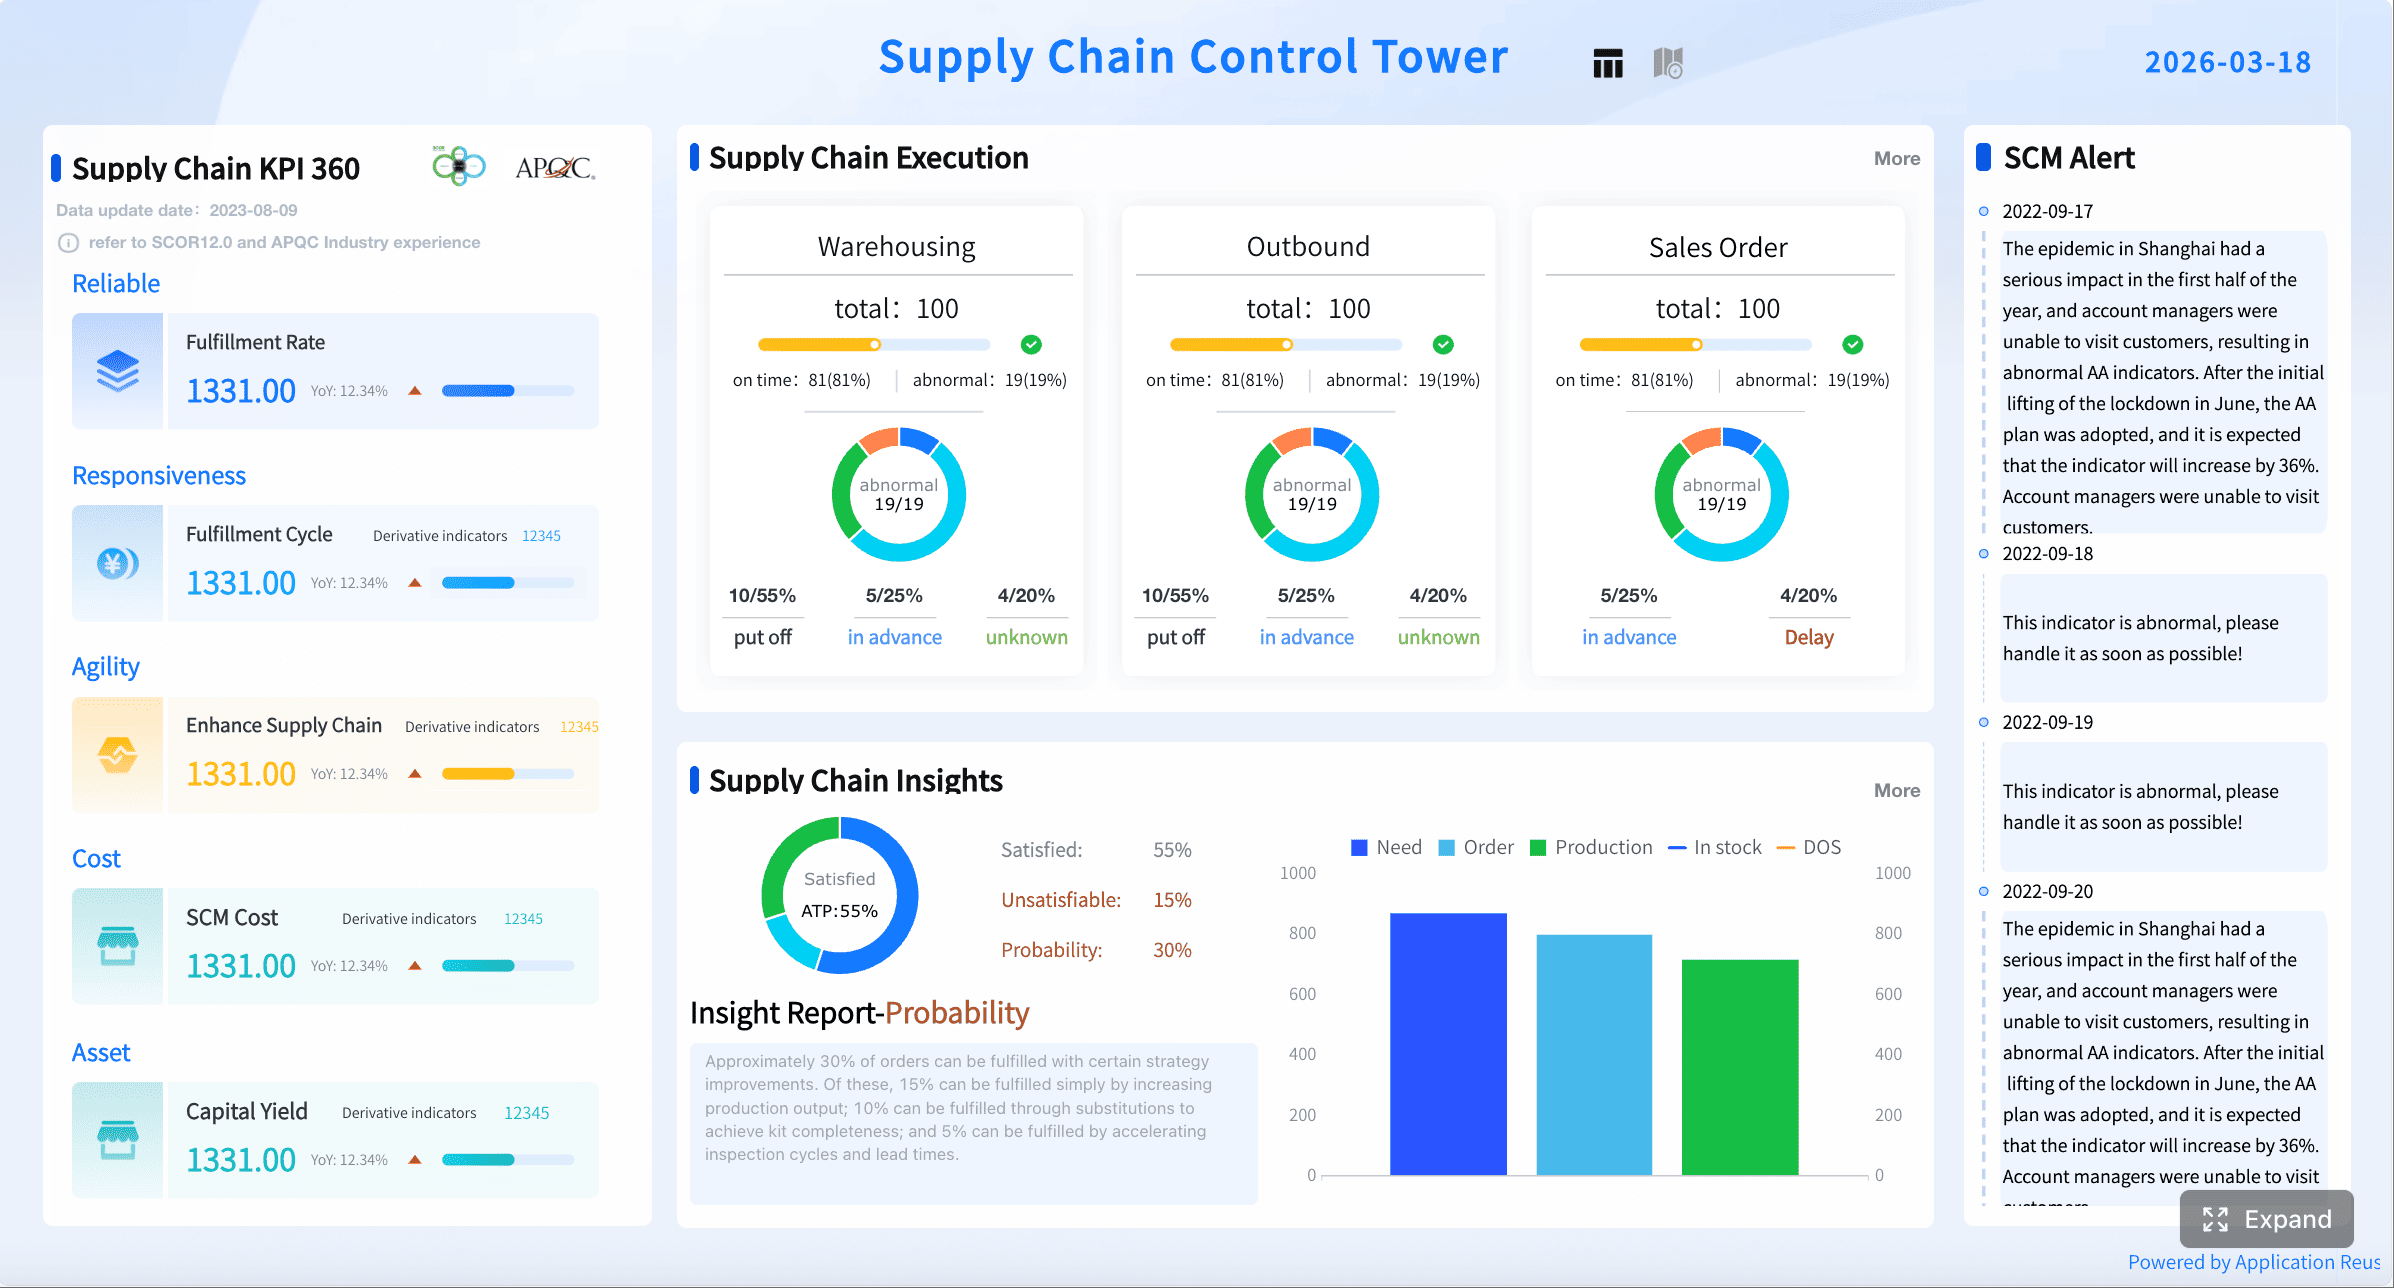
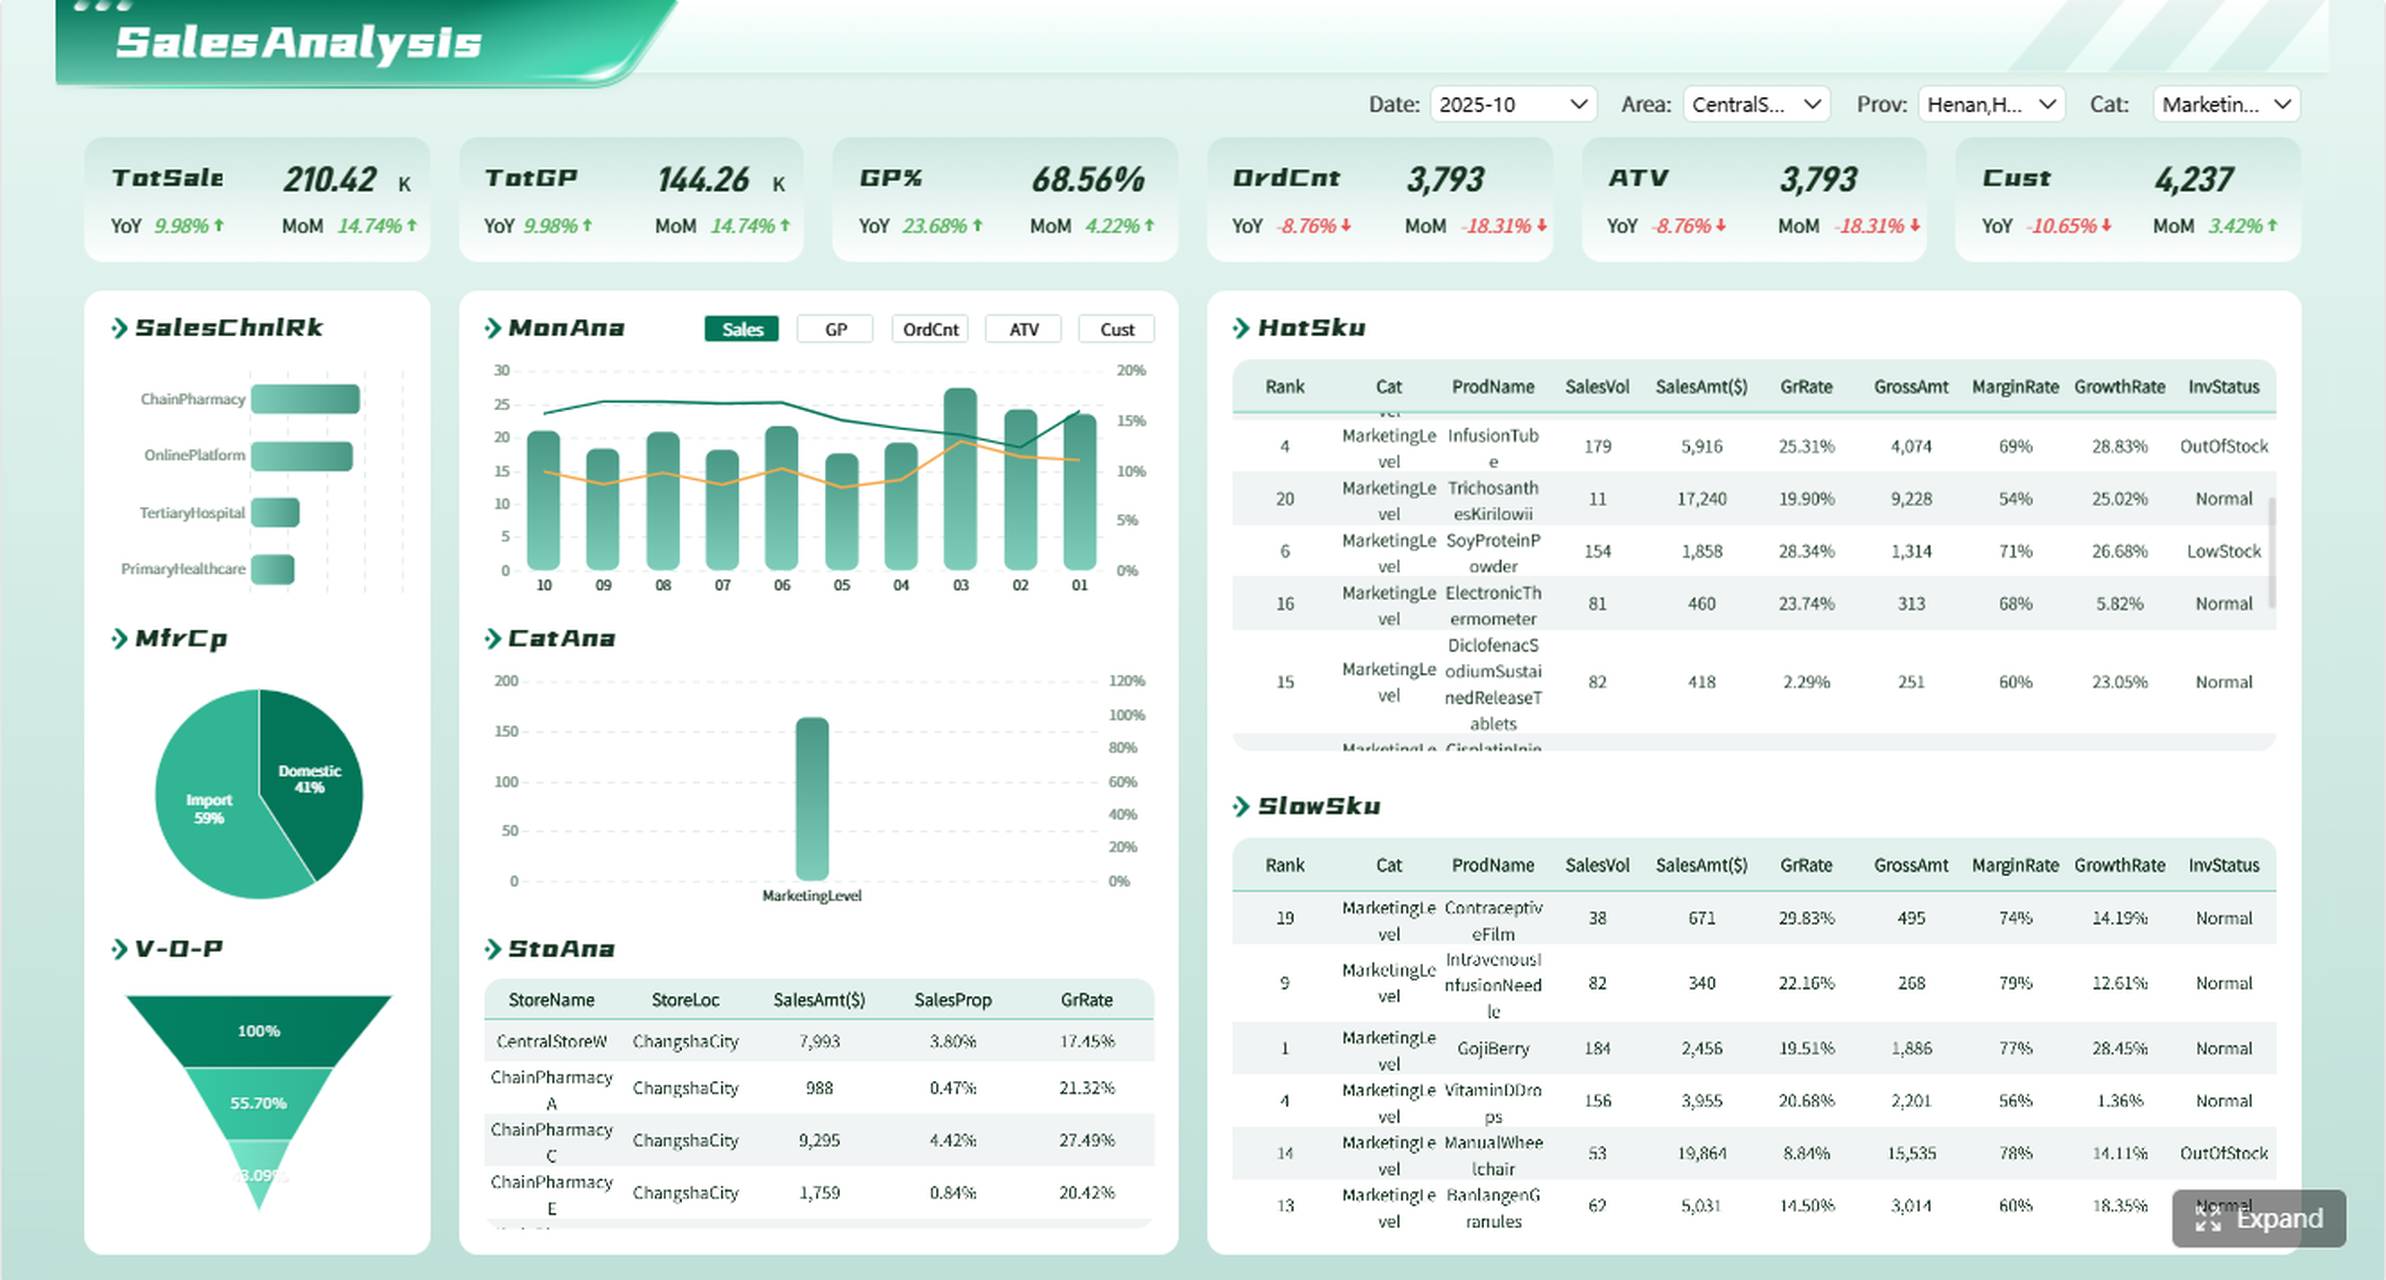
All reports in this article are built with FineReport
Core Sections in Order: What to Include in a Business Report Writing Format
A formal report works best when each section does one job well. Below is the standard order and what belongs in each part.
Title page and report details
The title page identifies the document clearly. In many companies, this page is simple, but it is still important because it frames the report before anyone reads the content.
Include these details when required:
Report title
Author name
Team, department, or organization
Submission date
Recipient or intended audience
Version number or confidentiality label, if applicable
The title should be specific. Compare these two examples:
A precise title saves time and sets expectations immediately.
Executive summary
The executive summary is a brief, stand-alone overview of the entire report. Senior leaders often read this section first—and sometimes only this section—before deciding whether to read deeper.
A strong executive summary should cover:
The business problem or objective
The scope of the report
Key findings
Main conclusion
Recommended action
Even though it appears near the front, write it last. That is the only way to ensure it accurately reflects the full report.
A simple executive summary formula:
What was reviewed?
What was found?
Why does it matter?
What should happen next?
Mini example:
This report reviews delayed procurement cycles across three manufacturing sites between January and March. Analysis shows that approval bottlenecks at the department head level account for 42% of delays. If unresolved, lead times will continue to affect inventory availability and overtime costs. It is recommended that the company standardize approval thresholds and automate escalation alerts.
Table of contents and optional lists
For short reports, a table of contents may not be necessary. For longer reports, it is essential. It helps readers navigate quickly, especially when multiple stakeholders review different sections.
Include a table of contents when the report has:
Several major sections
Multiple subsections
More than a few pages
Frequent references to figures or tables
Optional lists can also improve usability in data-heavy documents:
List of figures
List of tables
List of appendices
List of abbreviations, if the report uses many technical terms
This is especially useful in analytical, project, compliance, and operational performance reports.
Introduction, findings, and recommendations
This is the core of the report.
Introduction
The introduction tells the reader what the report covers and how to interpret what follows. It should establish context without becoming a full analysis section.
The purpose of this report is to assess customer churn trends in the subscription business during the first half of the year. The analysis covers cancellation data, support ticket themes, and renewal behavior across three customer segments.
Findings
The findings section presents the evidence. This is where many reports succeed or fail. Findings should be organized logically—not dumped in the order they were discovered.
Good ways to organize findings include:
By theme
By department
By time period
By location
By option being compared
By root cause and impact
Best practices for findings:
Use descriptive headings
Present one key idea per paragraph
Include relevant charts, tables, and comparisons
Separate facts from interpretation
Highlight patterns, exceptions, and implications
Conclusions and recommendations
Conclusions explain what the findings mean. Recommendations explain what to do next.
A common mistake is to jump to recommendations without clearly connecting them to the findings. In a well-structured business report writing format, each recommendation should trace back to evidence already presented.
Use this logic chain:
Finding: Customer onboarding delays increased by 18%
Conclusion: Delays are reducing early retention and increasing support volume
Recommendation: Standardize onboarding workflows and introduce SLA tracking by region
Recommendations should be:
Specific
Realistic
Prioritized
Time-bound where possible
Assigned to the right owner or function
Section-by-Section Checklist for a Formal Business Report Writing Format
If you want a report to look professional and perform well with executives, use a checklist at each stage. This reduces revisions and keeps the document aligned with its purpose.
Before drafting
Before writing, clarify the business context. This step prevents wasted effort and helps you choose the right report type and level of detail.
Use this pre-drafting checklist:
Identify the primary audience
Define the decision the report should support
Clarify whether the report is informational, analytical, or progress-based
Confirm required sections or internal templates
Determine the deadline and submission format
Check whether visuals, appendices, or supporting documentation are expected
Align on level of confidentiality and review process
A consultant’s advice: if the audience cannot answer “What decision will this report help me make?” the report brief is not ready.
While writing
This is where discipline matters. Professional reports are easy to read because the writer controls structure tightly.
Use these writing best practices:
Use clear heading levels
Keep sections easy to scan
Make sure each heading reflects the content below it
Keep numbering consistent
Use a standard pattern for sections, tables, and appendices
Do not switch styles halfway through
Write in straightforward business language
Prefer clarity over jargon
Use short, direct sentences where possible
Support claims with evidence
Add charts, figures, summaries, and comparisons
Do not rely on unsupported opinion
Keep paragraphs focused
One point per paragraph
Use transitions so the report flows logically
Separate summary from detail
Executive summary is not the place for full analysis
Findings sections should contain the supporting detail
Before submitting
Final review is where professionalism becomes visible. Many technically correct reports still fail because the final version is inconsistent, rushed, or unclear.
Use this submission checklist:
Does every section support the report objective?
Are all facts and calculations verified?
Are dates, labels, and units consistent?
Do headings match the table of contents?
Are charts readable and correctly titled?
Are grammar and spelling errors removed?
Are recommendations clearly tied to findings?
Is the formatting professional and consistent?
Have confidentiality and approval requirements been checked?
4 Best Practices to Implement a Strong Business Report Format
From a consulting perspective, these four practices make the biggest difference in enterprise environments:
1. Start with the decision, not the document
Define what the reader needs to decide, approve, or understand. Then build the report backward from that outcome.
2. Design the section flow before writing paragraphs
Outline first. Decide what belongs in summary, findings, and recommendations before filling in content.
3. Standardize visual evidence
Use repeatable chart styles, table layouts, and section formatting so readers do not waste time interpreting presentation choices.
4. Review recommendations for feasibility
A recommendation is only useful if it is operationally realistic, financially plausible, and clearly owned.
Example Structure for Common Use Cases of a Business Report Writing Format
Different report types use the same structural principles, but the emphasis changes depending on the purpose.
Informational report example
An informational report presents facts, updates, or results without arguing strongly for one solution. Its job is to inform, not persuade.
A typical structure might look like this:
Title page
Executive summary
Table of contents
Introduction
Current status or reporting period overview
Key data or performance results
Observations
Conclusion
Appendices
Example scenario: Monthly service performance report
Possible section flow:
Objective: Present service performance for the month
Scope: Call center, ticket response time, resolution rate
Findings: Volume trends, SLA achievement, top issue categories
Conclusion: Service levels improved, but backlog risk remains in one region
Analytical report example
An analytical report compares options, investigates causes, or recommends action. This is where structure matters most because readers need to follow the reasoning.
Findings: Conversion dropped after pricing changes in one segment
Conclusion: Pricing and onboarding friction are reducing close rates
Recommendation: Rework discount policy and simplify proposal approval
This type of report depends heavily on evidence sequencing. Present causes before recommendations.
Progress or project report example
A progress or project report is typically used to track milestones, resources, risks, and next steps. It is often less argumentative than an analytical report, but it still needs a clear structure.
A common format includes:
Title page
Executive summary
Project overview
Status against milestones
Budget status
Risks and issues
Dependencies
Next steps
Appendices
Example scenario: ERP implementation progress report
Typical content areas:
Planned vs. completed milestones
Budget used vs. remaining
Risks requiring escalation
Resource constraints
Actions for the next reporting cycle
Section
What It Answers
Project overview
What is this project and what phase are we in?
Milestone status
What has been completed and what is delayed?
Budget status
Are we on budget, over, or under?
Risks and issues
What may block progress?
Next steps
What happens before the next report?
Common Mistakes and Simple Ways to Improve your Business Report Writing Format
Even experienced professionals make format mistakes that weaken otherwise good reports. The good news is that most are easy to fix.
Mixing summary content with detailed analysis
The executive summary should not become a mini findings section full of evidence and technical detail. Keep it concise and decision-oriented.
Improve it by:
Summarizing only the key message
Moving detailed numbers into findings or appendices
Writing the summary last
Presenting recommendations without supporting findings
This is one of the fastest ways to lose credibility. Readers need to see why the recommendation makes sense.
Improve it by:
Linking every recommendation to a finding
Using a simple finding-conclusion-recommendation sequence
Removing opinions that are not evidence-based
Inconsistent formatting across headings, tables, numbering, and references
Formatting inconsistency makes a report look rushed and harder to trust.
Improve it by:
Using one heading hierarchy
Standardizing fonts, spacing, and table labels
Checking numbering and section names before submission
Weak skimmability
Dense paragraphs and poorly labeled visuals slow down executive readers.
Improve it by:
Using clear headings and subheadings
Keeping paragraphs tight
Adding bullets and tables where useful
Using charts to clarify complex comparisons
Unclear report objective
A report that does not clearly state its purpose forces the reader to guess what matters.
Improve it by:
Stating the objective in the introduction
Rechecking every section against that objective
Removing off-topic content
Build a Better Business Report Writing Format with FineReport
At a basic level, you can create reports manually in documents, spreadsheets, and slides. But in real business environments, that quickly becomes difficult to manage. Version control gets messy. Data updates become manual. Visual consistency slips. Cross-department reporting takes too long.
Building this manually is complex; use FineReport to utilize ready-made templates and automate this entire workflow.
That means less time formatting documents and more time producing reports that actually support action.
Whether you need an informational report, an analytical report, or a project progress report, FineReport can help you build a repeatable structure that scales across teams and reporting cycles.
A standard business report usually includes a title page, executive summary, introduction, findings, conclusion, recommendations, and appendices if needed. Some longer reports also include a table of contents and a methods or background section.
Write the executive summary after finishing the full report so it reflects the final content accurately. It should briefly explain the purpose, main findings, conclusion, and recommended next steps.
The findings section should present the key facts, data, observations, and analysis gathered during the report. It should stay focused on evidence and avoid mixing in recommendations too early.
A table of contents is most useful when the report is long, has multiple major sections, or will be reviewed by different stakeholders. For short reports, it is often unnecessary.
A business report is easier to use when it is clearly structured, concise, and supported by relevant evidence. Strong headings, consistent formatting, and actionable recommendations help readers scan it quickly and make decisions with confidence.
Product Trial
FineReport
Pixel-perfect reports · Interactive dashboards · Easy data entry · Digital twins