If you are responsible for performance visibility, cross-functional alignment, or executive reporting, knowing the right types of business report is not optional. The wrong report format creates slow decisions, scattered KPIs, and endless clarification meetings. The right one helps leaders spot risk early, compare performance quickly, and take action with confidence across sales, marketing, finance, HR, and operations.
What Are the Main Types of Business Report and Why They Matter
A business report is a structured document or dashboard that presents data, findings, and sometimes recommendations to support business decisions. It may be operational and routine, such as a daily fulfillment report, or strategic and analytical, such as a market expansion recommendation report. What matters is not just the data itself, but how clearly it helps the audience answer a business question.
Different departments use different reporting styles because they solve different problems. A sales manager needs pipeline movement and close rates. A CFO needs margin, cash flow, and forecast variance. An HR leader needs retention, hiring velocity, and compliance status. The report type changes based on three factors:
Business goal: monitor, explain, evaluate, or recommend
Audience: frontline managers, executives, investors, or cross-functional teams
That is why understanding the main types of business report gives organizations a real advantage. It improves communication, removes ambiguity, and makes reporting more useful instead of merely formal.
In this guide, we will cover seven essential report types and show where each one fits best:
7 Essential Types of Business Report by Department
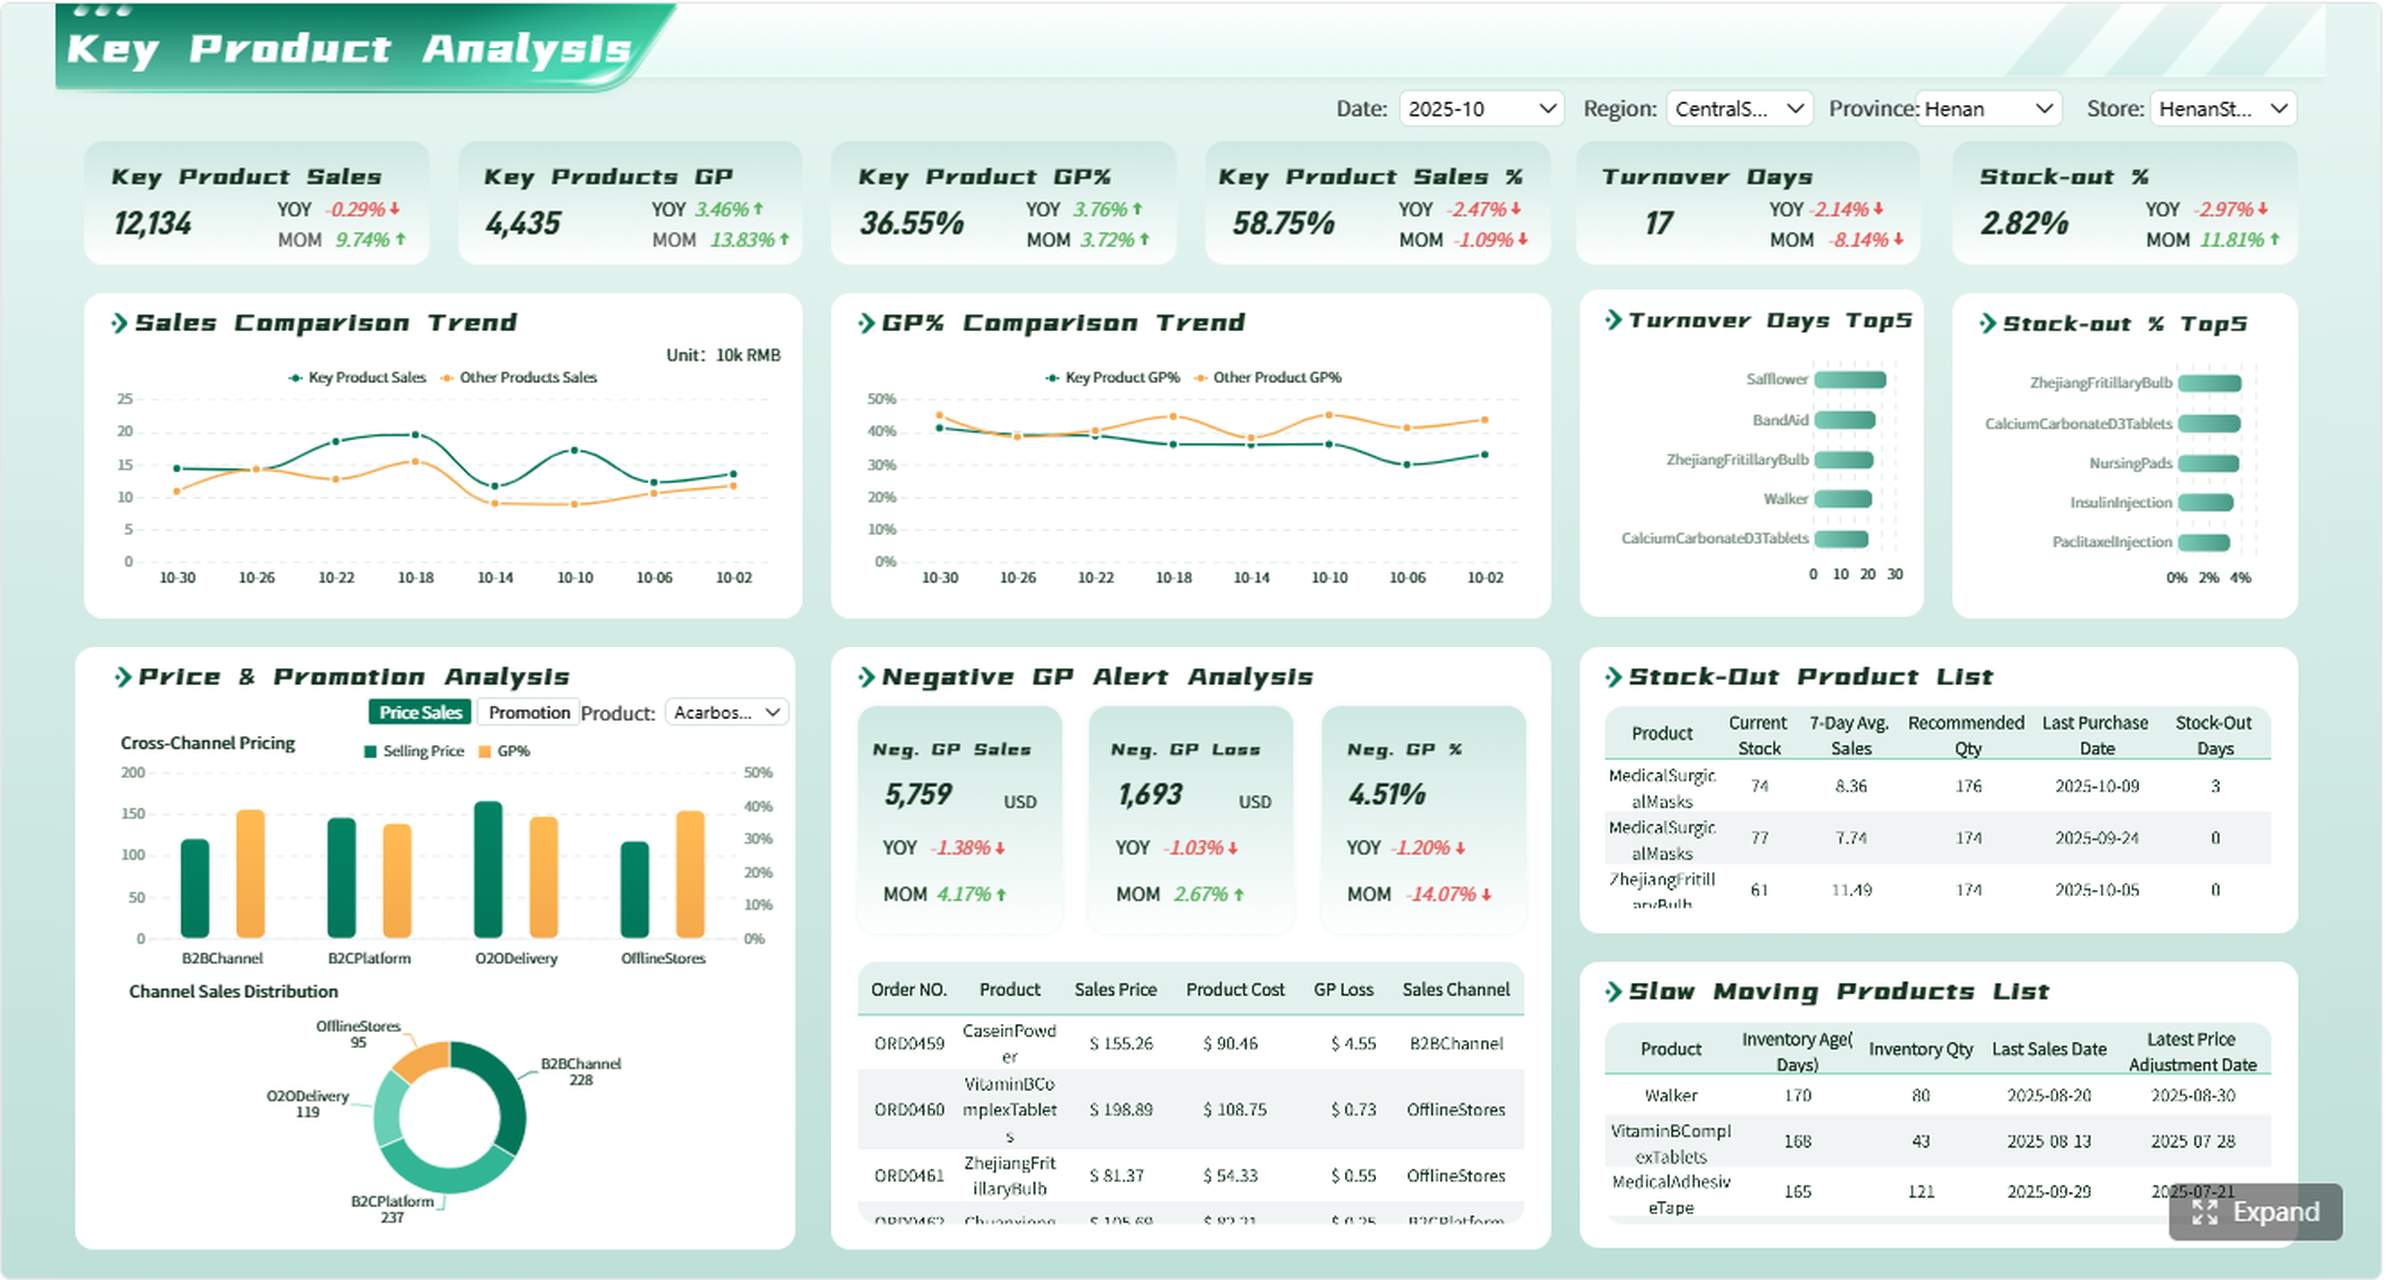
Sales Reports
Sales reports are designed to track commercial performance and expose where revenue is being won or lost. They typically show trends in bookings, pipeline value, conversion rates, average deal size, rep productivity, and regional performance.
For leadership teams, sales reports answer questions like:
Are we on track to hit target?
Which territories are underperforming?
Where are deals stalling in the funnel?
Which reps or teams need support?
A common use case is a weekly sales performance review. In that setting, leadership does not want raw CRM exports. They want a concise report with actual versus target, pipeline coverage, stage conversion, forecast confidence, and top risks.
All reports in this article are built with FineReport.
Pipeline health: shows deal volume and value by stage
Conversion rate: measures funnel efficiency
Average deal size: reveals account quality and pricing impact
Territory performance: compares regions or account segments
Forecast accuracy: tests whether expected revenue is realistic
Marketing Reports
Marketing reports measure whether campaigns are producing qualified pipeline, revenue contribution, and brand growth at an acceptable cost. They help teams move beyond vanity metrics and focus on efficiency and business impact.
A practical example is a monthly digital marketing performance summary for department heads. This report should not just show clicks and impressions. It should connect spend to leads, leads to pipeline, and pipeline to revenue.
Lead volume: number of leads generated in a period
Lead quality: share of leads that meet qualification standards
Conversion rate: percentage moving from lead to opportunity or customer
Customer acquisition cost (CAC): cost to acquire one customer
Channel ROI: revenue or pipeline generated relative to spend
Engagement rate: interaction level across digital channels
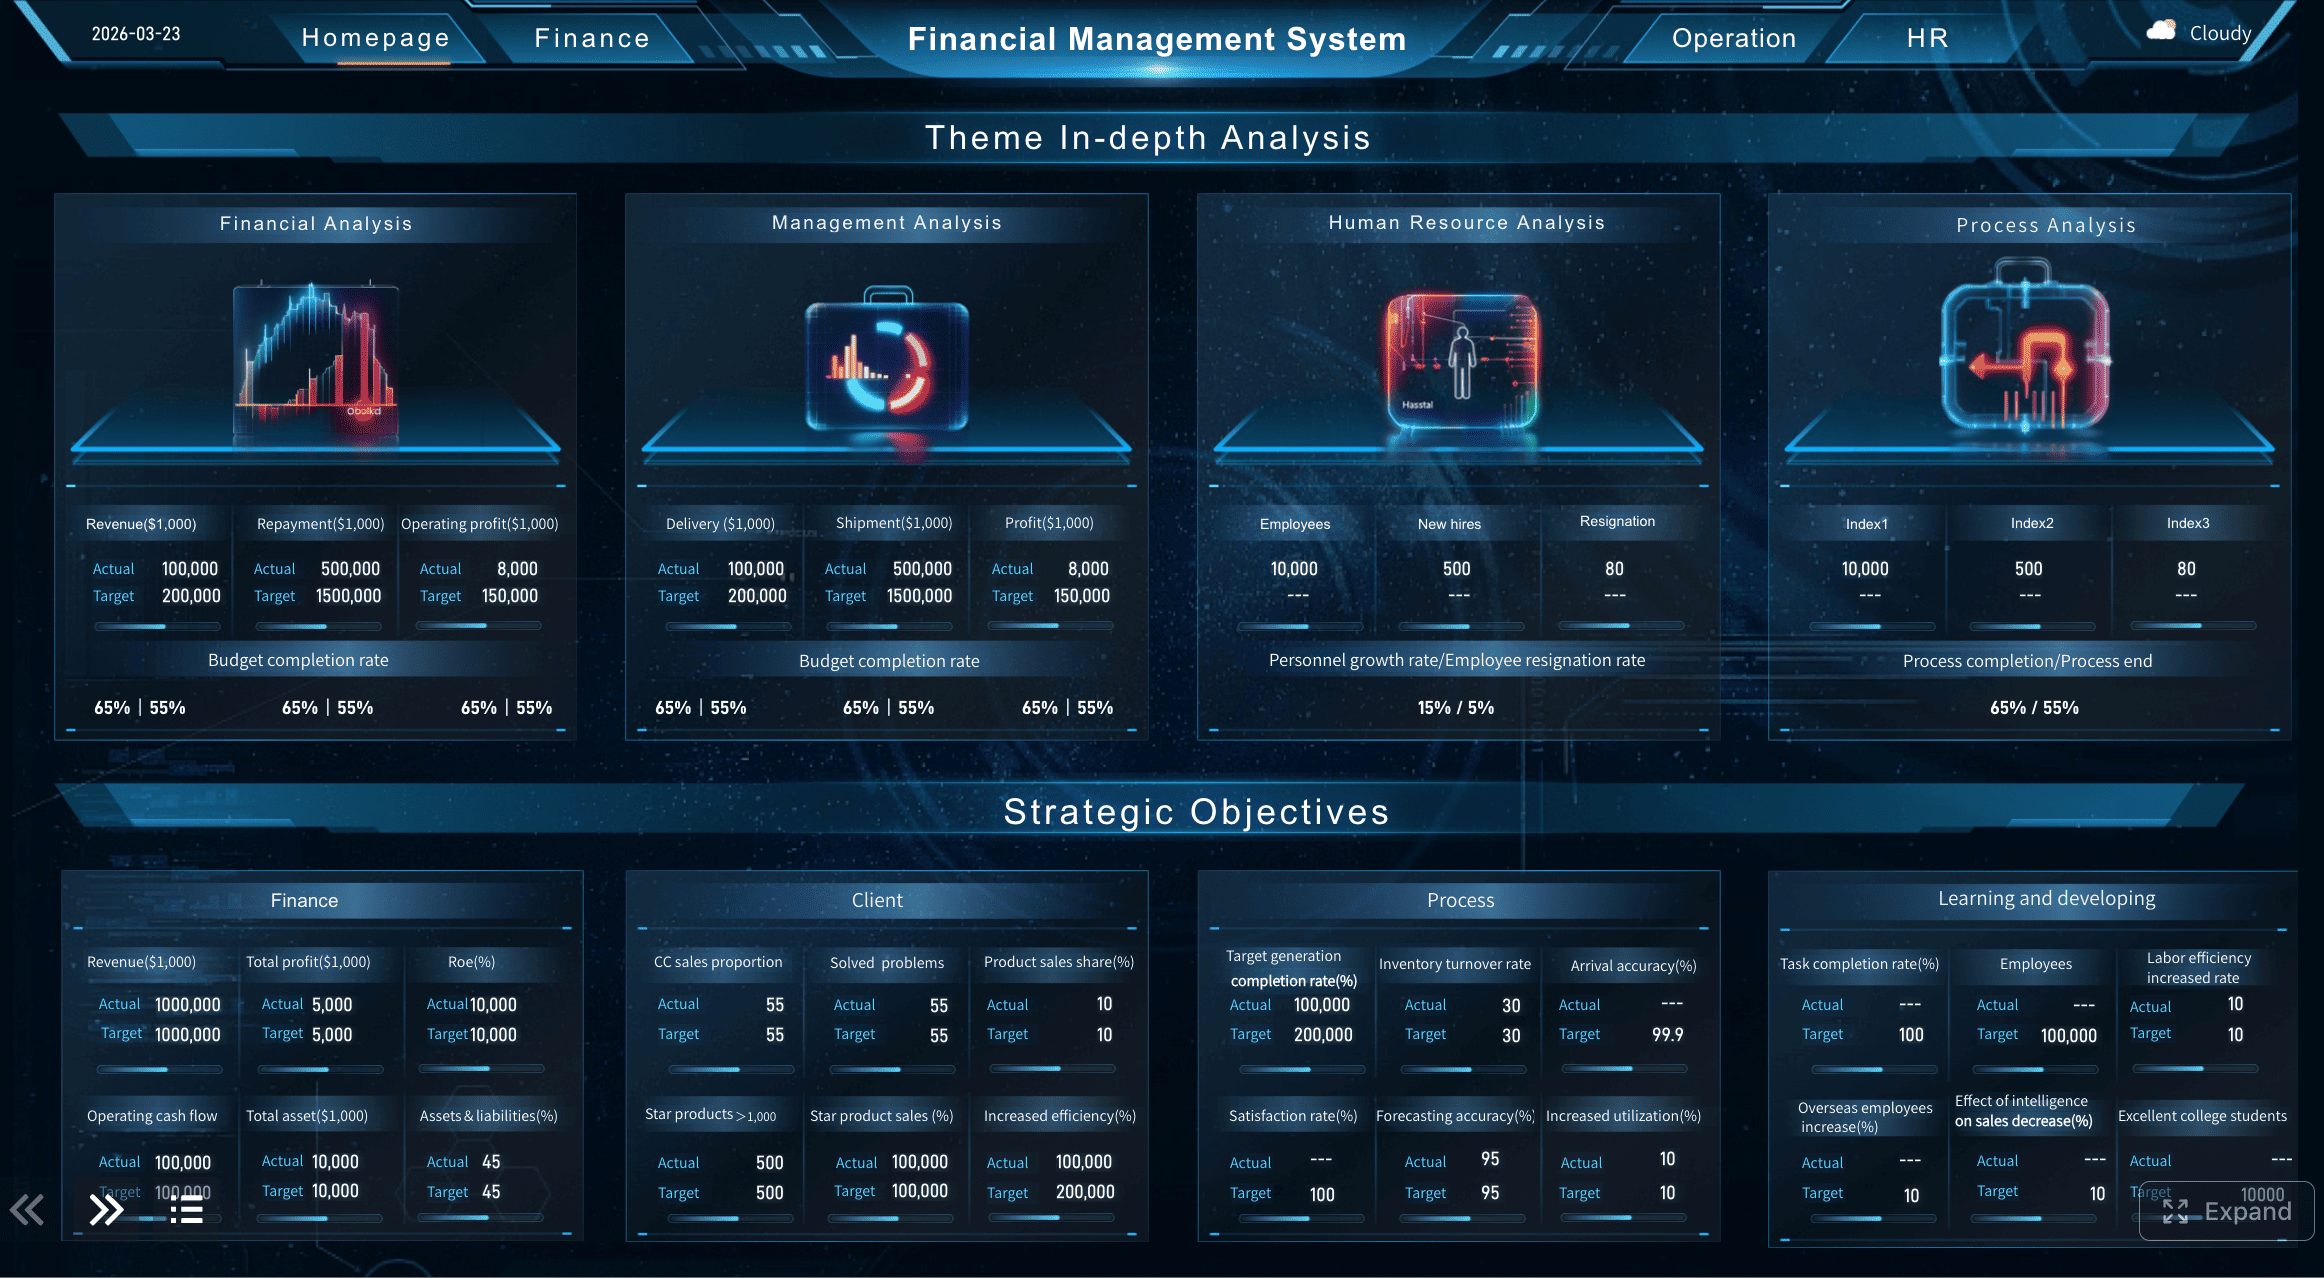
Finance Reports
Finance reports are among the most critical types of business report because they shape resource allocation, risk management, and investor confidence. These reports provide a structured view of financial health and future sustainability.
Most finance reporting includes:
budget versus actual
profit and loss summary
cash flow status
balance sheet indicators
cost structure
forecast and variance analysis
financial risk signals
A standard use case is a quarterly financial review for executives and investors. This report should highlight what changed, why it changed, and what management should do next.
Core financial KPIs:
Revenue: total income generated in the reporting period
Gross margin: profitability after direct costs
Operating expense ratio: operating costs relative to revenue
Cash flow: net cash movement from operations and other activities
Budget variance: difference between planned and actual spending or revenue
Forecast accuracy: reliability of financial projections
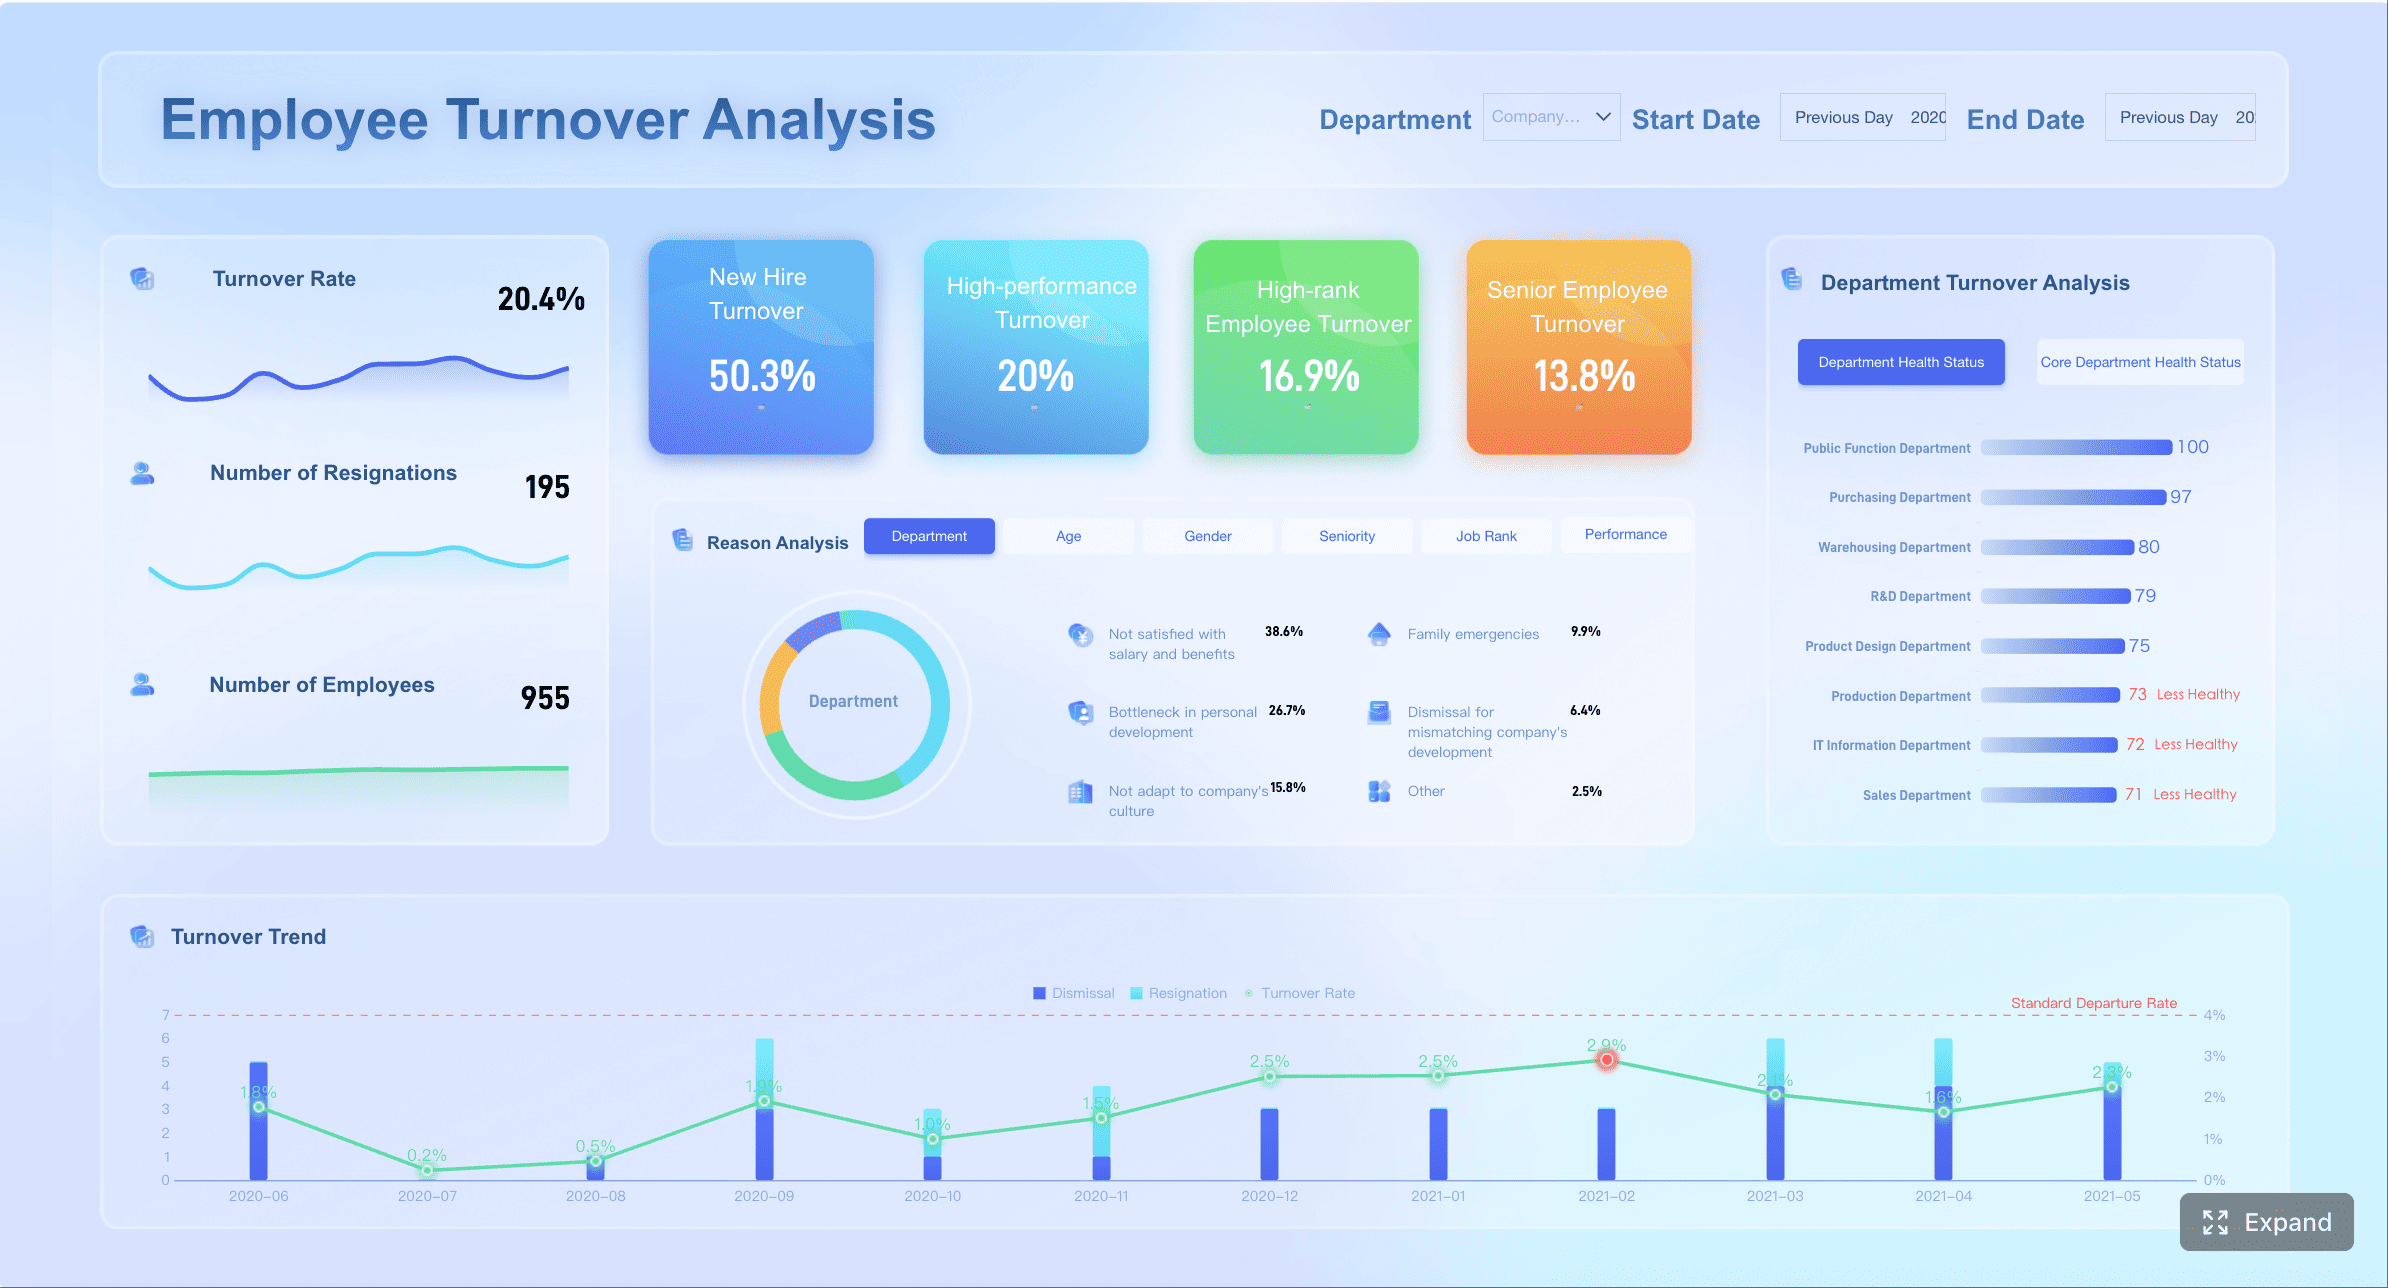
HR Reports
HR reports translate workforce activity into management insight. They help leaders understand whether talent, retention, and capability building are keeping pace with business goals.
A high-value HR report may cover:
hiring progress by role or department
headcount changes
turnover and retention
absenteeism
training completion
employee engagement
compliance gaps
A frequent use case is a headcount and retention update for management. This report helps leaders assess whether teams are adequately staffed, where turnover risk is rising, and whether talent initiatives are effective.
Turnover rate: percentage of employees leaving in a period
Retention rate: percentage of employees staying over time
Training completion: progress against required learning plans
Compliance status: adherence to policy, labor, or certification requirements
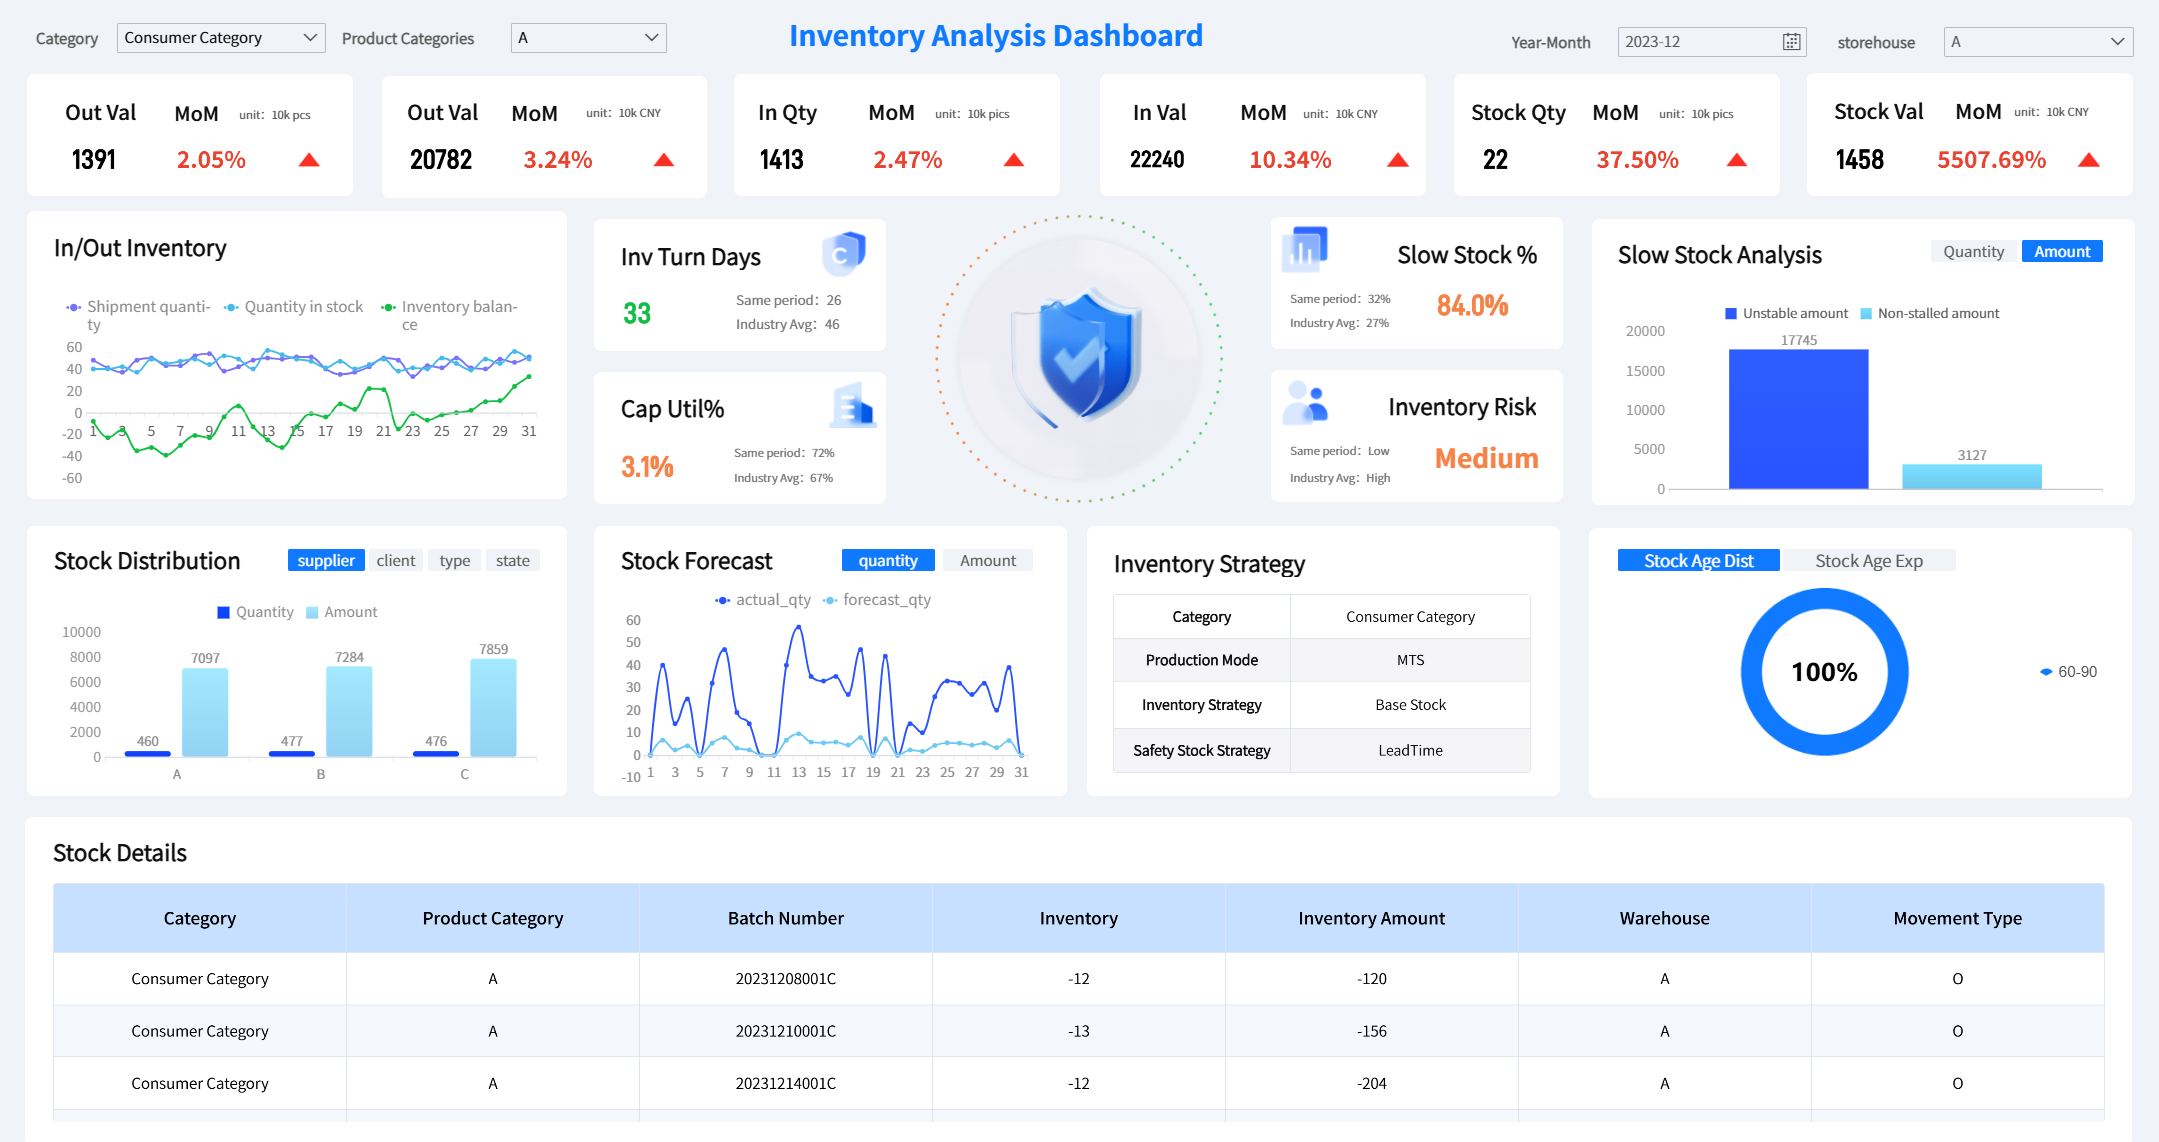
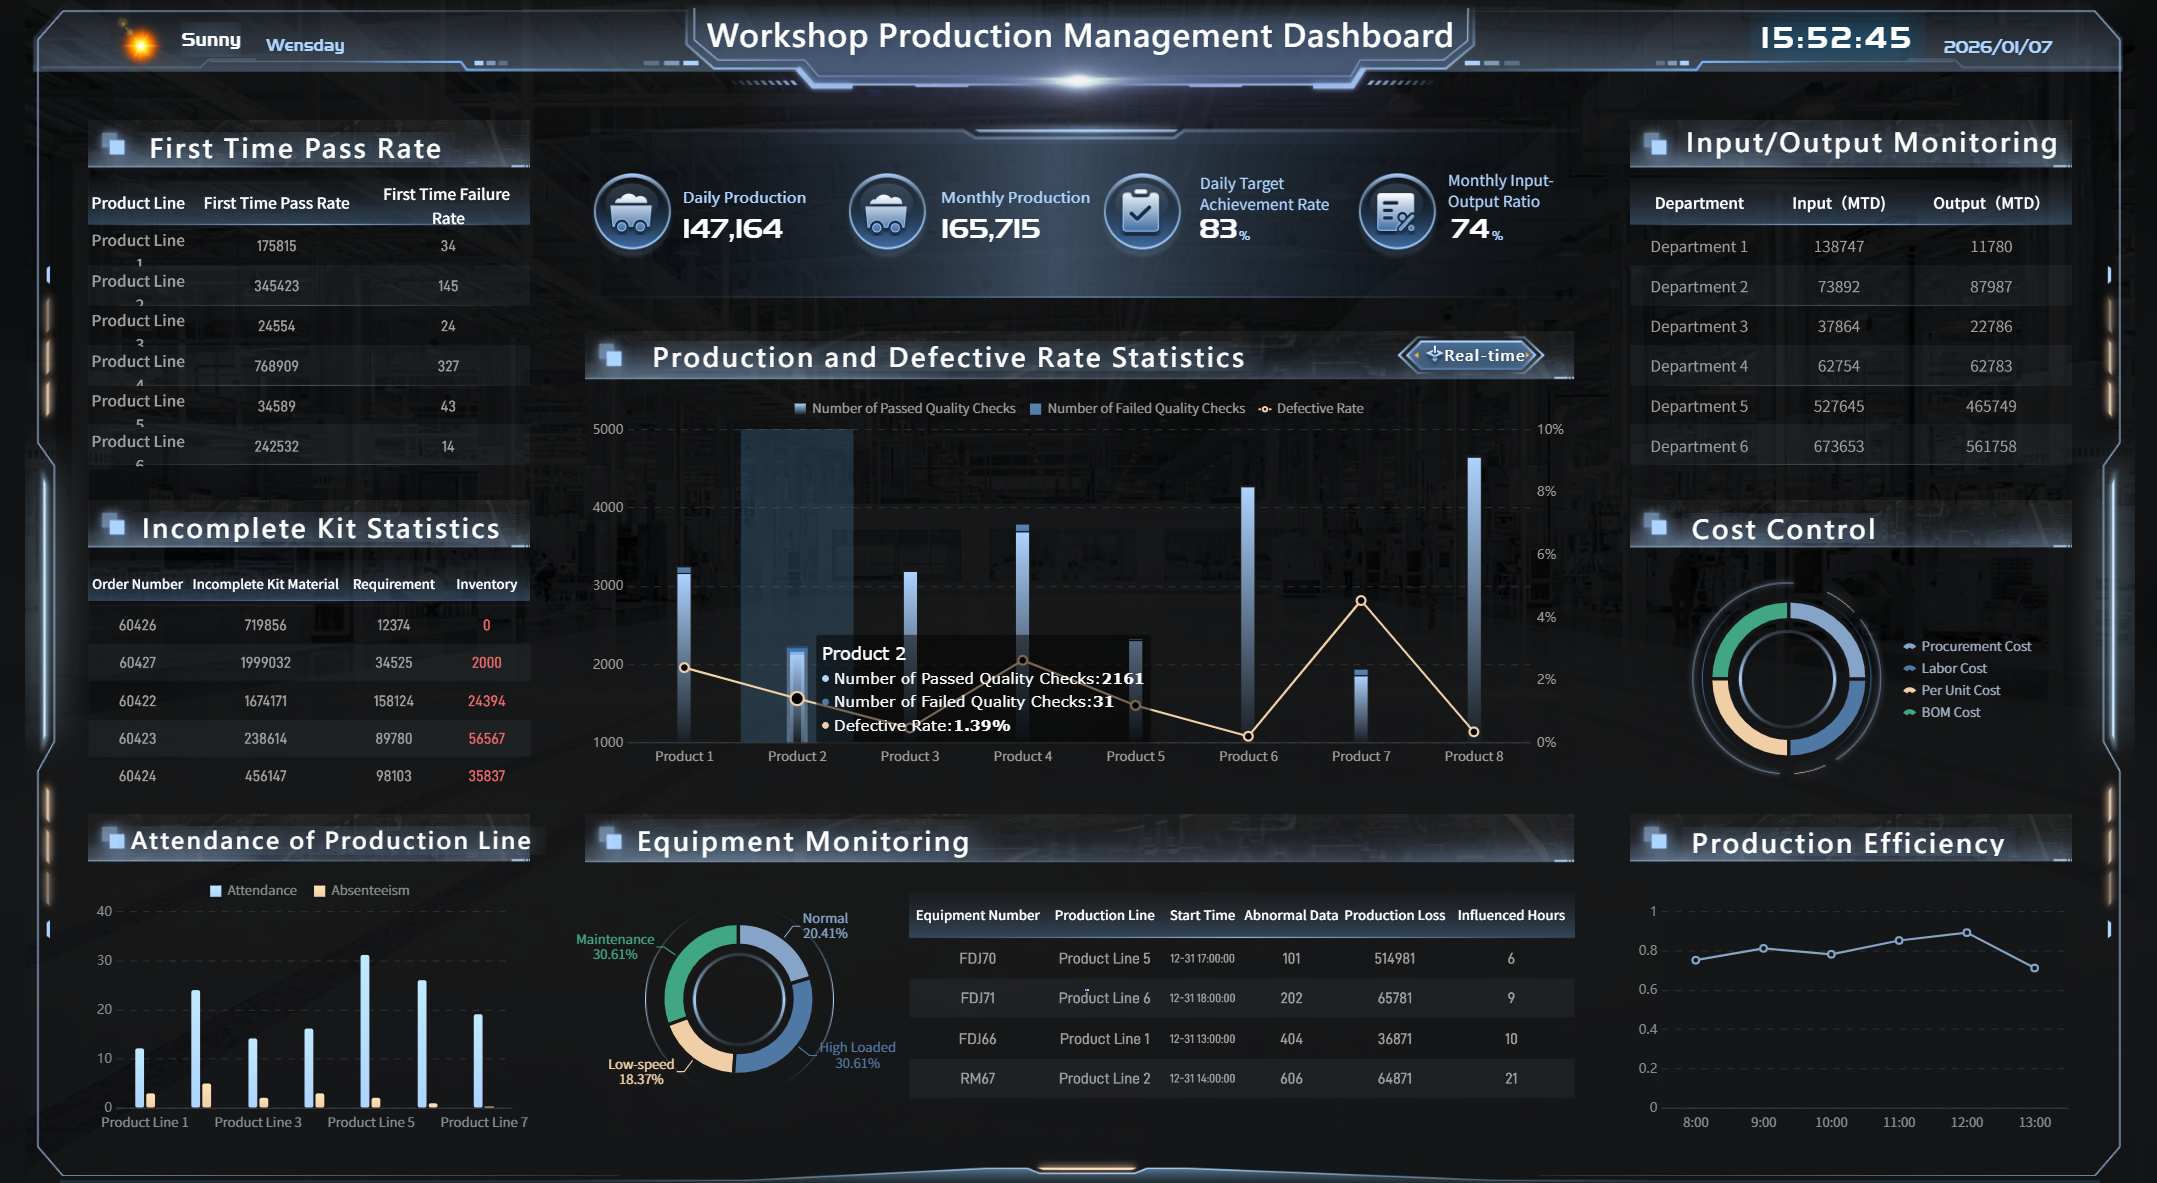
Operations Reports
Operations reports are built for speed and control. They help operations directors, plant managers, and supply chain leaders monitor efficiency, capacity, quality, and service levels.
These reports usually focus on:
production output
inventory levels
order fulfillment
cycle time
quality defect rate
downtime
on-time delivery
A typical scenario is an operations dashboard for daily performance tracking. This report must be highly visual and easy to scan. The goal is immediate action, not delayed interpretation.
Key Metrics (KPIs) for operations reports:
Throughput: volume processed or produced in a set period
Inventory turnover: speed at which stock is used or sold
Order fulfillment rate: percentage of orders completed successfully
Cycle time: time required to complete a process
Defect rate: percentage of output not meeting quality standards
On-time delivery: percentage of shipments delivered as scheduled
Progress and Status Reports
Progress and status reports track ongoing work. They are especially useful in project management, transformation programs, software delivery, construction, and cross-functional initiatives.
They summarize:
milestones completed
current status by workstream
blockers and risks
timeline changes
ownership
next steps
A common use case is a cross-functional project status update. This report keeps teams aligned and prevents surprises. It is less about deep analysis and more about clarity, accountability, and momentum.
A good progress report should show:
what was completed
what is delayed
what needs escalation
what happens next
Analytical and Recommendation Reports
Analytical and recommendation reports go beyond showing data. They interpret findings, compare options, and propose a course of action. This is where reporting becomes strategic.
These reports are ideal when leaders need to decide between alternatives such as:
entering a new market
changing suppliers
restructuring a process
increasing investment in a channel
launching a product line
A strong example is a report recommending a new market expansion strategy. It would include market potential, competitive analysis, operational feasibility, risk assessment, and a final recommendation backed by evidence.
This type of report usually includes:
context and business question
methodology
comparative analysis
scenarios or options
recommendation
expected impact and risks
Types of Business Report Explained: Key Features and Use Cases
Common Features of an Effective Report
No matter the category, the best business reports share the same fundamentals. They are built for decision-making, not just documentation.
Common features of an effective report:
Clear purpose: the report answers a defined business question
Relevant metrics: only data tied to decisions is included
Concise structure: the reader can scan and understand quickly
Actionable insight: findings point to a specific implication
Visual clarity: charts, tables, and summaries reduce interpretation time
Consistency: KPI definitions and reporting periods stay stable
Credibility: data is trusted and reconciled across systems
A report that tries to do everything usually fails to do anything well. Enterprise teams should design reports around the decisions they need to support.
When to Use Each Report Format
Choosing the right report format depends on the audience, urgency, and objective.
Use routine reports for recurring visibility. Use analytical reports when a decision requires interpretation, trade-offs, and a recommendation.
Benefits of Choosing the Right Report Type
When companies match the report format to the business need, they gain measurable benefits:
Faster decision-making
Better communication across teams
Clearer ownership and accountability
Less reporting noise and duplication
More trust in the data
Stronger alignment between departments and leadership
In practice, the right report type reduces meeting time, improves follow-through, and helps leaders focus on what actually matters.
How to Write Types of Business Report That Get Used
Start With Purpose, Audience, and Scope
Before building any report, define three things:
What business question must this report answer?
Who will read it and what decisions will they make?
How much depth is necessary?
This step prevents one of the most common reporting failures: overloading the audience with irrelevant information. An executive needs summary, risk, and recommendation. An operations manager may need real-time detail and exception alerts.
Organize Findings Into a Clear Structure
A business report should be easy to navigate. Even if the report is dashboard-based, the structure should remain obvious.
Use a logical flow such as:
executive summary
reporting period and scope
key KPIs
trends and exceptions
interpretation or findings
recommendations or next steps
This structure makes the report easier to consume and easier to trust.
Present Data Clearly and Credibly
Bad reporting often comes from inconsistent definitions, fragmented systems, and unclear visuals. To avoid that:
standardize KPI logic
align date ranges and filters
avoid cluttered charts
use labels that business users understand
highlight deviations, not just totals
separate facts from recommendations
For enterprise teams, credibility matters as much as clarity. If decision-makers doubt the numbers, the report fails regardless of design quality.
End With Actions and Next Steps
The most useful business reports do not stop at findings. They convert information into action.
Every report should answer:
What needs attention now?
Who owns the response?
What is the deadline?
What should be monitored next?
That final step is what turns reporting into operational control.
Actionable Best Practices for Implementing Business Reporting
If you want your reporting system to be adopted across departments, follow these practical best practices.
1. Standardize KPIs Before You Standardize Dashboards
Define revenue, lead, turnover, forecast, fulfillment, and other core measures centrally. Different teams should not calculate the same metric in different ways.
2. Build Role-Based Views
Executives, department heads, and analysts need different report depth. Give each audience the same truth, but in a format suited to their decisions.
3. Automate Data Refresh and Distribution
Manual reporting creates delays, version confusion, and spreadsheet risk. Schedule refreshes and deliver reports automatically to the right stakeholders.
4. Use Exception-Based Reporting
Do not force busy leaders to search for issues. Highlight threshold breaches, target misses, unusual trends, and risk indicators automatically.
5. Review Reports as a Business Process, Not Just a Document
The report itself is only one part of performance management. Pair it with regular review cadences, clear owners, and action tracking.
Choosing Right Types of Business Report for Business Success
The best reporting strategy is not about producing more reports. It is about using the right types of business report for each decision layer of the business.
Department leaders need specialized reports:
sales for pipeline and quota visibility
marketing for campaign and acquisition performance
finance for budgeting and risk control
HR for workforce planning
operations for execution and efficiency
Management and stakeholders often need broader views:
Project leaders: use progress and status reporting first
Strategy teams: focus on analytical and recommendation reports
Build These Types of Business Report Faster With FineReport
Building this manually is complex; use FineReport to utilize ready-made templates and automate this entire workflow.
For most enterprises, reporting breaks down because data lives in too many systems, report logic is inconsistent, and teams still rely on spreadsheet-heavy processes. FineReport helps solve that by giving you a faster, more controlled way to build and scale business reporting across departments.
create sales, marketing, finance, HR, and operations dashboards faster
connect multiple data sources into one reporting layer
standardize KPIs across teams
automate scheduled updates and report delivery
build drill-down dashboards for both executives and analysts
use ready-made templates instead of starting from scratch
Get Ready-to-Use Dashboard Templates in Fine Gallery
For organizations that need reporting to drive action, not just satisfy routine, that matters. Instead of manually assembling separate files every week, teams can centralize reporting, improve trust in metrics, and give decision-makers faster access to the answers they need.
The main types usually include sales, marketing, finance, HR, operations, progress or status, and analytical or recommendation reports. Each one supports a different decision-making need and audience.
Start with the report’s purpose, audience, and how quickly decisions need to be made. A daily operations report is very different from a quarterly executive finance review.
A strong business report should include clear objectives, relevant KPIs, simple visuals, and concise explanations of what changed. It should help readers understand performance quickly and decide what to do next.
An informational report mainly presents facts, metrics, or updates without much interpretation. An analytical report goes further by explaining causes, identifying trends, and often suggesting actions.
Dashboards make it easier to track multiple KPIs in one place and spot trends or risks faster. They also reduce manual reporting work and improve alignment across departments.
Product Trial
FineReport
Pixel-perfect reports · Interactive dashboards · Easy data entry · Digital twins