Setting up an employee dashboard in 2026 is simple and effective. Modern BI tools like FineBI from FanRuan provide a user-friendly interface, real-time data processing, and self-service features that let you build dashboards without IT support. The drag-and-drop functionality makes creating an hr dashboard accessible for everyone. You can boost employee engagement, streamline hr processes, and make better decisions with accurate data. This guide empowers you to create a dashboard that fits your organization’s needs.
Feature
FineBI (Modern BI Tool)
Traditional Methods
User-Friendly Interface
Yes
Often requires IT support
Real-Time Data Processing
Yes
Limited capabilities
Self-Service Capabilities
Yes
Requires technical expertise
Drag-and-Drop Functionality
Yes
Not available
Understanding Employee Dashboards
What Is an Employee Dashboard
An employee dashboard is a digital tool that brings together important information about your workforce in one place. You can use it to view and manage employee profiles, track attendance, and monitor work schedules. This tool connects with other systems, such as payroll and performance management, to keep your data consistent. You receive instant notifications about schedule changes or company announcements. Even if you lose internet access, you can still use core features. Many dashboards include geolocation for attendance tracking and safety, while protecting privacy. Security features like multi-factor authentication and clear privacy policies help you trust the system with sensitive data.
Here are some core features you will find in a modern employee dashboard:
Feature
Description
Comprehensive Profile Management
Manage personal and professional details without delays.
Time and Attendance Functionality
Clock-in/out and scheduling tools for flexible work.
Integration Capabilities
Connects with payroll, benefits, and performance systems.
Push Notifications
Alerts for schedule changes and announcements.
Offline Capabilities
Access core functions without internet.
Geolocation Features
Track attendance and safety while respecting privacy.
Comprehensive Data Protection
Access controls and audit logging for data safety.
Multi-Factor Authentication
Extra security for user accounts.
Transparent Privacy Practices
Clear explanations of data collection and use.
Why Employee Dashboards Matter
You need an employee dashboard to make your work life easier and more organized. It helps you and your team track attendance and spot patterns in absenteeism. You can use compensation analytics to check if pay is fair and plan your budget better. When you monitor employee engagement, you can address problems before they grow, which leads to better retention. An hr dashboard also supports your hr team by giving them real-time data for smarter decisions.
Here are some benefits organizations have seen after using employee dashboards:
Benefit
Description
Improved Attendance Tracking
See employee presence and absenteeism patterns early.
Compensation Analytics
Ensure fair pay and optimize benefits for better planning.
Enhanced Employee Engagement
Monitor engagement metrics to improve retention and workplace satisfaction.
Tip: When you use an employee dashboard, you give your team the tools to work smarter and stay connected.
Setting Goals for Your Employee Dashboard
Define Objectives and Audience
You need to start with a clear purpose when building an employee dashboard. Think about what you want to achieve and who will use the dashboard. Many organizations follow these steps:
Define the main objectives for the dashboard.
Talk with key people in your company to gather their needs.
Pick a software platform that fits your data and user experience goals.
Train your team so everyone knows how to use the dashboard.
You can use the dashboard to foster open conversations about performance. When you give employees access to their own data, you help them understand their progress. This approach also helps you spot training needs and plan career growth. You can make fair decisions about promotions and rewards because you have clear data. A well-designed hr dashboard supports employee engagement by making information easy to find and understand.
Tip: Involve both managers and employees early in the process. This ensures the dashboard meets everyone’s needs.
Align Metrics with Business Needs
You should always connect your dashboard metrics to your company’s goals. This helps your hr team make better decisions and keeps everyone focused on what matters most. The table below shows how you can align metrics with business needs:
Step
Description
Identifying Relevant Metrics
Focus on strategic hr kpis like recruitment, retention, and employee satisfaction.
Setting Clear Objectives
Work with stakeholders to decide what insights you need from the dashboard.
Data-Driven Decision Making
Use the dashboard to analyze trends and spot issues before they become bigger problems.
When you align your metrics with business needs, you create a tool that supports real progress. You can track important trends, improve employee engagement, and make sure your hr dashboard delivers real value.
Integrating Data with FineBI and FanRuan
Connect HR Data Sources
You can connect your HR data to FineBI and FanRuan with just a few steps. This integration gives you a single view of all your workforce information. FineBI supports over 60 data sources, so you can bring together data from many places. You might use databases, cloud warehouses, or APIs. Many companies use integration with hr systems like HRIS or ATS to build a strong human resource dashboard. You can also connect to platforms such as ADP Workforce Now, which combines payroll, compliance, and advanced analytics. These connections help you automate HR processes and get detailed, real-time reports.
Here are some common HR data sources you can integrate:
HRIS (Human Resource Information System)
ATS (Applicant Tracking System)
Payroll systems like ADP Workforce Now
Cloud data warehouses
APIs for real-time updates
When you set up these connections, you unlock actionable insights and alerts for your hr dashboard. You can see employee engagement trends, track attendance, and monitor compensation in real time. This integration turns your data into actionable insights for better decision-making.
Ensure Data Quality and Consistency
You need to make sure your data stays accurate and reliable. Good data quality means your employee dashboard always shows the right information. You can follow these best practices to keep your data clean and consistent:
Best Practice
Description
Create and maintain a data dictionary
Document every piece of data for consistency across systems.
Automate data capture
Set up HR systems to enforce standards and reduce errors.
Implement access control
Define who can access and change data based on their roles.
Establish data validation and verification
Check data regularly to meet quality standards.
Integrate data and manage it carefully
Keep a trusted source that is updated and audited in real time.
Adhere to IT and cybersecurity standards
Protect data with strong security protocols.
Train all users
Teach everyone about data quality procedures.
You can use FineBI to automate data checks and set up real-time alerts for any issues. This approach ensures your actionable insights and alerts are always based on the latest, most accurate information. When you follow these steps, your hr dashboard becomes a trusted tool for your team.
You need clean and reliable data to build an effective employee dashboard. Start by standardizing entries so that names, dates, and job titles follow the same format. This step improves data quality and makes analysis easier. Next, validate your data to catch errors like missing values or duplicates. Removing duplicate records prevents your reports from showing the same employee twice. Normalize your data so that all information uses a consistent format. For example, use the same date style across all records. You should also consolidate data from different sources into one dataset. This gives you a complete view of your workforce. Finally, set up governance policies to keep your data accurate and consistent over time.
Here is a simple table to guide you through the cleaning process:
Step
Description
1
Standardization of entries to improve data quality.
2
Validation of data to check for errors like missing values and duplicates.
3
Deduplication to remove duplicate records that can skew analysis.
4
Normalization to transform data into a consistent format for analysis.
5
Consolidation of data from multiple sources into a single dataset.
6
Governance to enforce policies ensuring data quality and consistency.
Tip: Clean data helps your hr dashboard deliver accurate insights and supports better decision-making.
Build Self-Service Data Sets
You can empower your HR team by building self-service data sets. These data sets let you customize your dashboard to focus on the metrics that matter most to your organization. When you use self-service tools, you gain insights into important areas like employee performance, talent acquisition, and workforce demographics. This approach helps you make informed decisions and respond quickly to changes.
Some key areas you can explore with self-service data sets include:
Workforce demographics: See diversity and distribution across your company.
Talent acquisition and turnover: Track time-to-fill and turnover rates for better talent management.
Employee performance: Identify strengths and areas for development or succession planning.
Metrics Hub of FineBI
When you build your own data sets, you support employee engagement and create a dashboard that fits your unique needs. You also give your hr team the flexibility to adapt as your business grows.
Create Dashboards with FineBI
Drag-and-Drop Dashboard Design
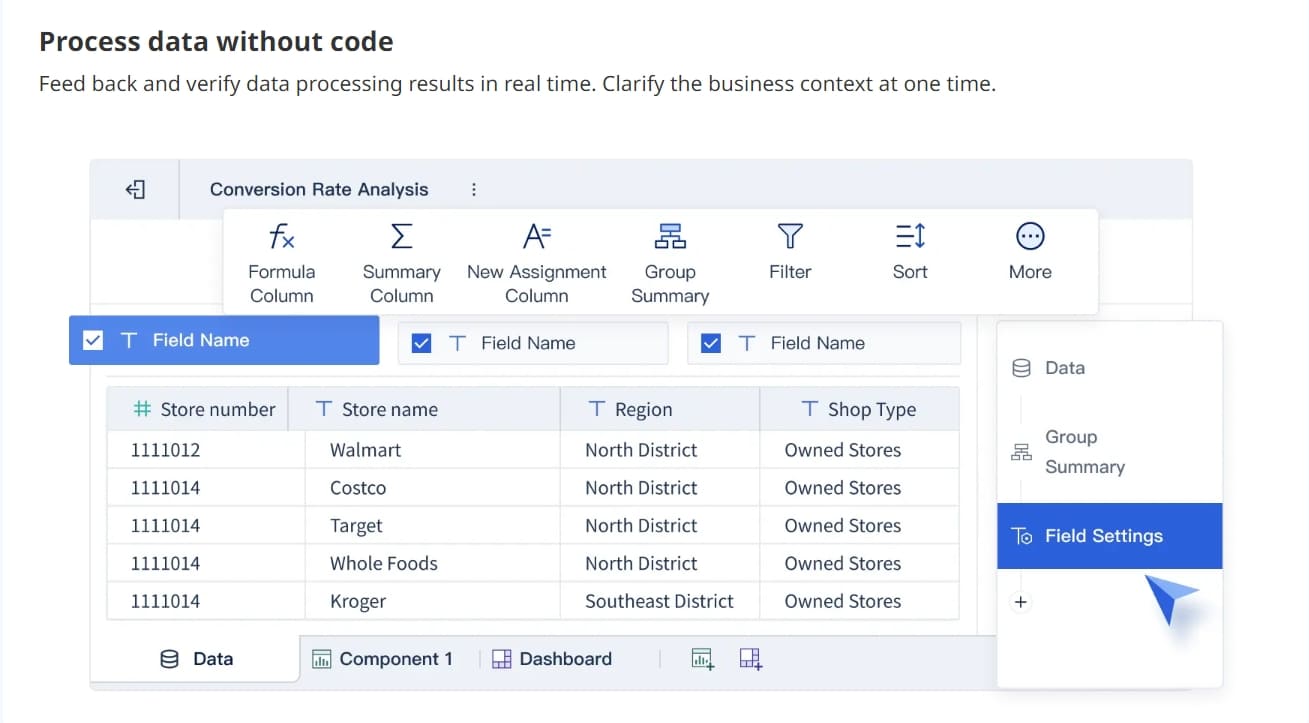
You can create dashboards in FineBI with a simple drag-and-drop interface. This user-friendly approach lets you build your dashboard without writing any code. You start by choosing the data you want to display. Then, you drag fields onto the dashboard canvas. FineBI gives you clear guidance at every step, so you always know what to do next.
You can arrange charts, tables, and other components by moving them around with your mouse. This user-friendly design helps you see your changes in real time. You can adjust the size of each chart or table to fit your needs. If you want to focus on a specific metric, you can highlight it with just a few clicks.
FineBI supports user-friendly customization. You can change colors, fonts, and layouts to match your company’s style. You can also add filters and slicers, which let users explore data from different angles. This makes your dashboards interactive and easy to use for everyone in your organization.
Tip: Use the preview feature to see how your dashboard will look on different devices. This ensures your dashboard stays user-friendly on desktops, tablets, and smartphones.
Add Charts and Visuals
You can add many types of charts and visuals to your dashboards in FineBI. These tools help you turn raw data into clear, actionable insights. When you create dashboards for performance analytics, you want to choose the right visual for each metric.
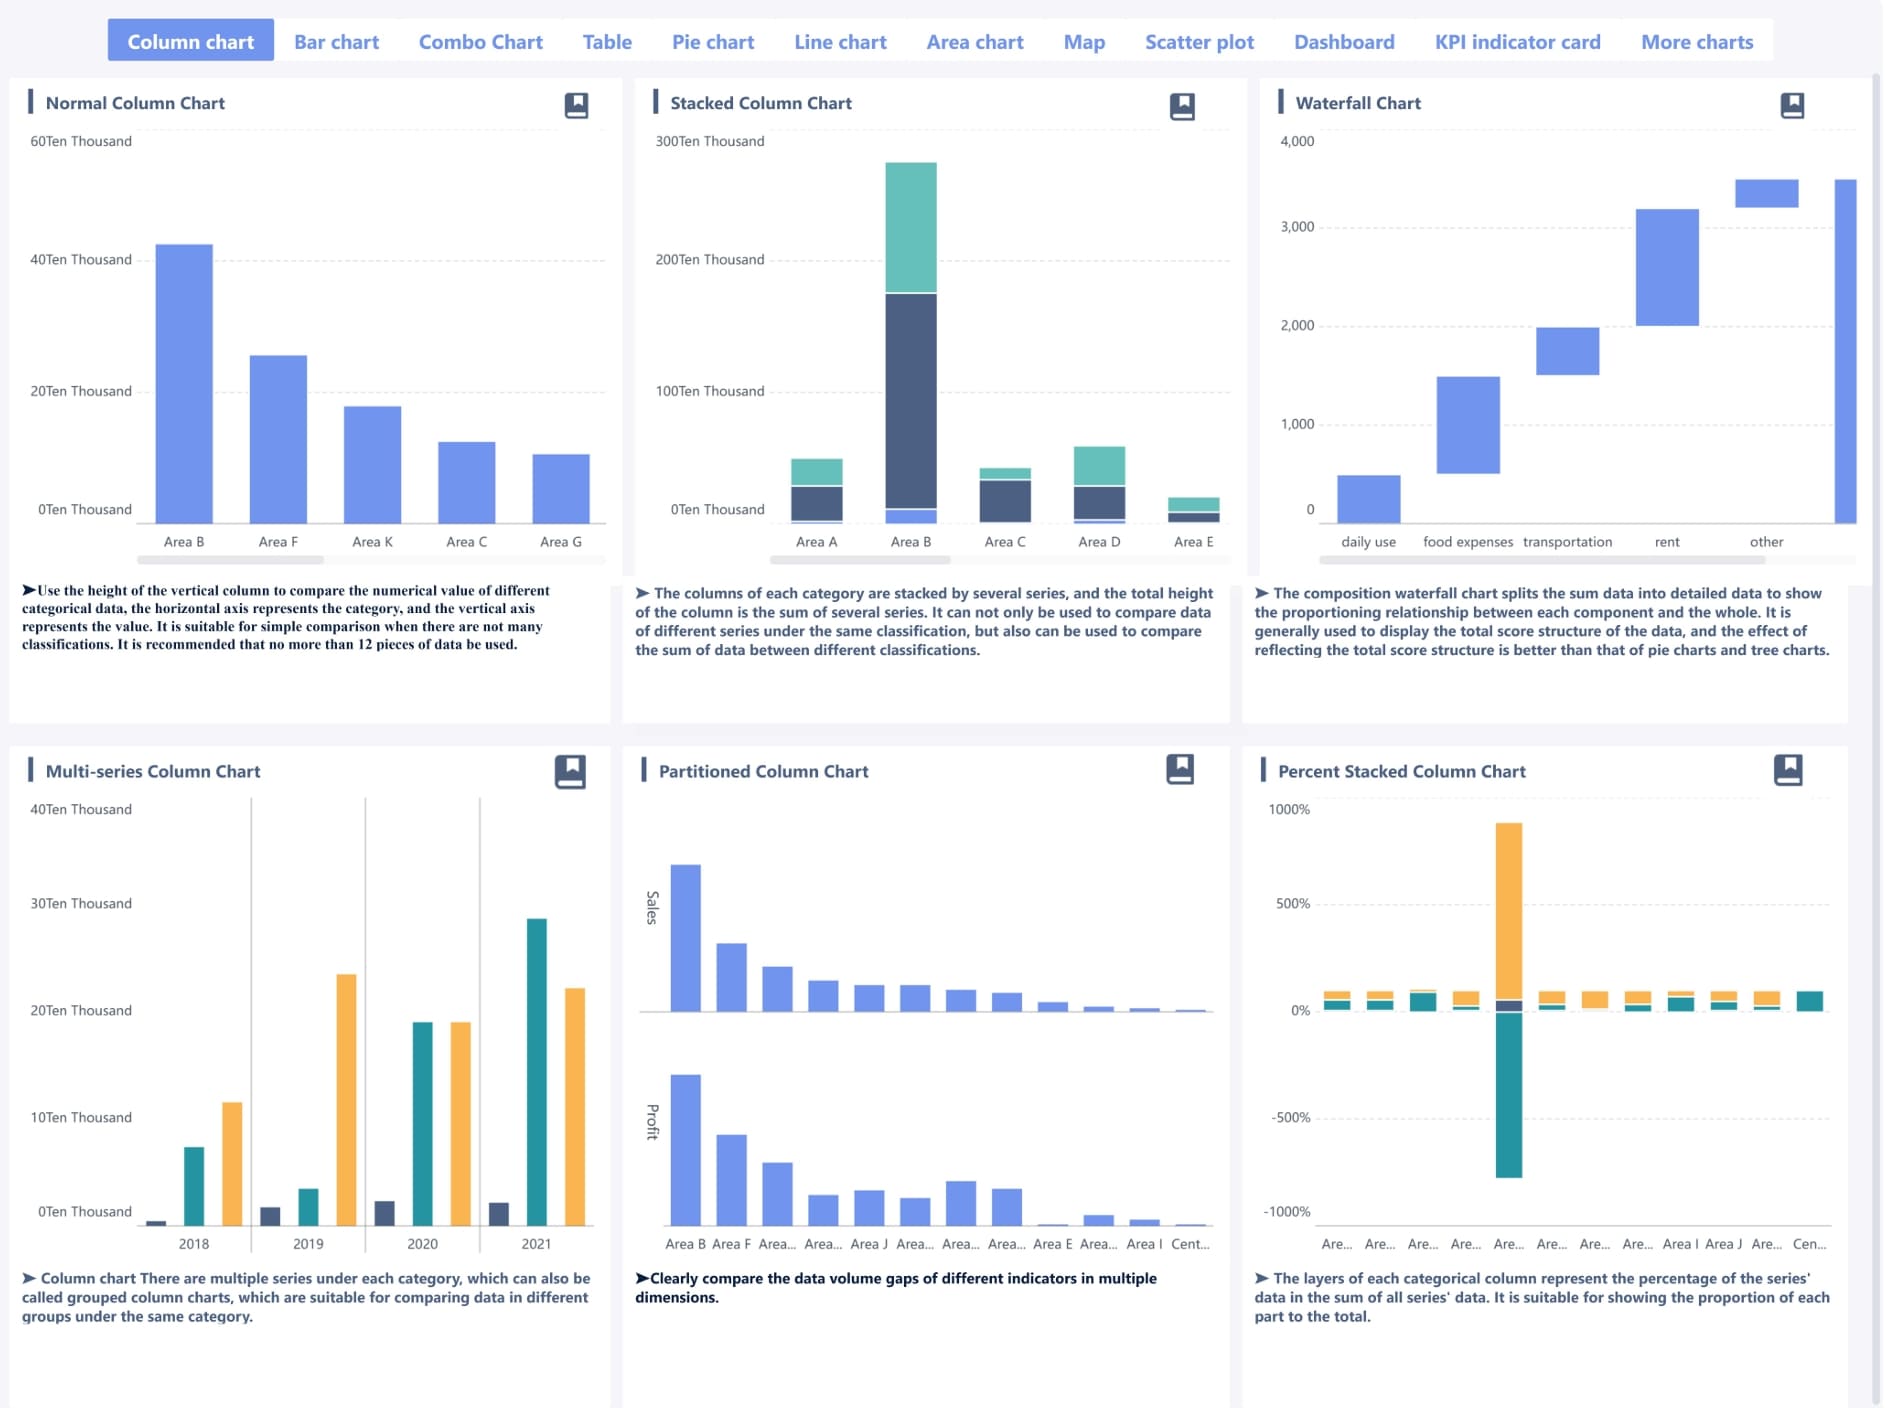
Here are some of the most effective charts and visuals for HR metrics:
Bar graphs and stacked area charts show numerical values over time, such as attendance trends or overtime hours.
Radar charts and stacked bar charts compare values across different departments or teams.
Waterfall charts display data sets with both positive and negative values, which is useful for compensation changes.
Horizontal bar graphs help you compare product categories or geographic locations.
Funnel diagrams illustrate processes like recruitment or onboarding.
Donut charts show parts-to-whole relationships, such as gender or age distribution.
Scatter plots visualize correlations between two variables, like engagement and performance.
Line charts track data that changes daily, such as employee check-ins.
Area charts highlight trends over time, like training completion rates.
Column charts work well for data that resets each period, such as monthly hires.
You can use these visuals to build customizable visualizations that fit your organization’s needs. FineBI makes it easy to switch between chart types, so you can find the best way to display your data. This flexibility supports advanced performance analytics and helps you spot trends quickly.
When you create dashboards, you can combine different visuals on one screen. For example, you might use a bar chart for attendance, a donut chart for diversity, and a line chart for engagement scores. This approach gives you a complete view of your workforce and supports better decision-making.
Note: The right chart makes your hr dashboard more powerful. Choose visuals that match your goals and make your data easy to understand.
You can also add text boxes, images, and web components to your dashboards. These features let you explain key metrics or add company branding. FineBI’s user-friendly tools help you create dashboards that look professional and deliver strong performance analytics.
Building an Employee Performance Dashboard
Select Key Performance Metrics
You need to choose the right metrics before you build an employee performance dashboard. The right metrics help you measure what matters most for your team and your company. You want to track behaviors and results that connect to your business goals. Each metric should be clear, easy to measure, and useful for making decisions. When you select metrics, you make sure your dashboard gives you real value.
Here is a table to help you pick the best metrics for your employee performance dashboard:
Criteria
Description
Specific or Relevant to Strategic Goals
Metrics must monitor specific behaviors related to employee performance and engagement.
Measurable or Meaningful
Performance metrics should be accurately measurable to ensure relevance.
Actionable or Achievable
Data must be actionable, allowing for clear steps to be taken based on the metrics gathered.
Reproducible or Realistic
KPIs should be reproducible and relevant to the current context.
Timely or Comparable
Metrics should allow for comparisons with past performances to assess growth or stagnation.
You can use these criteria to select metrics like goal completion rates, project delivery times, or customer feedback scores. These metrics help you see how your employees perform and where they need support. When you focus on meaningful data, you create a strong foundation for your hr dashboard and your employee development dashboard.
Tip: Review your metrics often. Make sure they still match your company’s needs as your business grows.
Visualize Employee Performance Trends
You can use your employee performance dashboard to turn raw data into clear visuals. These visuals help you spot trends and patterns in employee performance. You can see who meets their goals, who needs more training, and where your team can improve. Visualization makes it easier to share information with your team and your leaders.
Here are some ways you can visualize employee performance trends:
Track schedule adherence to see patterns in tardiness or missed shifts.
Use graphs for labor cost analysis to spot overtime trends.
Compare productivity metrics across shifts or teams to find performance gaps.
Create heat maps for coverage analysis to see if you have too many or too few staff at certain times.
Monitor shift swap metrics to understand employee flexibility.
When you use these visuals, you can quickly find problems before they get bigger. You also make it easier for everyone to talk about performance, because the data is clear and easy to understand. Your employee development dashboard gives everyone access to the same information, which helps your team make better decisions. You build a culture of accountability and growth.
You can also use your dashboard to support employee development. For example, you might track training completion rates or skill improvement over time. This helps you plan for promotions or new roles. Your hr team can use these insights to design better training programs and support employee growth.
Note: Visualizing trends in employee performance helps you improve communication, make smarter decisions, and build a stronger team.
By following these steps, you create an employee performance dashboard that supports both daily management and long-term employee development. You give your team the tools they need to succeed.
Securing Your HR Dashboard
Role-Based Access Control
You need to protect sensitive information when you build a human resource dashboard. Role-based access control helps you decide who can see or change different parts of your dashboard. This system lets you assign roles to each user, so only the right people can view or edit certain data. For example, managers might see team performance, while employees only see their own records. As people change jobs or teams, their access updates automatically. This keeps your hr dashboard secure and reduces the risk of mistakes or leaks. FineBI enables you to grant different permissions to different members to ensure data security.
Here is how role-based access control works in practice:
Role Type
Description
Application Access Roles
Defines which parts of the application a user can access, tailored to specific user personas.
Data Access Roles
Manages visibility down to specific metrics and dimensions, allowing precise control over data.
Contextual Security Rules
Grants access based on a user's role, automatically adjusting as employees change positions.
Tip: Always review user roles regularly to keep your dashboard safe as your team grows.
Testing and Sharing Employee Dashboards
Gather User Feedback
You need to test your human resource dashboard before rolling it out to everyone. Start by collecting feedback from a small group of users. Use analytics tools to track how people interact with the dashboard. Set clear metrics, such as participation rates and engagement scores, to measure success. Regularly monitor feedback trends by reviewing survey results and pulse checks.
Follow these steps to gather meaningful feedback:
Use tools that allow employees to share their thoughts anonymously. This encourages honest responses.
Ask specific questions that relate to your organization’s goals. Clear questions lead to better answers.
Offer multiple ways for users to provide feedback, such as surveys, suggestion boxes, or quick polls.
Act on feedback quickly. When employees see changes, they know their input matters.
Communicate results and show how feedback led to improvements. This closes the feedback loop.
Set benchmarks and compare new feedback to past results to track progress.
Make feedback a regular part of your workplace culture.
Tip: When you foster a feedback culture, your hr dashboard becomes more useful and trusted by your team.
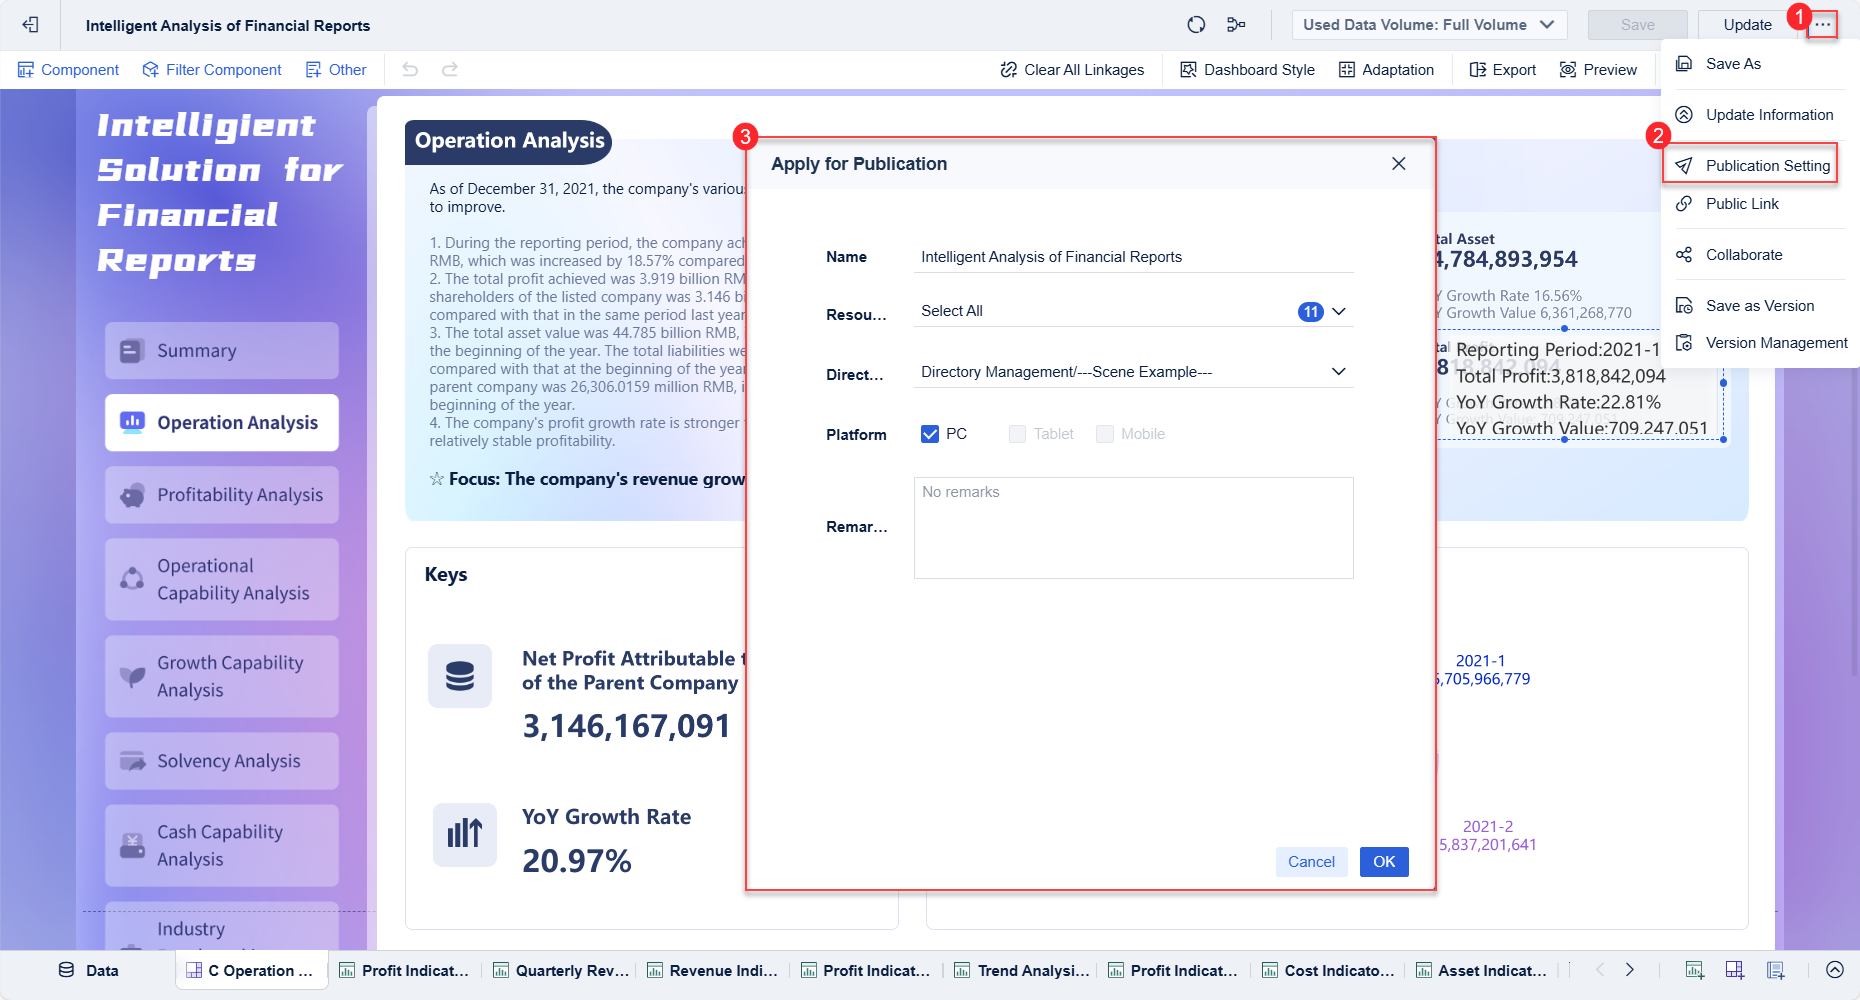
Publish and Collaborate
After testing, you can publish your dashboard for wider use. Share the dashboard with your team and encourage collaboration. Team dashboards open lines of communication and help everyone understand their goals. When you align your team’s focus, you empower individuals to contribute ideas and learn from each other.
Use professional profiles so team members can see each other's skills and responsibilities.
Let the dashboard support event creation and team communication.
Assign clear accountability for dashboard updates and data accuracy.
A collaborative approach helps your hr team work together more effectively. When everyone can access the same information, your organization makes better decisions faster.
Note: Sharing your dashboard and encouraging teamwork leads to a stronger, more connected workplace.
Best Practices for Employee Dashboard Success
Keep Layout Clean and Intuitive
You want your employee dashboard to be easy to use for everyone. A user-friendly interface helps people find what they need quickly. Start by organizing information with a clear visual hierarchy. Place the most important data at the top or in the center, so users see it first. Use consistent navigation and data presentation patterns. This makes your dashboard feel familiar every time someone logs in.
Keep the design simple. Focus on the most essential information and remove anything that distracts from your goals. Cards work well for showing data in a clear and balanced way. They break up information into small, easy-to-read sections. Choose visualizations that make data easy to understand. This helps everyone, even those who are new to analytics, get value from the dashboard.
Tip: A clean layout reduces confusion and supports higher employee satisfaction rates.
Update Dashboards Regularly
You need to keep your hr dashboard up to date. Regular updates make sure your dashboard reflects current business goals and team needs. Review your metrics often. Some data that mattered last year may not be useful now. Ask yourself what decisions you need to support and what your team needs to see each week.
Set up a feedback loop with your team. Use pulse surveys or quick polls to gather opinions on the dashboard’s usefulness. Listen to suggestions and make changes based on what you learn. This process helps you improve employee satisfaction and keeps your dashboard relevant.
A user-friendly interface also means you can adjust and customize your dashboard easily. Dashboard customization lets you create a customizable experience for different users. When you update your dashboard and listen to feedback, you build trust and encourage everyone to use the tool more often.
Note: Continuous improvement leads to better engagement and higher employee satisfaction.
Run pulse surveys to check how employees feel about the dashboard.
Add leaderboards or recognition features to boost morale.
Use gamification to make the experience more enjoyable.
Choose dashboards with built-in marketing functions to support brand advocacy.
Always protect sensitive data with reliable security features.
A user-friendly interface, regular updates, and strong engagement tools help you get the most from your hr dashboard. These best practices support better communication, higher employee satisfaction, and improved employee satisfaction rates.
You may face challenges when your company’s data lives in many different systems. BOE, a global leader in the IoT and semiconductor display industry, had this problem. Data sat in separate departments and systems. This made it hard to get a clear view of business performance. You might see similar issues if your HR team uses spreadsheets, emails, and different software for employee records.
BOE decided to solve this by building a unified data warehouse. The company brought together information from over 200 sources. This step helped everyone use the same definitions for key metrics. You can learn from BOE’s approach. Start by identifying where your data lives. Next, work with your IT team to connect these sources. When you centralize your data, you make it easier to build an accurate hr dashboard.
Note: Centralized data helps you avoid confusion and supports better decision-making.
Achieving Operational Efficiency with FineBI
BOE used FineBI to transform how teams accessed and analyzed data. You can do the same in your organization. FineBI lets you create dashboards that show real-time performance. You can track key indicators, compare results across teams, and spot trends quickly.
BOE saw big improvements after using FineBI. The company reduced inventory costs by 5%. Operational efficiency increased by 50%. You can expect similar results when you use a modern BI tool. FineBI’s drag-and-drop features make it easy for anyone to build reports. You do not need advanced technical skills. Your hr team can monitor employee performance, set goals, and share insights with leaders.
You can use these lessons to improve your own hr dashboard and drive better outcomes for your team.
You can set up an hr dashboard quickly with FineBI and FanRuan. When you use data-driven HR practices, you gain better decision-making, improved employee engagement, and measurable outcomes. You also benefit from personalized experiences and faster responses to challenges. FineBI offers customizable dashboards, real-time analysis, and collaboration tools. You can tailor dashboards to your needs and visualize key metrics. Start building your own dashboard and explore more resources from FanRuan to boost your team’s success.
Access a wealth of case studies, industry insights, and solution guides to accelerate digital transformation.
FAQ
How do you start building an hr dashboard?
You begin by choosing the right BI tool. Connect your HR data sources. Clean and organize your data. Use drag-and-drop features to design your dashboard. Preview and share it with your team.
Can you update your dashboard without IT help?
You can update your dashboard using self-service features. FineBI lets you add new metrics, change visuals, and adjust layouts. You do not need coding skills or IT support.
What data sources can you connect to FineBI?
You can connect databases, cloud warehouses, Excel files, and APIs. FineBI supports over 60 data sources. This flexibility helps you bring all your HR information together.
How do you keep employee data secure?
You set role-based access controls. Only authorized users see sensitive data. FineBI uses strong security protocols. You protect privacy and follow compliance rules.
What if your team needs mobile access?
You optimize your dashboard for mobile devices. FineBI adapts layouts for phones and tablets. Your team can view key metrics and get alerts anywhere.