Comparing Glance Dashboard and FineBI
Explore key differences for enterprise decision-making.
| Features | Glance Dashboard | FineBI |
|---|---|---|
| Analytics Depth | Basic analytics for personal use. | Advanced analytics with AI insights. |
| Collaboration Tools | Limited sharing capabilities. | Robust team collaboration features. |
| Data Integration | Supports basic feeds. | Connects to multiple data sources. |
| Real-Time Reporting | Updates are not instant. | Provides real-time data updates. |
| Customization Options | Highly customizable interface. | Flexible analytics and reporting tools. |
| Scalability | Limited scalability for growth. | Scales with enterprise needs. |
| User Interface | Simple and user-friendly. | Intuitive drag-and-drop interface. |
| Data Governance | Basic access controls. | Comprehensive governance features. |
| Visualization Types | Basic charts and widgets. | 50+ chart types with AI visuals. |
| Self-Service Analytics | Limited self-service capabilities. | Empowers users for independent analysis. |
You need more than a glance dashboard if you want to make smart decisions for your organization. Modern enterprises demand advanced analytics, strong collaboration tools, and unified data governance. While Glance works well for personal use and small teams, you face bigger challenges at the enterprise level. FineBI addresses these needs with features built for large-scale decision making.
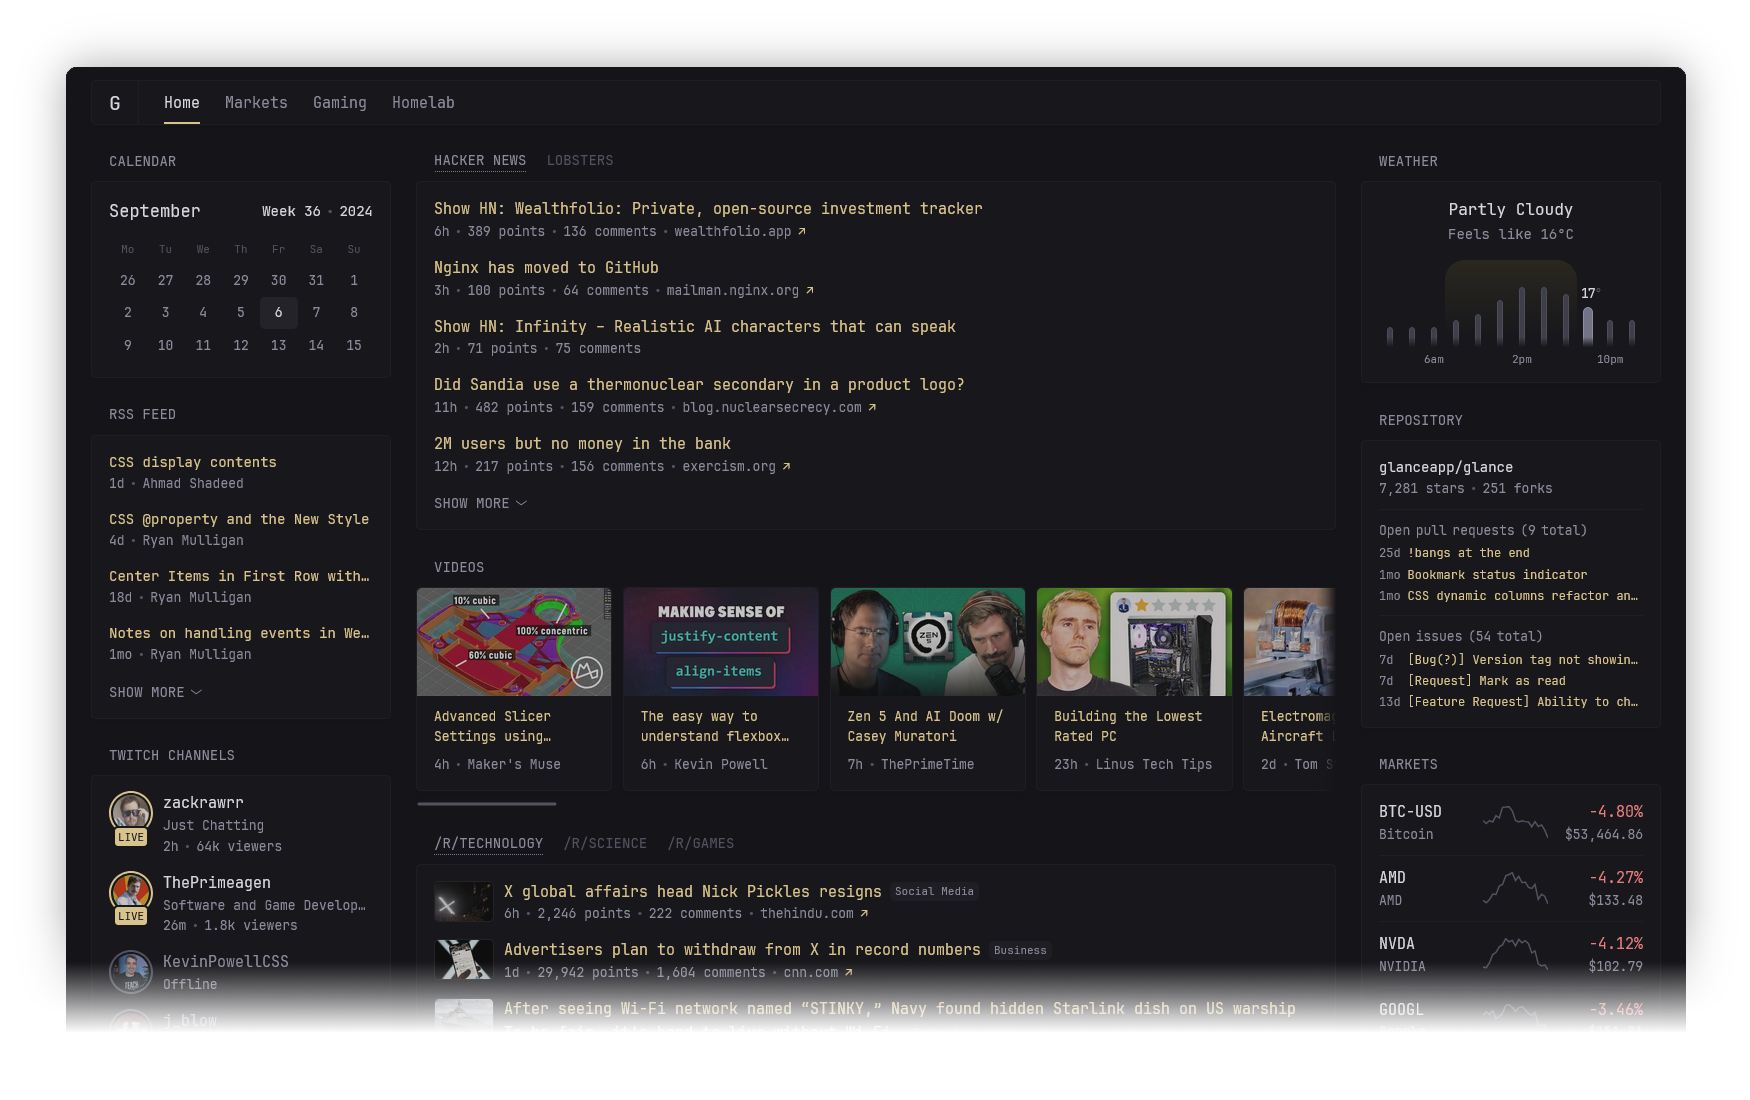
Glance Dashboard Overview
Key Features and Customization
You want a dashboard that is easy to set up and use. The glance dashboard gives you just that. It stands out for its lightweight design and strong customization options. You can access it on your phone or tablet, which makes it convenient for checking your feeds anywhere. You can also change the look and feel with themes, add different widgets, and adjust the layout to fit your needs. Here is a quick look at what you get:
| Feature/Customization Option | Description |
|---|---|
| Mobile-Friendly Design | Works well on phones and tablets for easy access. |
| Easy Setup | Set up in minutes using Docker or manual installation. |
| Customization Options | Choose themes, widgets, and layouts to match your style. |
| Themes | Pick from pre-made themes or create your own. |
| Widgets | Add RSS feeds, YouTube videos, stock tickers, and more. |
| Layout | Change columns and order of dashboard elements. |

Typical Use Cases
You might use the glance dashboard if you want to keep track of news, weather, or social media updates in one place. It works well for tech enthusiasts who want to monitor server stats or market prices. Content creators can use it to follow multiple feeds and channels. Small teams may find it useful for sharing quick updates or tracking project statuses. The glance dashboard helps you stay organized without much effort.
Where Glance Dashboard Falls Short
When your organization grows, you need more than just a quick view of your data. The glance dashboard can become less effective for enterprise needs. Here are some common challenges you may face:
- Designs can become cluttered, making it hard to focus on key information.
- Too much visual data can hide what is important.
- You may not get enough context for your KPIs or data.
- It is hard to dig deeper into data or create drill-down paths.
- Large datasets can slow down performance and make analysis difficult.
- Understanding the full data model can be confusing.
- Testing with different datasets may lead to errors or inconsistencies.
You need advanced analytics, better collaboration, and strong data governance for enterprise decision making. The glance dashboard is best for personal use or small teams, not for complex business needs.
Enterprise Needs and Glance Dashboard Limitations
Data Depth and Analysis
You need more than a quick overview when you manage data for a large organization. The glance dashboard gives you a snapshot of your feeds and metrics, but enterprises require dashboards that dig deeper. You must track operational progress, monitor real-time data, and analyze long-term goals. Enterprises often pull data from many sources, such as management systems and emails. You need dashboards that link data together, not just display it separately. When you use disconnected dashboards, you may miss important connections and slow down decision-making.
- Operational dashboards help you see daily progress and spot problems.
- Strategic dashboards let you focus on long-term goals and key performance indicators.
- Tactical dashboards help you monitor short-term performance.
- Enterprises need dashboards that combine these views and provide context for every metric.
Interactivity and Collaboration
You want your team to work together and explore data easily. The glance dashboard works well for personal use, but it does not support advanced collaboration. Enterprises need tools that let users share insights, comment on reports, and build dashboards together. You must have features that allow multiple users to interact with data at the same time. When teams cannot collaborate, you risk making decisions based on incomplete information.
Tip: Choose BI solutions that support real-time sharing and feedback. This helps your team stay aligned and make faster decisions.
Scalability and Governance
You face new challenges as your organization grows. The glance dashboard is lightweight, but it may not scale to handle large datasets or complex business rules. Enterprises need dashboards that grow with their data and users. You must build a governance framework that protects data quality and supports compliance. Good governance helps you define clear rules for data access and use. If you overcomplicate governance, you may slow down adoption. If you ignore governance, you risk errors and security issues.
- Start with your most critical data domains.
- Establish simple governance processes.
- Scale your framework as your needs change.
- Tie governance goals to measurable KPIs.
- Balance governance with innovation to avoid blocking progress.
Customization vs. BI Flexibility
You can customize the glance dashboard to fit your style and needs. You may change themes, layouts, and widgets. Enterprises, however, need more than visual customization. You must have flexibility to integrate data from many sources, automate reporting, and define unified metrics. Advanced BI solutions offer tailored analytics, deeper insights, and tools for both casual and power users.
| Key Factor | Description |
|---|---|
| Improved Data Integration | Connects data from different systems for better quality and accessibility. |
| Scalability | Adapts to growing data and user needs. |
| Customization | Meets specific business requirements and user preferences. |
| Advanced Features | Provides tools for deeper analysis and informed decisions. |
| User Adoption | Ensures the platform is easy for everyone to use. |
You need a solution that goes beyond simple customization. Enterprises require BI platforms that support complex analysis, unified metrics, and seamless collaboration. The glance dashboard serves well for individuals and small teams, but it does not meet the demands of enterprise decision-making.
FineBI for Enterprise Analytics
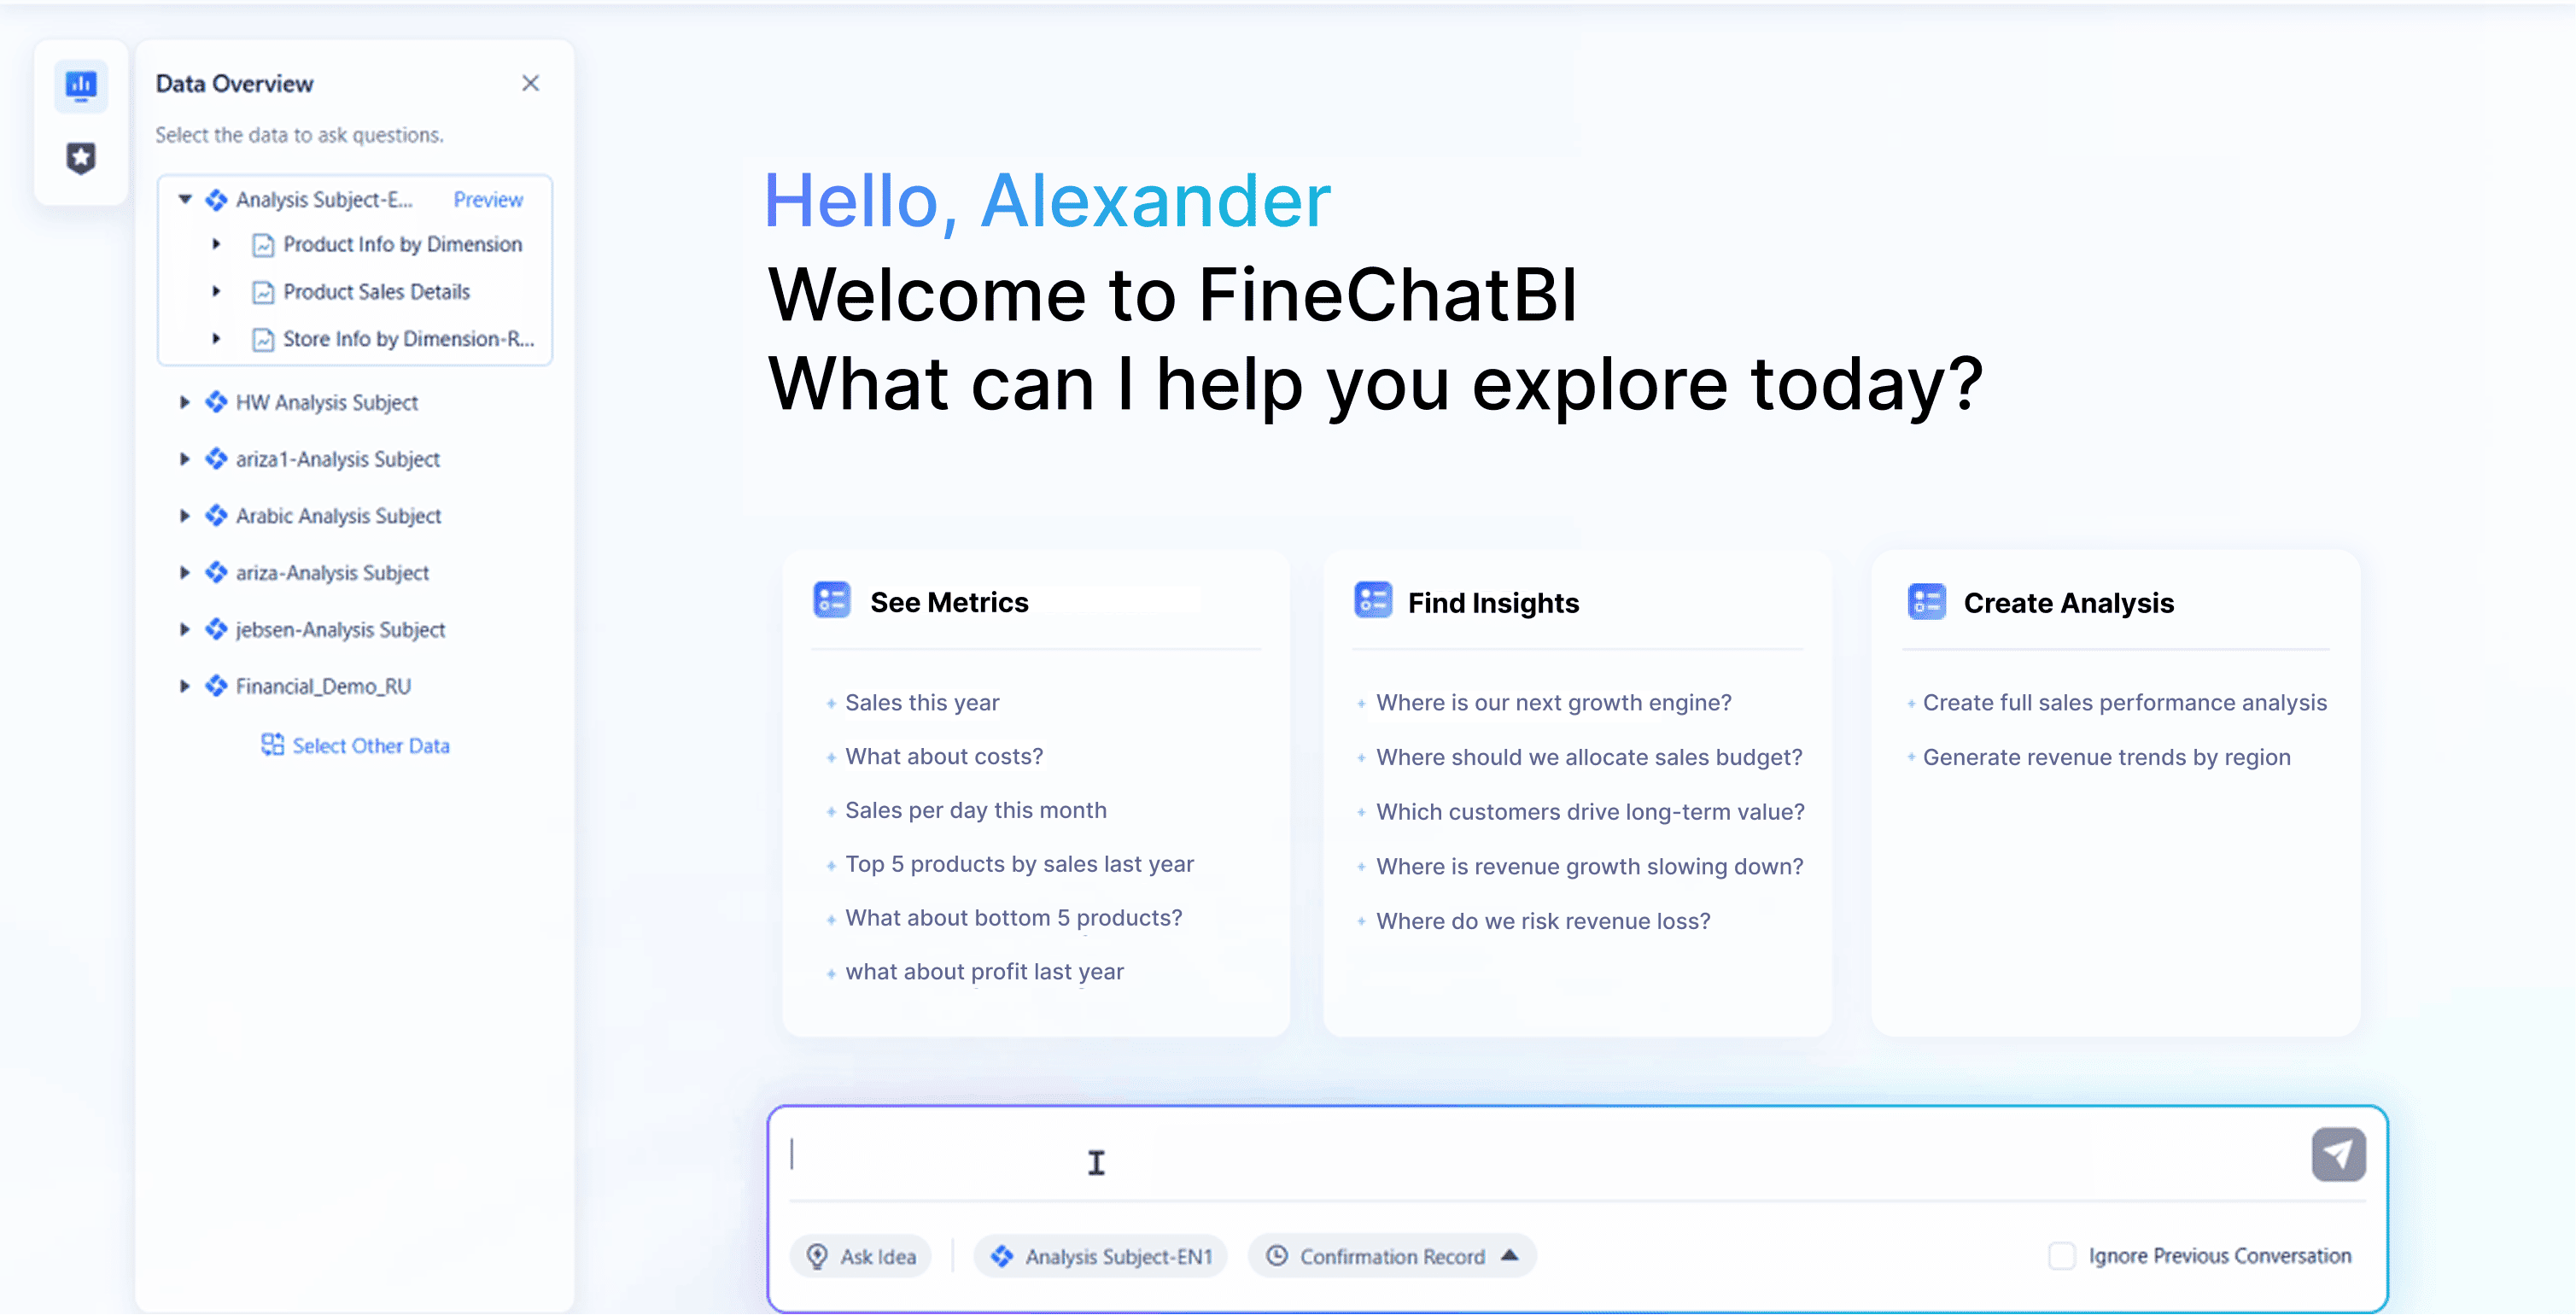
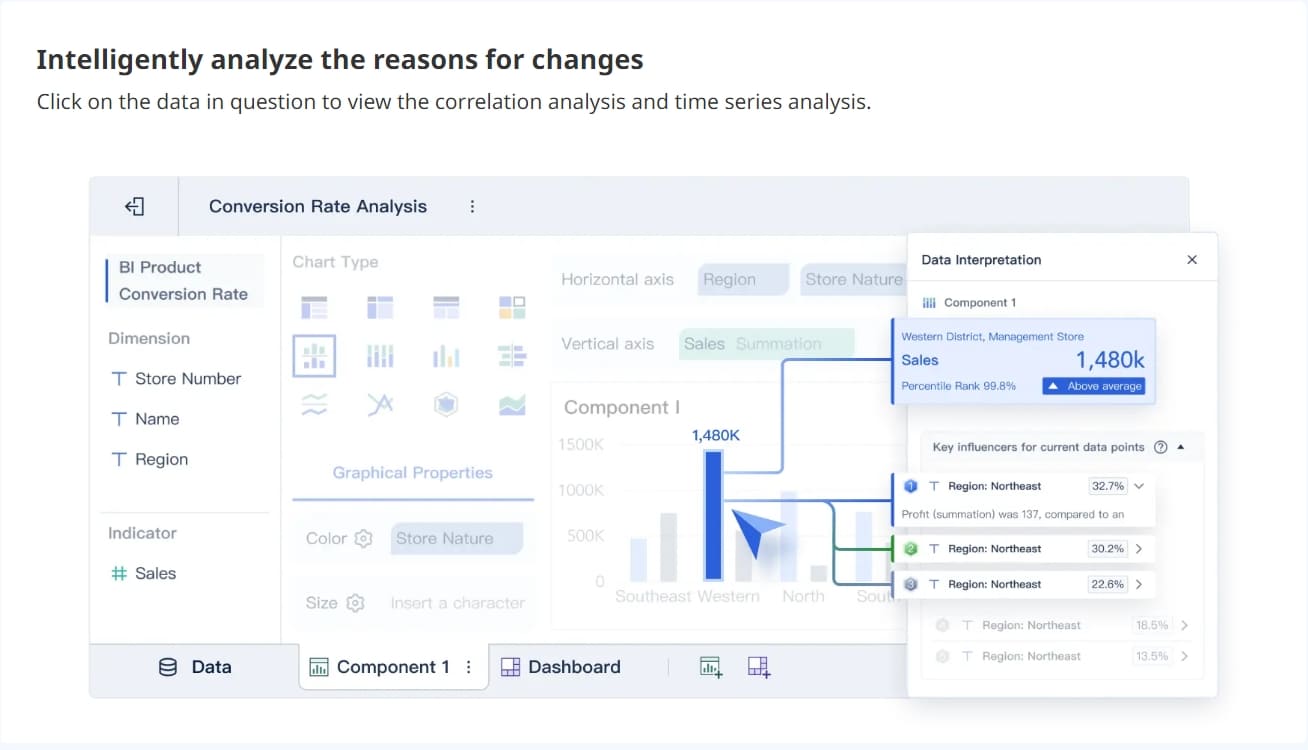
AI-Driven Insights
You need more than basic charts to make smart decisions. FineBI gives you advanced AI-driven analytics that help you find patterns and predict future trends. You can use interactive dashboards to visualize your data and spot important changes. The drag-and-drop interface lets you build reports without technical skills. FineBI updates your data in real time, so you always see the latest numbers. You get predictive analytics that help you plan ahead and avoid surprises.
| Feature | Description |
|---|---|
| Data Visualization | Create interactive dashboards and visual reports easily. |
| Predictive Analytics | Use AI to forecast trends and future performance. |
| User-Friendly Interface | Build visualizations with simple drag-and-drop tools. |
| Real-Time Data Updates | See instant insights with continuous data refreshes. |
| Self-Service Analytics | Explore data independently, no IT support needed. |
| Role-Based Access Control | Share data securely based on user roles. |
| Scalability | Handle large datasets and complex KPIs with ease. |
Self-Service and Data Integration
You want your team to analyze data without waiting for IT help. FineBI lets you create your own datasets and explore data on your own. You can model relationships between data points and find answers quickly. The platform connects with over 30 big data sources and SQL databases, making it easy to access all your information. You can prepare, edit, and visualize data with minimal training.
- You can analyze and understand data independently.
- You perform data analysis with low learning costs.
- You prepare, edit, and visualize data easily.
- FineBI supports connections to many data platforms, so you never miss important information.

Collaboration and Data Governance
You need your team to work together and trust the data. FineBI makes collaboration simple. You can share insights, comment on reports, and build dashboards as a group. The platform uses role-based access control to keep data secure. You can define clear rules for data access and use, which helps you meet compliance goals. FineBI’s governance tools unify metrics and definitions, so everyone uses the same numbers.

Tip: Use FineBI’s collaboration features to break down silos and improve teamwork across departments.

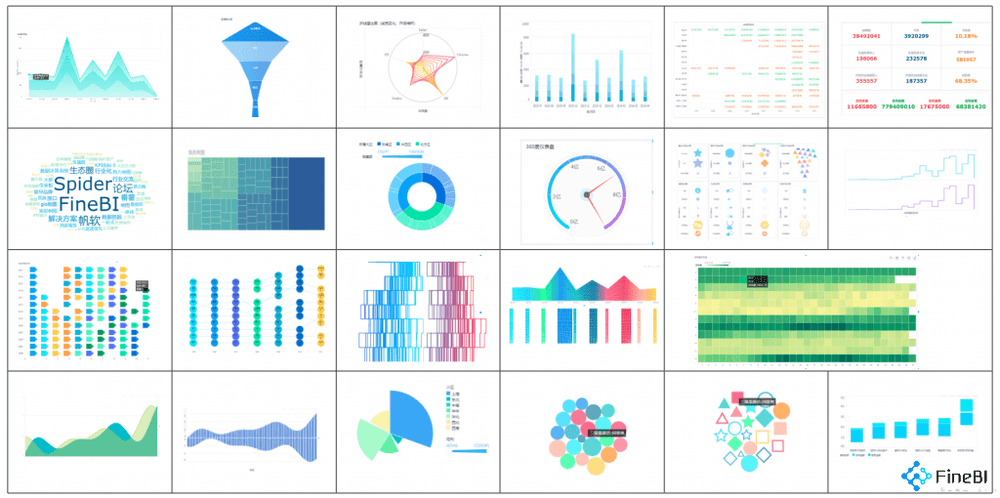
Real-Time Reporting
You need answers fast when making decisions. FineBI supports real-time reporting with a powerful computing engine. You can connect to multiple data sources, including databases, Excel files, and APIs. The platform offers over 50 chart types for flexible visualization. You detect anomalies during meetings and respond quickly. FineBI helps you make data-driven decisions with up-to-date information.
- You spot problems as they happen.
- You support decisions with real-time updates.
- You improve collaboration and efficiency across your organization.
Glance Dashboard vs FineBI Comparison
Data Analysis and Visualization
You want to see your data clearly and make sense of it fast. The glance dashboard gives you simple visualizations for your feeds and widgets. FineBI takes this further with AI-powered analysis, auto-generated dashboards, and advanced chart types. You can ask questions in plain language and get instant visual answers. Industry analysts note that FineBI’s dashboards help you spot trends and patterns that might stay hidden in a glance dashboard.
| Feature | Glance Dashboard | FineBI |
|---|---|---|
| Visualization Types | Basic charts and widgets | 50+ chart types, AI-driven visualizations |
| Dashboard Creation | Manual setup | Auto-generate dashboards from user queries |
| Data Insights | Limited to what you configure | AI recommends insights and uncovers opportunities |
User Interactivity
You interact with the glance dashboard by adding widgets and changing layouts. FineBI lets you explore data with drag-and-drop tools, filter results, and drill down into details. You can use ChatBI, an AI assistant, to generate reports quickly. This makes it easier for you to find answers and share them with your team.
Scalability for Growth
As your organization grows, you need a platform that keeps up. The glance dashboard works well for small teams and personal use. FineBI supports elastic cloud deployment, so you can start small and expand as your needs change. You get fast response times, even with large datasets, thanks to FineBI’s in-memory computing engine. Real-time analytics and integrated ETL tools help you manage more data without slowing down.
- FineBI scales with your business.
- You handle large data volumes easily.
- Real-time analytics support fast decisions.
Collaboration Features
You want your team to work together on data projects. The glance dashboard focuses on individual use. FineBI makes collaboration simple. You can share dashboards, comment on reports, and build insights as a group. Teams save time by automating reports and sharing results instantly.
“Implementing FineBI significantly streamlined our BI workflows — teams stopped spending time on manual data preparation and finally focused on real analytics and business value.”
Security and Governance
You need to trust your data and keep it safe. The glance dashboard offers basic controls. FineBI provides role-based access, a unified Metrics Hub, and a Data Catalog for governed assets. You define who sees what, and everyone uses the same metrics. This keeps your data secure and your decisions consistent.

Real-World Scenarios
Multi-Department Reporting
You manage data for several departments. Each team needs reports with different metrics and formats. The glance dashboard helps you track simple feeds and updates. You can set up widgets for each department, but you may struggle to unify data or create cross-team reports.
FineBI gives you a better way to handle multi-department reporting. You connect data from sales, finance, HR, and operations. You build dashboards that show unified metrics. You use the Metrics Hub to keep definitions consistent. Your teams see the same numbers and trust the results.
| Feature | Glance Dashboard | FineBI |
|---|---|---|
| Department Feeds | Separate widgets | Unified cross-team reports |
| Metric Consistency | Manual setup | Centralized Metrics Hub |
| Data Integration | Limited sources | Multiple databases, APIs |
Note: You save time and reduce errors when you use a platform that supports unified reporting.
Real-Time Decision Making
You want to make decisions quickly. The glance dashboard shows you the latest updates from your feeds. You see news, weather, or server stats in real time. For enterprise decisions, you need more than updates. You need analytics that refresh instantly and support fast action.
FineBI gives you real-time reporting with advanced analytics. You spot trends and anomalies as they happen. You use AI-driven insights to predict outcomes. You respond to changes in sales, inventory, or customer behavior without delay.
- FineBI updates dashboards instantly.
- You get alerts for critical changes.
- You make decisions with confidence.
Collaborative Data Exploration
You work with a team that needs to explore data together. The glance dashboard lets you share your dashboard, but collaboration stays basic. You cannot comment or build reports as a group.
FineBI supports true teamwork. You share dashboards, add comments, and build insights together. You use role-based access to keep data secure. Your team explores data, finds answers, and makes decisions as one.
Tip: Choose a BI platform that encourages collaboration. You improve results when everyone works together. 🚀
You see that a glance dashboard gives you quick access and easy customization, but it cannot support enterprise decision making. FineBI fills these gaps with advanced analytics, strong collaboration, and unified governance. When you move to FineBI, you may face challenges like low user adoption, data integration issues, data quality concerns, and data silos. You should review your BI needs and choose a platform that helps your organization grow and make smarter decisions.
Continue Reading About dashboard
What is a Digital Dashboard and How Does It Work
What is a KPI Dashboard and Why Your Business Needs One
How to Craft an Effective Analytics Dashboard


FAQ

The Author
Lewis
Senior Data Analyst at FanRuan
Related Articles

How to Build an Investment Portfolio Reporting Dashboard for Executives: KPIs, Benchmarks, and Drill-Down Views
Investment portfolio reporting for executives is not about showing every holding, transaction, and chart your investment team can produce. It is about giving CEOs, CFOs, CIOs, boards, and investment committees a fast, re
Yida YIn
Jun 25, 2026

12 KPI Reporting Examples for Executive Dashboards: What to Show in Weekly, Monthly, and Quarterly Reviews
Executive leaders do not need more data. They need decision ready $1 examples that match how often they review the business and what actions they are expected to take. A weekly $1 should surface fast moving risks and per
Yida YIn
Jun 25, 2026

How to Build a Digital Marketing Reports Dashboard: Executive Examples, KPIs, and Templates
A $1 is the control layer that helps executives and marketing leaders turn scattered channel data into fast, confident decisions. If you are a CEO, CMO, operations director, or marketing analytics lead, the real problem
Yida Yin
May 07, 2026