A recruiting metrics dashboard should help global talent leaders answer one simple question: Are we hiring well across the business, without losing local execution detail? In practice, that is where many dashboards fail.
Multi-region recruiting adds real complexity. Each market has different labor conditions, compliance constraints, recruiter workflows, interview practices, and ATS usage habits. If you force all regions into one rigid process, adoption drops. If you let every region define metrics its own way, enterprise reporting becomes unreliable.
The solution is not more charts. It is better metric architecture.
This guide explains how to design a recruiting metrics dashboard that gives executives a trusted global view while still serving regional teams and recruiters who need operational clarity every day.
Why a recruiting metrics dashboard breaks down across regions
A global recruiting organization usually has two competing needs:
Local hiring teams need dashboards that reflect how work actually happens in their market
Enterprise leaders need comparable reporting across regions, business units, and time periods
Those needs are both valid. The breakdown happens when companies try to satisfy both with a single flat dashboard model.
In one region, a recruiter may move candidates from “HR Screen” to “Panel Interview.” In another, the same step may be recorded as “Talent Review” and “Assessment.” A regional team may need that detail to manage throughput. But global leadership does not need six versions of the same funnel stage. They need consistency.
The most common failure points are predictable:
Inconsistent stage definitions across ATS instances or countries
Duplicated metrics with slightly different formulas
Fragmented data sources spanning ATS, HRIS, spreadsheets, CRM tools, and local trackers
Regional exceptions that are never documented
Dashboard sprawl where every stakeholder requests a custom view with custom logic
When this happens, leaders lose trust in the numbers. Meetings shift from decisions to debates: What counts as time to fill? Does internal mobility sit in the same funnel? Why does one region show a higher conversion rate only because they collapsed stages differently?
What leaders actually need from one global view is narrower than many teams assume. They need:
Enterprise hiring progress
Regional variance
hiring risk signals
trend movement over time
confidence that metrics are comparable
Regional teams, by contrast, need:
recruiter workload
aging reqs
stage bottlenecks
source performance by local market
SLA adherence
actionable candidate movement
These are not the same use cases. A strong recruiting metrics dashboard respects that difference.
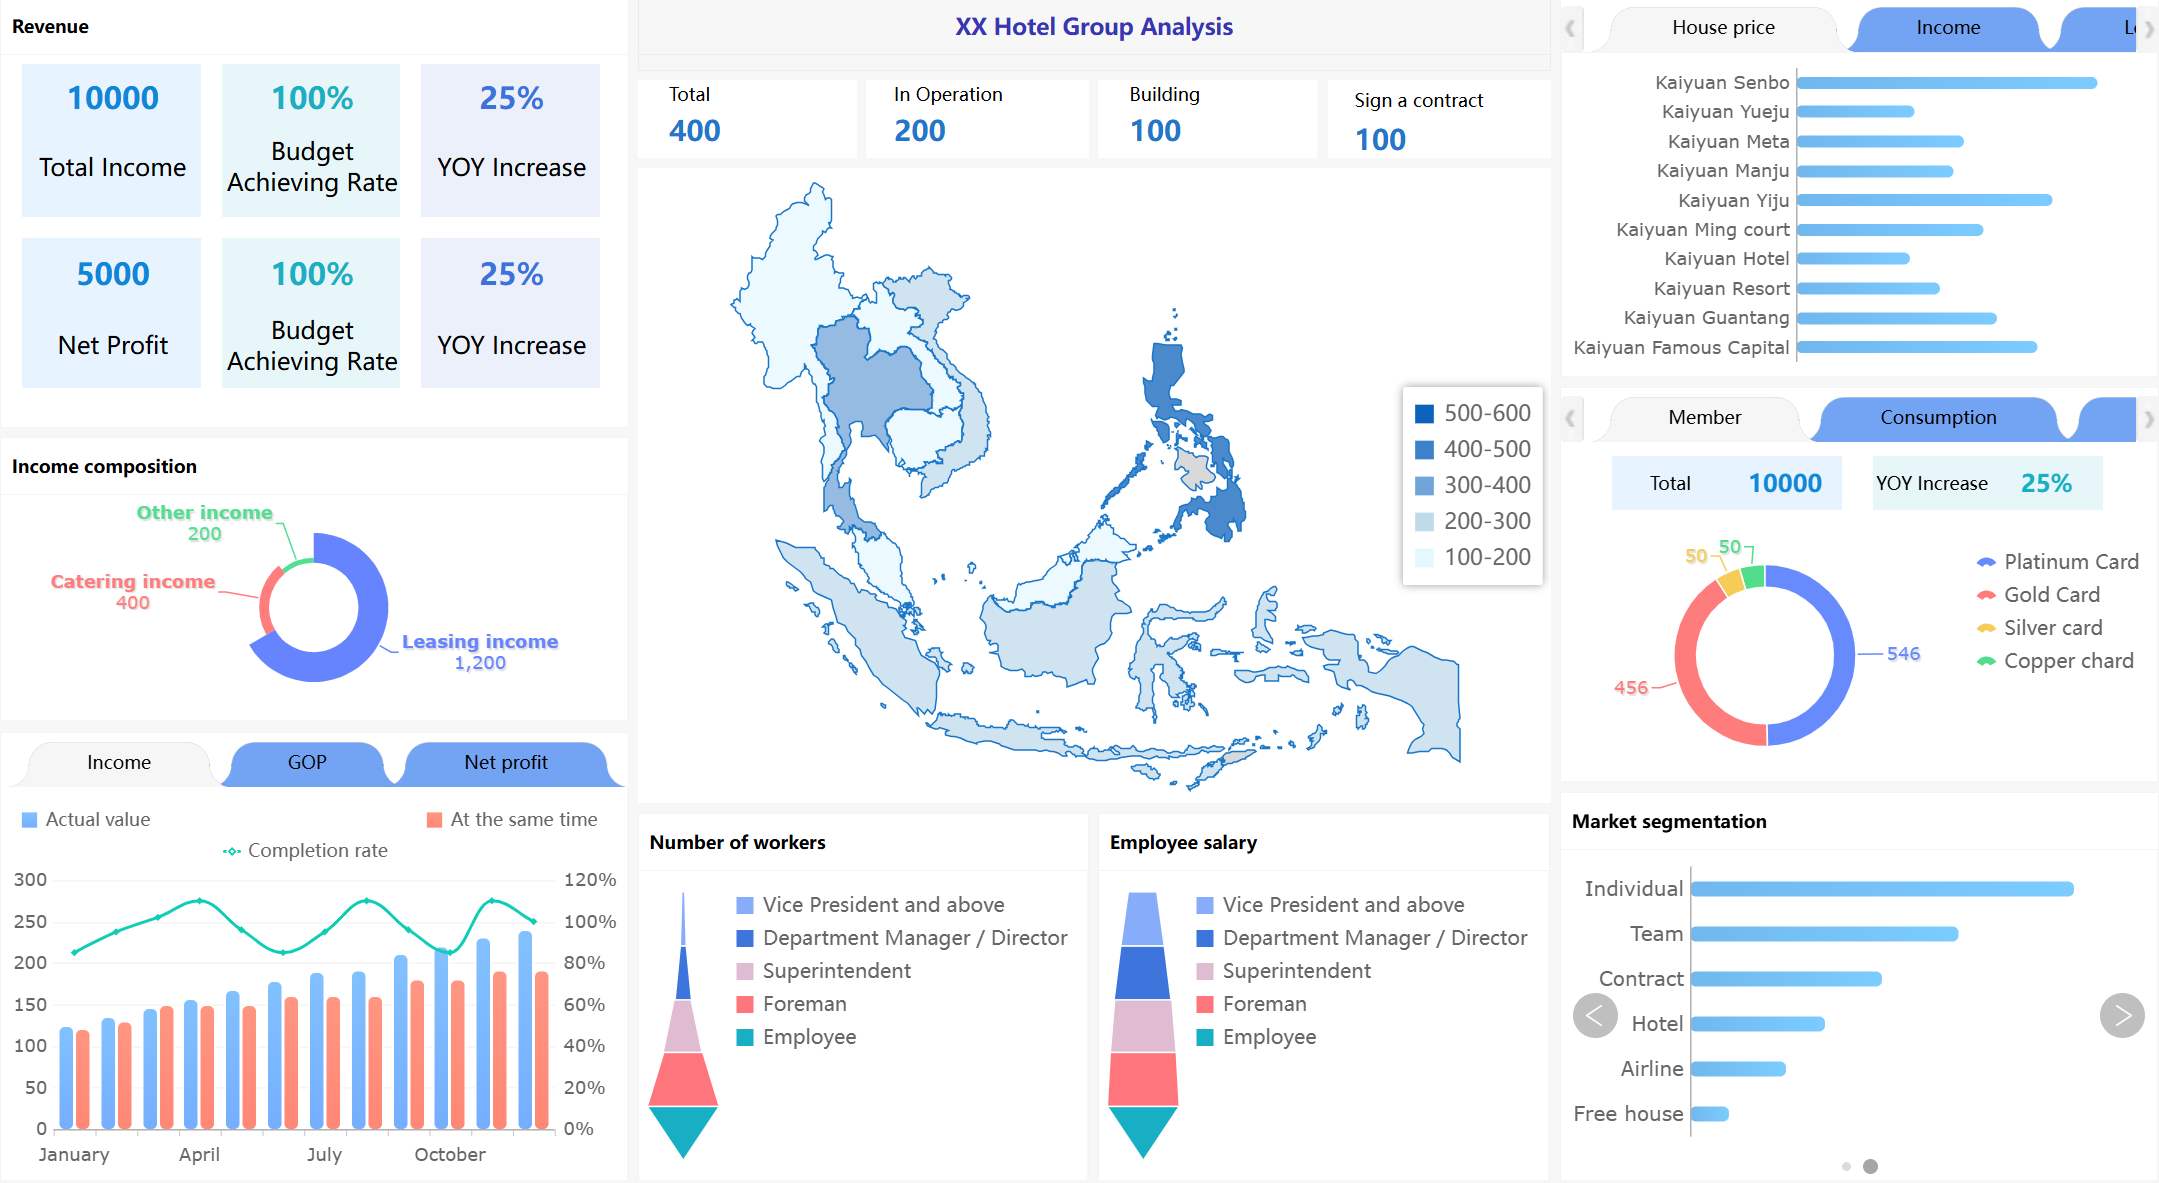
All dashboard examples in this article created by FineBI.
Core principles for a recruiting metrics dashboard that works in multi-region enterprises
A scalable dashboard starts with governance, not visualization. Before anyone chooses chart types or color palettes, the organization needs agreement on what is globally fixed and what can remain regionally flexible.
Four principles matter most:
Principle
What it means
Why it matters
Global metric layer
One standardized logic set for enterprise KPIs
Preserves comparability
Regional process flexibility
Local teams can run different workflows
Improves adoption and usability
Data standards
Common naming, ownership, and refresh cadence
Reduces reporting disputes
Roll-up rules
Clear criteria for what rolls up globally
Prevents noisy or misleading summaries
A good operating model keeps the executive reporting logic stable even when local process steps differ. That means the company defines a global metric layer first, then maps local recruiting workflows into it.
This also requires discipline around:
naming conventions
field definitions
ownership by metric and by source system
data refresh cadence
exception handling rules
If these controls are missing at launch, dashboard trust erodes quickly and becomes expensive to rebuild.
Separate global KPIs from local operating metrics
The biggest design mistake is trying to make every metric universal.
Some measures must stay globally comparable. These usually include:
These are enterprise KPIs because leaders use them to allocate budgets, assess capacity, and identify underperformance across regions.
At the same time, regions should be free to track workflow-specific steps that reflect local reality. For example:
visa review stage completion
local agency handoff status
market-specific approval timing
location-specific interview scheduling delays
local compliance documentation checkpoints
These can be valuable operational metrics without being forced into executive roll-up logic.
The rule is straightforward: If a metric supports cross-region comparison, define it globally. If it supports local execution only, let it remain local unless governance decides otherwise.
Build metric definitions before building visualizations
Many dashboard projects fail because they begin in the BI layer instead of the metric definition layer.
Before building visualizations, create a shared metric dictionary that includes:
metric name
business purpose
formula
numerator and denominator
included and excluded populations
system of record
refresh frequency
owner
escalation path for disputes
This is especially important in recruiting, where stage logic often varies by team. Without definitions, people interpret the same label differently. One region may start time to fill when the requisition is approved; another when it is posted. One team may count accepted offers as hires; another waits until the start date.
That difference can destroy comparability.
A metric dictionary does more than standardize formulas. It reduces political friction. When executives question a number, the dashboard team can point back to agreed logic instead of rebuilding reports ad hoc.
What to track and why in a global recruiting metrics dashboard
The best recruiting metrics dashboard is not the one with the most metrics. It is the one that supports decisions at three levels:
Executives need business visibility
Regional leaders need comparative performance insight
Recruiters and TA managers need action-oriented workflow signals
To do that well, the dashboard should balance four measurement categories:
Speed
Quality
Cost
Diversity-related reporting, where governance and data maturity allow
Essential executive metrics
Executive dashboards should remain concise. They are for decision-making, not process inspection.
The core metrics usually include:
Hiring volume by region, business unit, and role type
Time in stage rolled into shared funnel categories
Offer acceptance rate
Pipeline conversion rate
Forecasted hiring risk
Open demand versus hiring target
A practical executive view should answer:
Are we on track against hiring plan?
Which regions or functions are underperforming?
Where is forecast risk increasing?
Are delays driven by volume, process, or market constraints?
For this audience, trend lines and exception flags often work better than dense operational tables.
Regional performance and process health metrics
Regional leaders need a more operational lens. They are managing execution within a market, not just reviewing outcomes.
Useful regional metrics include:
Recruiter workload
Aging requisitions
Interview throughput
Bottleneck stages
Source performance by market
SLA adherence by location
Regional funnel drop-off patterns
Hiring manager responsiveness
These metrics help regional TA leaders identify where performance issues are structural versus situational. For example, slow interview progression may reflect interviewer capacity, not recruiter productivity. High source volume with weak conversion may point to channel quality or job-market mismatch.
A regional dashboard should also provide enough context to explain legitimate market differences. A region hiring niche technical roles in a constrained labor market should not appear “worse” simply because conditions differ. Comparative reporting needs normalization, commentary, or at minimum visible segmentation.
Data quality and reporting confidence metrics
In a multi-region setting, data quality is not a back-office issue. It is part of the dashboard itself.
If one region updates ATS stages consistently and another does not, side-by-side comparisons become misleading. That is why a mature recruiting metrics dashboard includes reporting confidence indicators such as:
Completeness of stage updates
Missing critical fields
System sync failures
Duplicate candidate or requisition records
Unmapped local stages
Coverage by region for roll-up eligibility
These metrics answer a crucial question: Can this region be fairly compared in the global summary?
A smart approach is to add a simple coverage layer:
This preserves trust. It is better to surface limitations explicitly than to imply false precision.
Design the recruiting metrics dashboard architecture for consistency without rigidity
To support both local nuance and enterprise reporting, the dashboard architecture should follow a layered model.
This model separates data collection from business logic and business logic from presentation. That separation is what allows consistency without forcing every region into one process design.
The recommended layers are:
Source systems
ATS, CRM, HRIS, assessment tools, spreadsheets, local trackers
Metric logic layer
Standard definitions, exclusions, mappings, and roll-up rules
Regional and role-based views
Dashboards for regional leaders, recruiters, and TA operations
Executive roll-up
A concise summary built only from governed metrics and eligible data
This is also where a canonical funnel framework becomes essential. Instead of forcing all markets to use identical stage labels, map local stages into shared reporting buckets.
Map local workflows into a common reporting taxonomy
A strong recruiting metrics dashboard uses a universal reporting taxonomy such as:
Applied
Screened
Interviewed
Offered
Hired
Each region can then map local stage names into these buckets.
For example:
Local Stage
Region
Global Funnel Bucket
CV Review
UK
Screened
TA Qualification
APAC
Screened
Hiring Panel
US
Interviewed
Assessment Center
EMEA
Interviewed
Verbal Offer
LATAM
Offered
This approach creates stability in summary reporting while preserving local workflow detail in drill-down views.
The key advantage is that you do not lose operational nuance. Recruiters can still view exact local stages. Executives only see standardized funnel movement.
Documenting exceptions matters here. If one region uses a legally required screening step that lengthens early-stage cycle time, that should be visible in notes, filters, or drill-down context rather than hidden inside distorted averages.
Set permissions and views for different audiences
Not every user should see every metric.
In fact, one of the easiest ways to reduce confusion is to restrict each audience to the measures they can influence.
A simple audience model works well:
Audience
Primary needs
Dashboard style
Executives
Progress, variance, risk
Summary scorecards and trends
Regional leaders
Comparative performance, bottlenecks
Operational analytics
Recruiters
Action queue, stalled candidates, overdue tasks
Detailed workflow view
TA operations
Data quality, system health, governance
Admin and validation panels
This permission model improves clarity and avoids a common trap: executives getting buried in recruiter-level activity metrics, or recruiters getting distracted by metrics they cannot directly control.
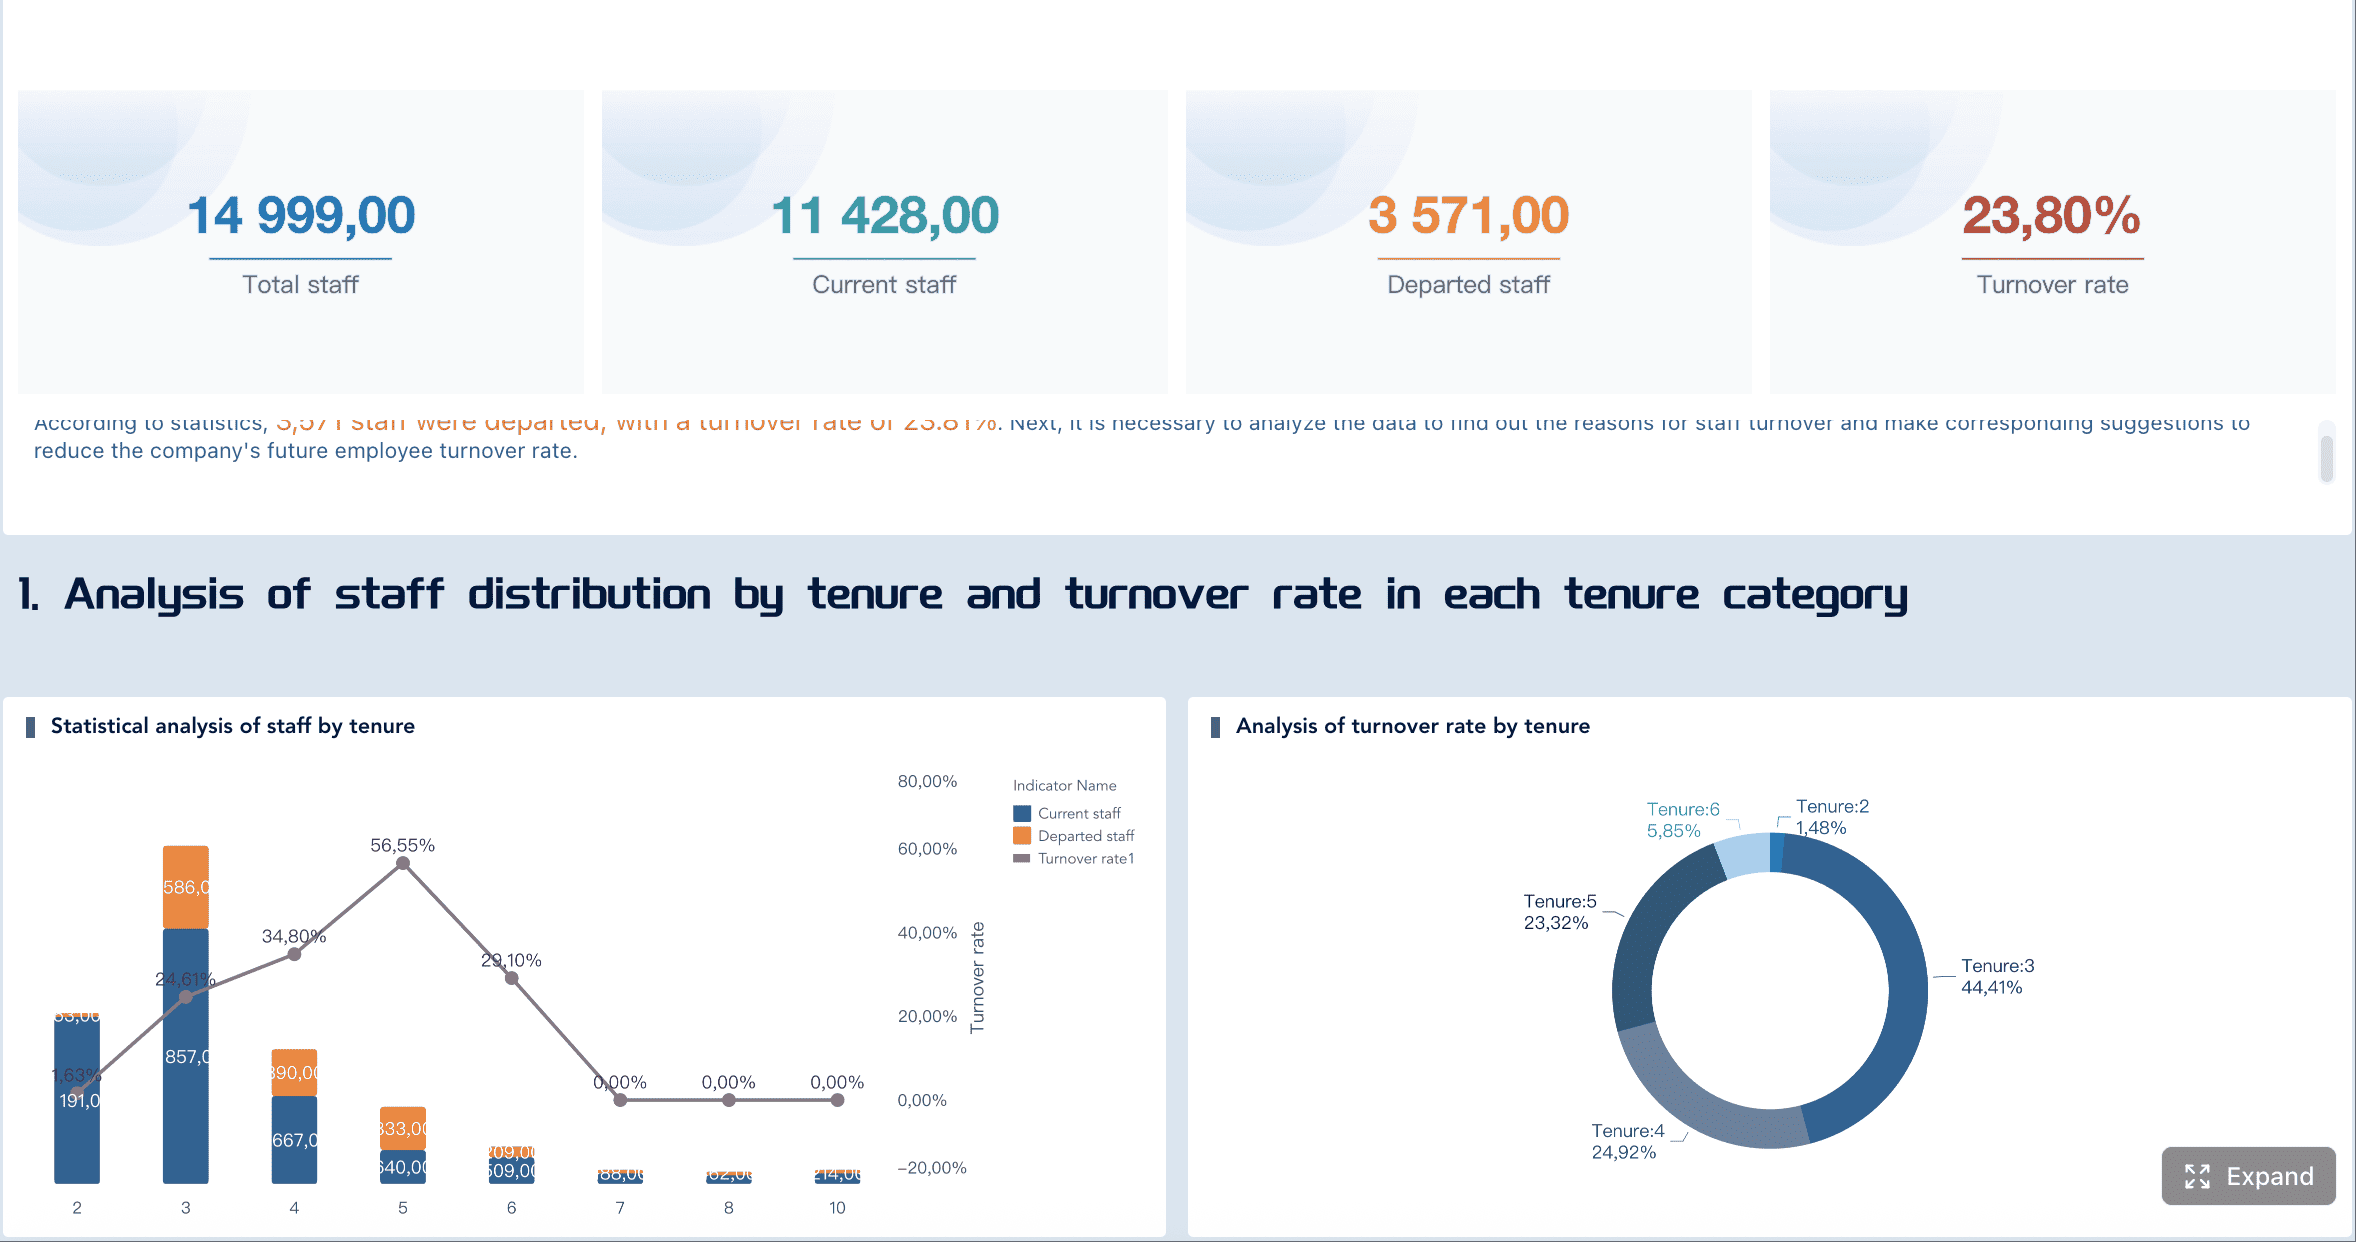
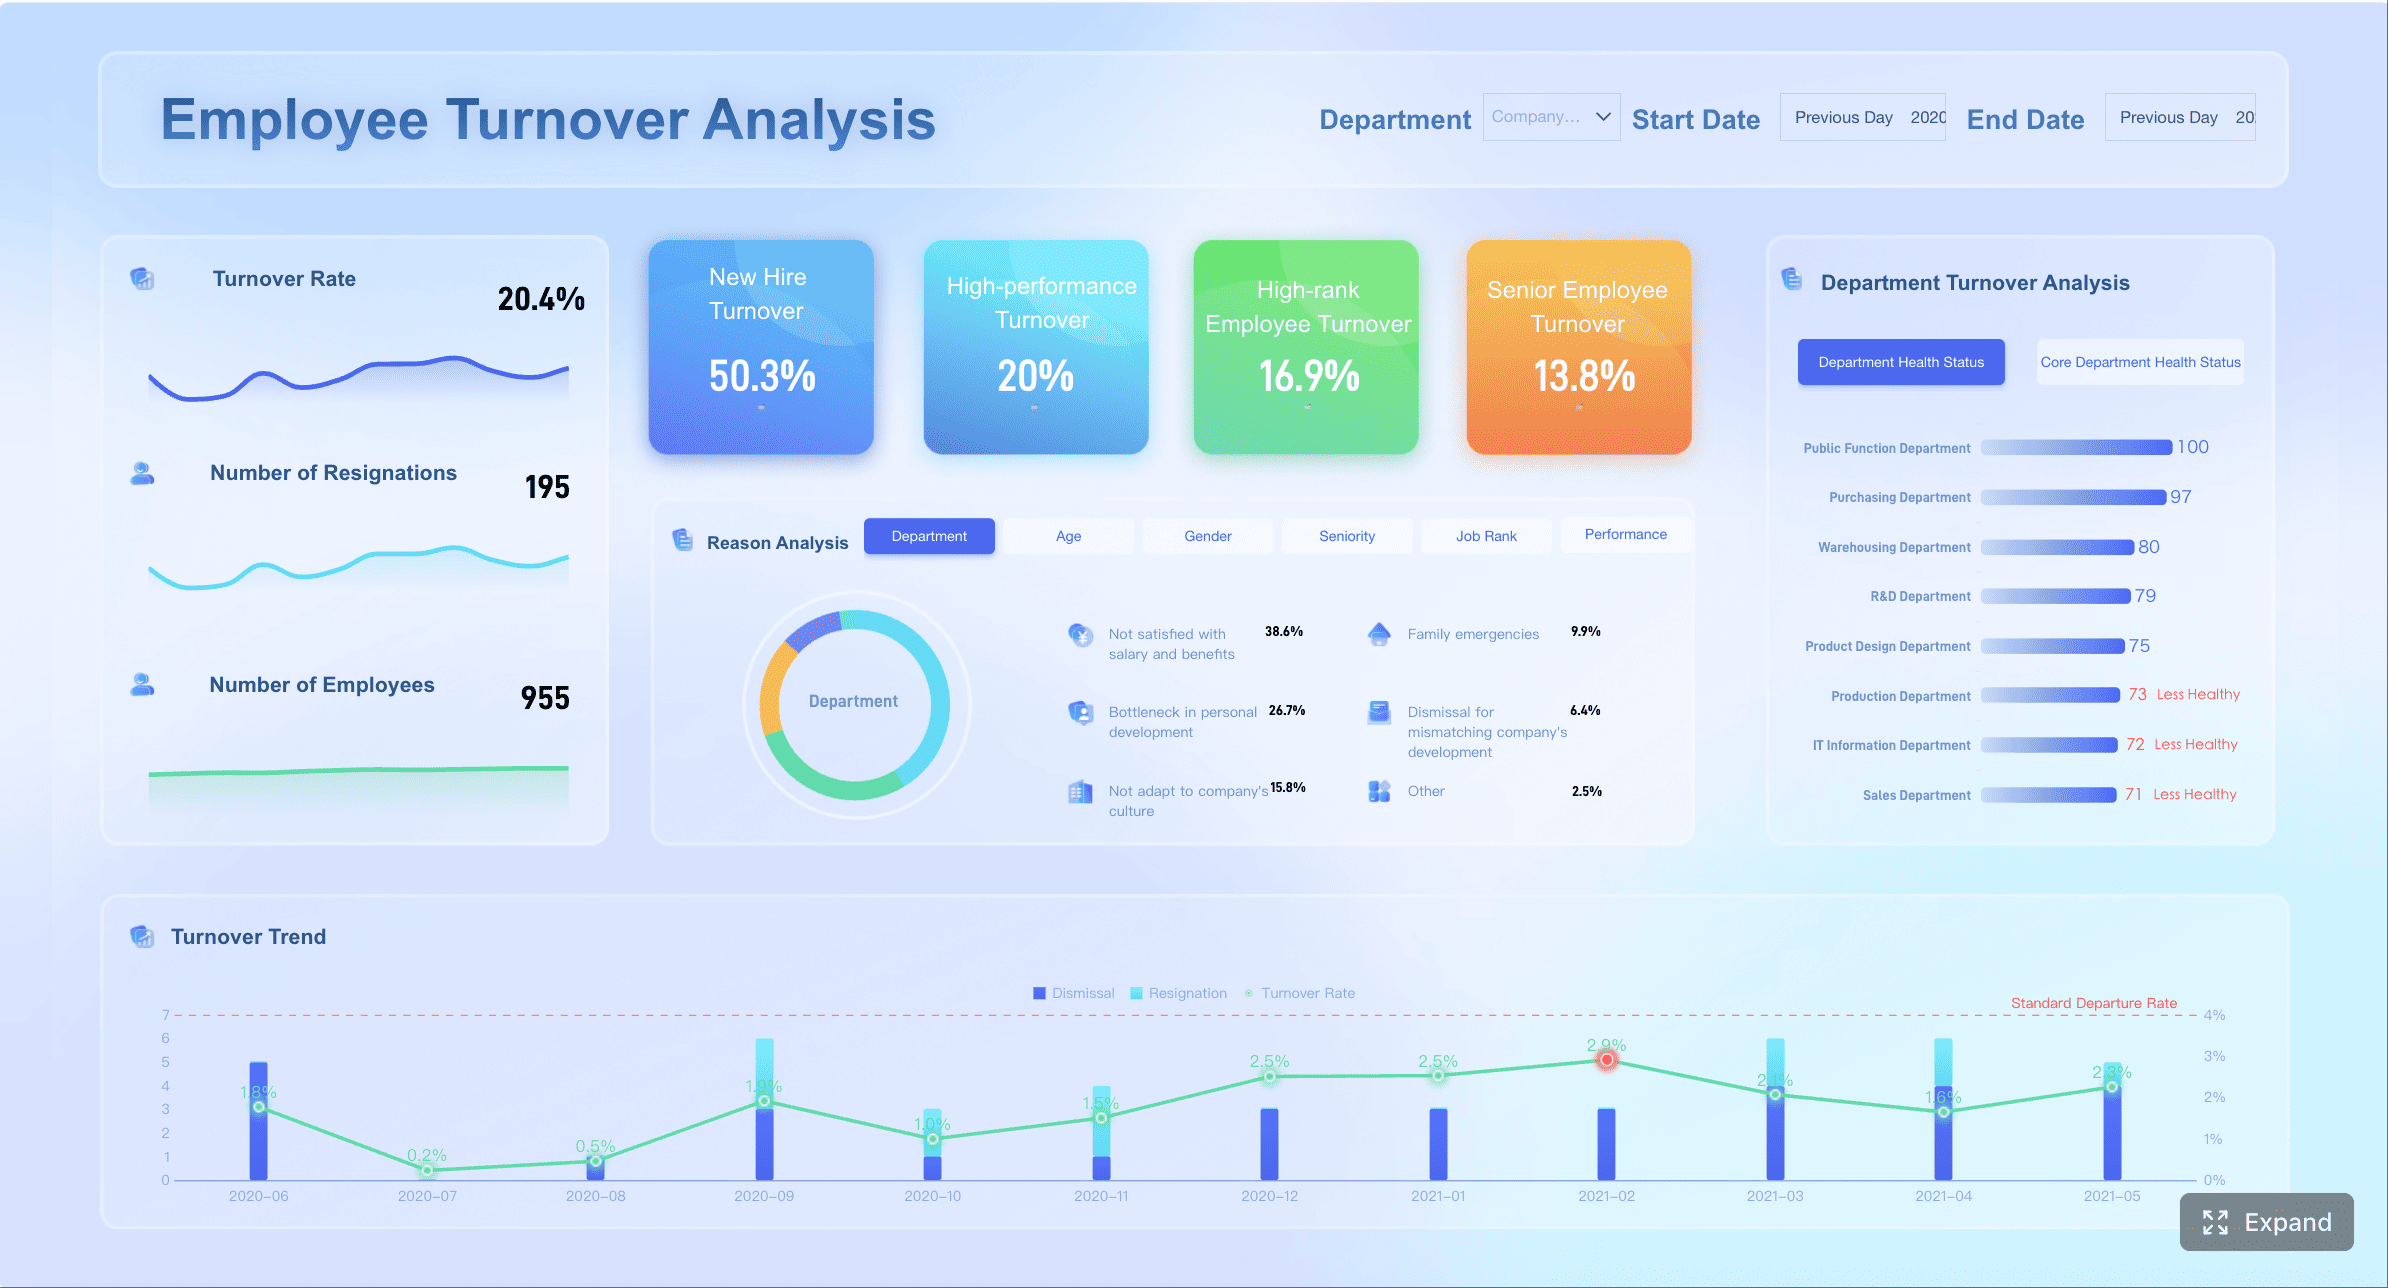
Recruitment metrics dashboard examples for multi-region use cases
A multi-region company rarely needs one dashboard. It needs a connected dashboard system.
The visual design should stay restrained. Use trend lines, scorecards, and exception flags rather than cluttered chart collections.
Example 2: Regional recruiting dashboard
This dashboard serves regional TA leaders and HR business partners.
Its role is to surface:
bottleneck stages
local source mix
aging roles
SLA adherence
market-specific drop-off patterns
For a region, the real value is not just seeing performance but understanding why it differs. That often means adding contextual cuts such as:
city or country
role family
business cluster
hiring manager group
recruiter
source channel
This view should also reflect local realities. For example, a region with stricter compliance review or slower relocation approval needs context visible in the dashboard narrative or filters.
Example 3: Functional hiring dashboard for recruiters and TA managers
This is the most action-oriented dashboard in the stack.
Its purpose is to help recruiters and TA managers decide what to do next. It should prioritize:
open requisitions
stage movement
interviewer capacity
overdue actions
stalled candidates
recruiter workload
hiring manager follow-up needs
The best recruiter dashboards connect activity metrics to outcomes. For example, instead of simply showing number of interviews scheduled, the dashboard should show whether interview throughput is reducing aging reqs or improving conversion.
This keeps the team focused on action, not vanity metrics.
How to implement and scale recruiting metrics dashboard without breaking global reporting
Implementation should be staged. If you launch a full global dashboard without fixing metric logic first, you will scale inconsistency rather than insight.
A practical program starts with an audit:
current metric definitions
ATS fields and workflow differences
regional process variations
spreadsheet dependencies
local reporting exceptions
data quality gaps
stakeholder decision needs
From there, launch with a minimum viable metric set. This is critical. Do not try to standardize every recruiting metric in phase one. Start with a short list of trusted measures that matter most to leadership and operations.
Once users trust those numbers, you can expand into deeper cuts such as source efficiency, interviewer throughput, diversity pipeline metrics, and quality-related indicators.
Governance must also be explicit. That means defining:
who owns metric changes
who approves dashboard revisions
who validates region mappings
how exceptions are documented
when refresh logic changes
what sign-off is required before global roll-up updates
Regular adoption reviews matter too. A recruiting metrics dashboard should drive decisions. If it becomes a passive report no one uses in hiring reviews, the problem is usually not visual design. It is relevance, trust, or ownership.
Common rollout mistakes to avoid
Several mistakes repeatedly derail multi-region dashboard projects.
1. Copying one region’s process into every market
This creates resistance and often fails operationally. Standardize reporting logic, not every local workflow step.
2. Adding too many metrics too early
If definitions are unstable, more metrics create more noise. Start narrow, then expand.
3. Treating ATS data as inherently reliable
ATS data is often incomplete, delayed, or used differently across regions. Validation and exception handling are mandatory.
4. Ignoring data confidence signals
If regions have unequal data quality, comparisons should reflect that explicitly.
5. Building for reporting instead of action
A dashboard that only explains the past will not improve recruiting execution.
A practical rollout sequence
A workable rollout sequence for a global recruiting metrics dashboard looks like this:
Establish metric governance
Align leaders on KPI definitions, ownership, and roll-up rules
Audit systems and map local workflows
Identify ATS stages, field gaps, and regional variations
Build the canonical metric layer
Create the shared logic that powers all dashboard views
Prototype dashboards by audience
Design separate executive, regional, and recruiter views
Pilot in selected regions
Test usability, mapping logic, and trust in the data
Refine based on adoption and disputes
Fix definitions, filters, and drill-down structure before scaling
Roll out in phases across regions
Expand only when coverage and governance are stable
Success criteria should cover both strategic and operational outcomes. For example:
Success dimension
Example criteria
Executive consistency
Cross-region KPI reporting accepted in leadership reviews
Local usability
Recruiters and regional leaders use dashboards in weekly operations
Data trust
Reduced metric disputes and fewer manual reconciliation requests
Decision impact
Faster escalation of bottlenecks and improved hiring predictability
Make the recruiting metrics dashboard decision-ready with FineBI
If your organization is trying to support multi-region recruiting without sacrificing global reporting integrity, the real challenge is not just dashboard creation. It is building a governed analytics environment that can scale across systems, roles, and regions.
FineBI can help enterprises build a recruiting metrics dashboard architecture that is both standardized and flexible:
Connect multiple source systems such as ATS, HRIS, spreadsheets, and operational databases
Model a governed metric layer so enterprise KPIs stay stable across regions
Support role-based dashboards for executives, regional leaders, recruiters, and TA operations
Enable drill-down analysis from global roll-up to local workflow detail
Refresh data efficiently for near real-time recruiting visibility
Reduce spreadsheet dependency and manual reconciliation effort
For enterprise teams, the practical value is clear: FineBI supports the layered reporting model described in this guide. You can preserve one trusted global view while still giving each market the flexibility to monitor the operational signals that matter locally.
That is what a high-performing recruiting metrics dashboard should do. It should not force artificial process uniformity. It should create metric consistency, reporting trust, and decision speed.
If you are planning a dashboard redesign, start with metric governance and reporting taxonomy first. Then use a platform like FineBI to turn that operating model into scalable, role-based recruiting intelligence.
Get Ready-to-Use Dashboard Templates in Fine Gallery
It should include a globally standardized KPI layer for metrics like time to fill, offer acceptance rate, pipeline conversion, and hiring volume, plus region-specific operational views for local workflow management. This structure keeps executive reporting comparable without removing local process detail.
Start with a shared metric dictionary and define global funnel stages, formulas, ownership, and roll-up rules. Then map local ATS stages and regional process steps into that common reporting layer instead of forcing every team into identical workflows.
Trust usually breaks when stage definitions differ by region, formulas are inconsistent, or exceptions are undocumented. Once leaders see conflicting numbers for the same KPI, reporting discussions shift from decisions to data disputes.
Global KPIs support cross-region comparison and executive decisions, while local metrics help recruiters manage market-specific execution. For example, time to fill may roll up globally, but visa review timing or agency handoff status may stay regional.
Refresh cadence depends on business needs, but it should be consistent, documented, and owned by specific teams. Regular governance reviews are just as important as data updates because they keep definitions, exceptions, and roll-up logic accurate over time.
Product Trial
FineReport
Pixel-perfect reports · Interactive dashboards · Easy data entry · Digital twins