A strong workforce management dashboard does more than display HR metrics. It gives HR and finance leaders one trusted view of labor cost, staffing capacity, productivity, hiring pressure, and workforce risk—so they can make faster, better decisions.
In many organizations, workforce data already exists everywhere: HRIS, payroll, time and attendance, recruiting systems, scheduling tools, and spreadsheets. The real issue is not data scarcity. It is fragmentation. Leaders spend too much time reconciling numbers and too little time acting on them.
This guide explains what an executive-ready workforce management dashboard should do, how to design one well, and which dashboard examples are most useful for high-stakes decision-making.
Why a workforce management dashboard matters for HR and finance leaders
For HR and finance leaders, workforce decisions are business decisions. Headcount growth affects margin. Overtime affects budget variance. Turnover affects continuity, service quality, and replacement cost. Recruiting delays affect revenue plans and delivery capacity.
A well-designed workforce management dashboard connects these signals in one executive view.
Instead of reviewing separate reports for payroll, staffing, productivity, and hiring, leaders can see:
Whether labor costs are tracking to plan
Where capacity is under pressure
Which teams are overstaffed or understaffed
How turnover risk may affect future hiring needs
Where action is required now, not next month
The business problem is simple: there is too much workforce data, but not enough decision-ready insight.
When dashboards are built only as reporting layers, they often become passive. They show historical numbers, but they do not support planning, governance, or intervention. Executive teams need something different. They need a dashboard that helps answer practical questions such as:
Are we hiring faster than budget allows?
Which departments are relying too heavily on overtime?
Where is attrition creating hidden labor cost?
Do we need redeployment, backfills, or a hiring freeze?
Are compliance or representation risks increasing?
A dashboard built for executive use should therefore provide three outcomes:
Executive need
What the dashboard should deliver
Business value
Planning
Forward-looking workforce and cost visibility
Better budgeting and resource allocation
Governance
Shared definitions, controls, and exception alerts
Higher trust in decisions
Fast action
Clear ownership, thresholds, and drill-down paths
Faster intervention and lower risk
After complex metric frameworks are introduced, it helps to place a visual overview of the enterprise KPI layer here.
All dashboard examples in this article created by FineBI.
The core design principles behind an executive workforce management dashboard
A dashboard only becomes useful when it is designed around decision-making, not metric accumulation. The best executive dashboards are opinionated. They focus attention. They reduce noise. They help leaders move from signal to action quickly.
Start with decisions, not just data
The first mistake many teams make is starting with available data fields instead of leadership decisions.
An effective workforce management dashboard begins with a short list of recurring questions leaders need answered every week or month. For example:
Are labor costs within approved budget?
Where are staffing gaps affecting output or service levels?
Which business units are showing rising turnover risk?
Is overtime solving a short-term problem or masking a structural one?
What vacancies threaten critical operations?
These questions determine the metrics. Not the other way around.
For executive audiences, prioritize measures that directly support:
Budget control: labor cost, variance to plan, overtime cost, cost per employee
If a metric does not support a decision, it probably does not belong on the executive layer.
After defining the decision framework, a simple decision-to-metric map works well.
Align HR and finance around a shared metric framework
A dashboard loses credibility when HR and finance use different definitions for the same metric.
Before building, align on standard definitions for core workforce measures, especially:
Headcount: active employees only, or include leave and contractors?
Turnover: monthly, quarterly, annualized, voluntary only, or total?
Overtime: hours, cost, or both?
Vacancy rate: approved open positions only, or all unfilled roles?
Labor cost: salary plus bonus, taxes, benefits, and contingent labor, or payroll only?
This alignment is essential because executive dashboards are decision systems. If leaders debate definitions during every review, the dashboard fails its purpose.
A practical approach is to separate:
Strategic KPIs for the executive homepage
Operational drill-downs for HRBPs, finance analysts, and department leaders
That separation keeps the dashboard concise while preserving analytical depth.
Platform FineBI can align HR and finance teams around a shared metric framework.
Make the dashboard easy to maintain and update
A dashboard that is hard to update eventually becomes untrusted.
Defined refresh cadence, such as daily, weekly, or monthly
Data quality checks for key source systems
Version control for calculation logic and layout changes
A governance process for adding or retiring metrics
Maintenance discipline matters because executive users notice stale or inconsistent numbers immediately.
The design itself should also reduce clutter. Use visual hierarchy to surface:
Trends
Exceptions
Variance against plan
Action points
In practice, this means fewer charts, clearer labels, and stronger use of thresholds.
After describing dashboard architecture and governance, a maintenance-friendly layout mockup is useful.
7 workforce management dashboard examples for executive decision-making
Different dashboard views solve different leadership problems. In most organizations, one executive dashboard will summarize the enterprise picture, while supporting pages or linked dashboards handle specific topics.
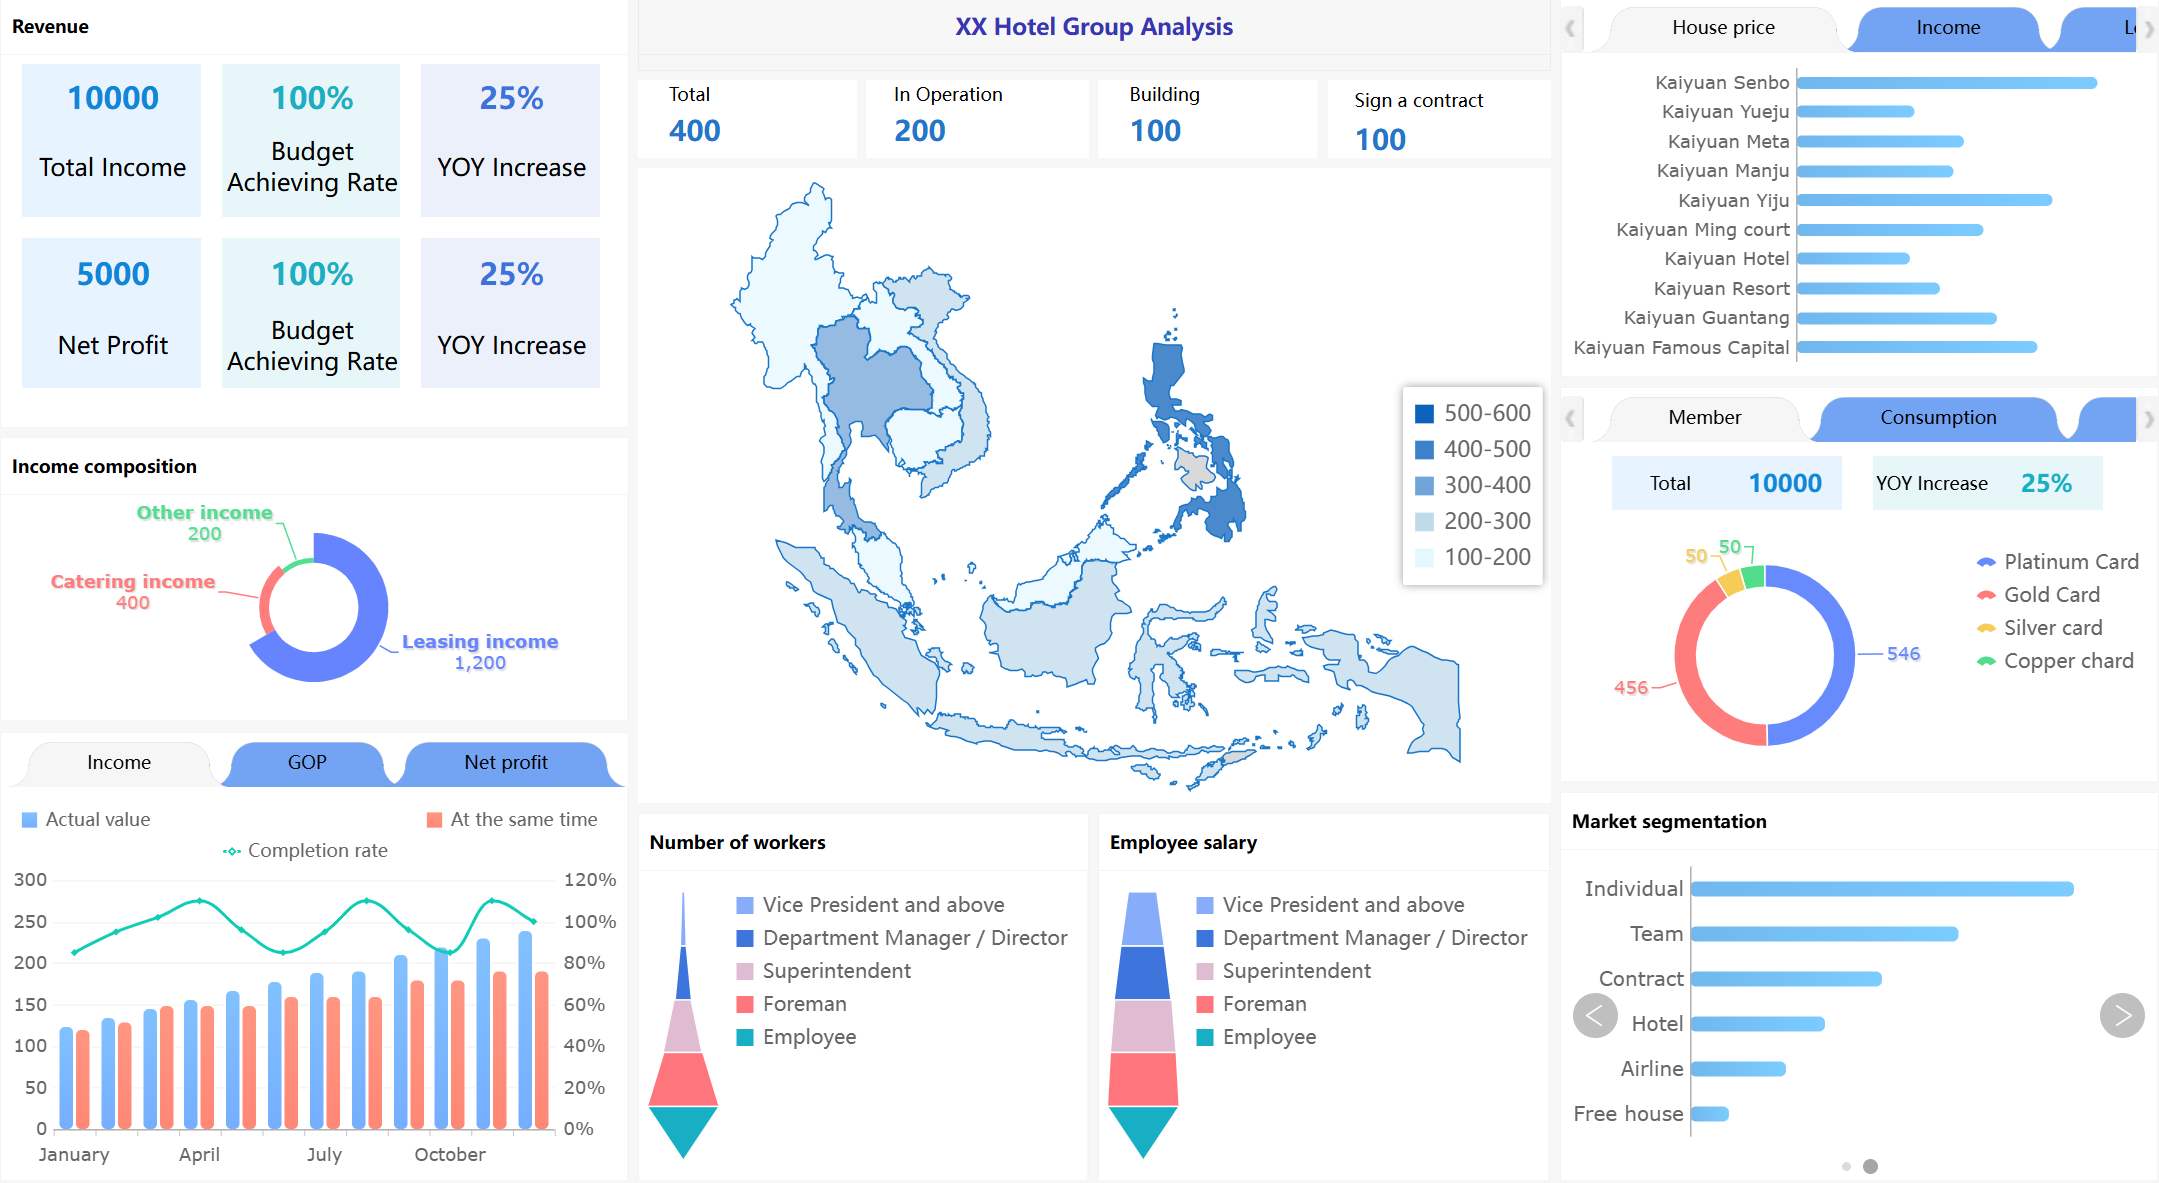
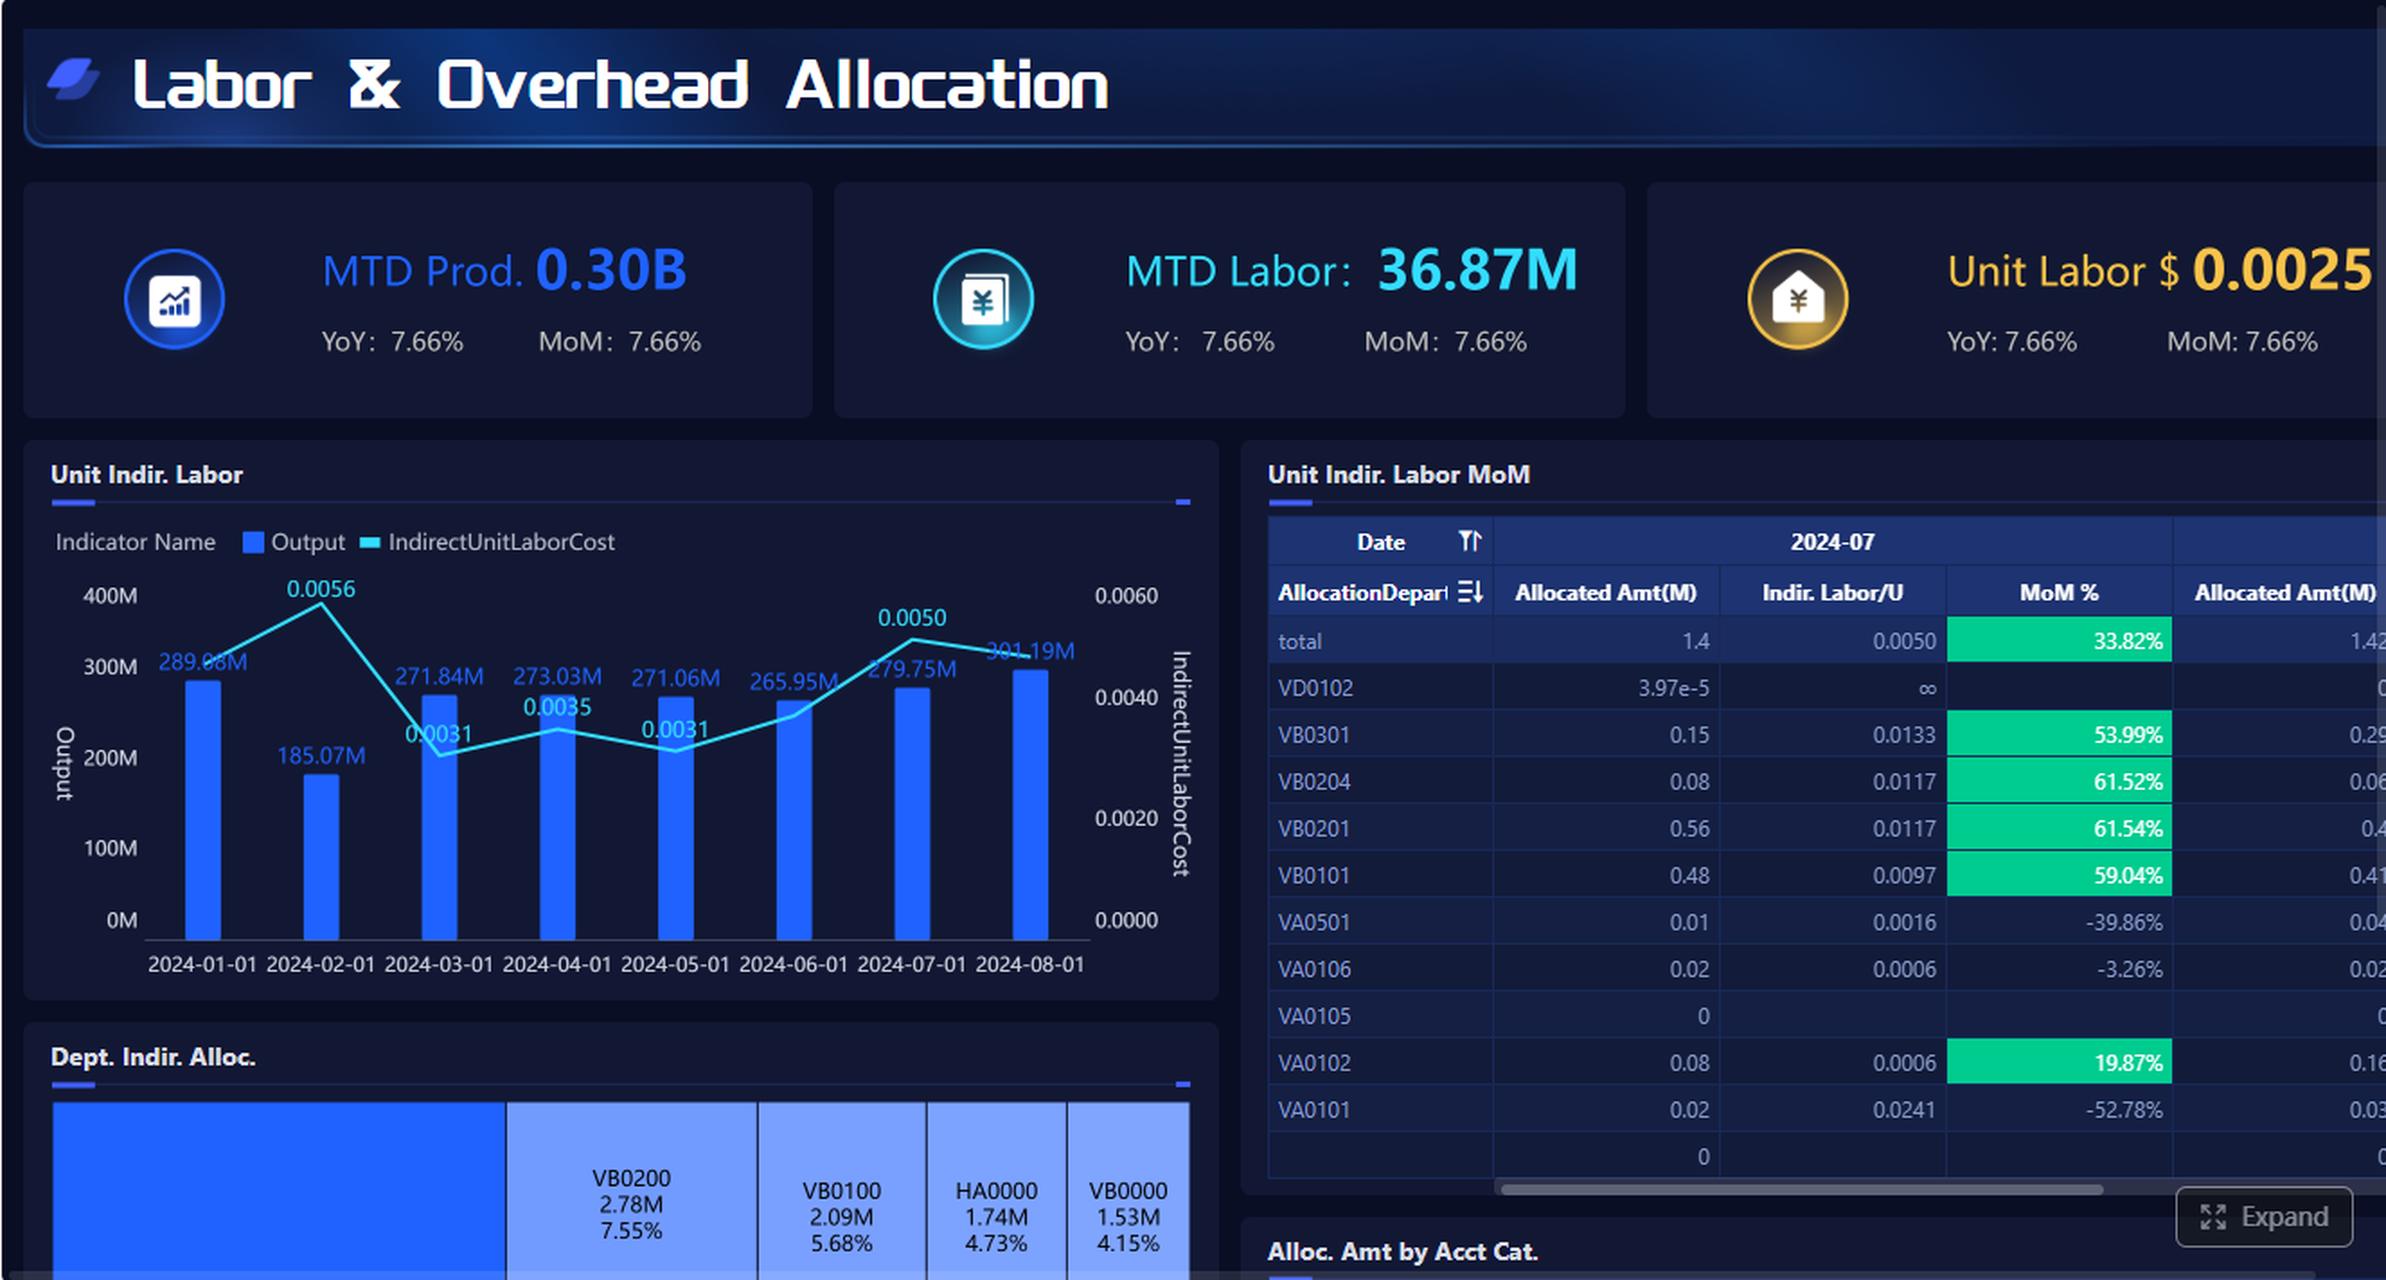
Its main purpose is to show whether workforce growth and labor spending are aligned with financial targets. HR and finance leaders should be able to see budgeted versus actual headcount, labor spend by department, and cost per employee in one view.
Key metrics often include:
Budgeted headcount vs actual headcount
Labor spend vs budget
Cost per employee
Salary and overtime mix
Hiring pace by function or region
Compensation change impact
This dashboard is especially useful when leaders need to understand whether cost pressure is driven by faster hiring, wage inflation, role mix changes, or unplanned backfills.
A good layout might include:
Section
Example visual
KPI summary
Headcount, labor cost, cost per employee, variance to budget
Trend analysis
Monthly headcount and labor spend trends
Variance view
Department-level budget vs actual waterfall
Drill-down
Region, business unit, job family
The most important insight is not just where cost is high. It is why.
After this section, place a dashboard image with variance-to-budget and department cost breakdown.
2. Productivity and capacity dashboard
Labor cost without capacity context is incomplete. Leaders also need to know whether staffing levels are producing the expected output.
A productivity and capacity dashboard compares output, utilization, overtime, and staffing levels across teams, business units, or locations. It helps answer a critical executive question: are we resourcing work efficiently?
Common metrics include:
Utilization rate
Output per FTE
Overtime hours
Staffing ratio
Capacity vs demand
Service level attainment
This view is valuable in operations-heavy, customer-facing, project-based, and distributed workforce environments. It helps surface whether margin pressure is coming from understaffing, low productivity, scheduling imbalance, or demand spikes.
A strong dashboard should quickly reveal:
Teams consistently exceeding utilization thresholds
Sites with rising overtime and falling output
Departments carrying excess capacity
Manager-level imbalance in staffing allocation
When built well, this dashboard supports both cost discipline and service continuity.
After explaining utilization and capacity trade-offs, add a visual comparing output and staffing levels.
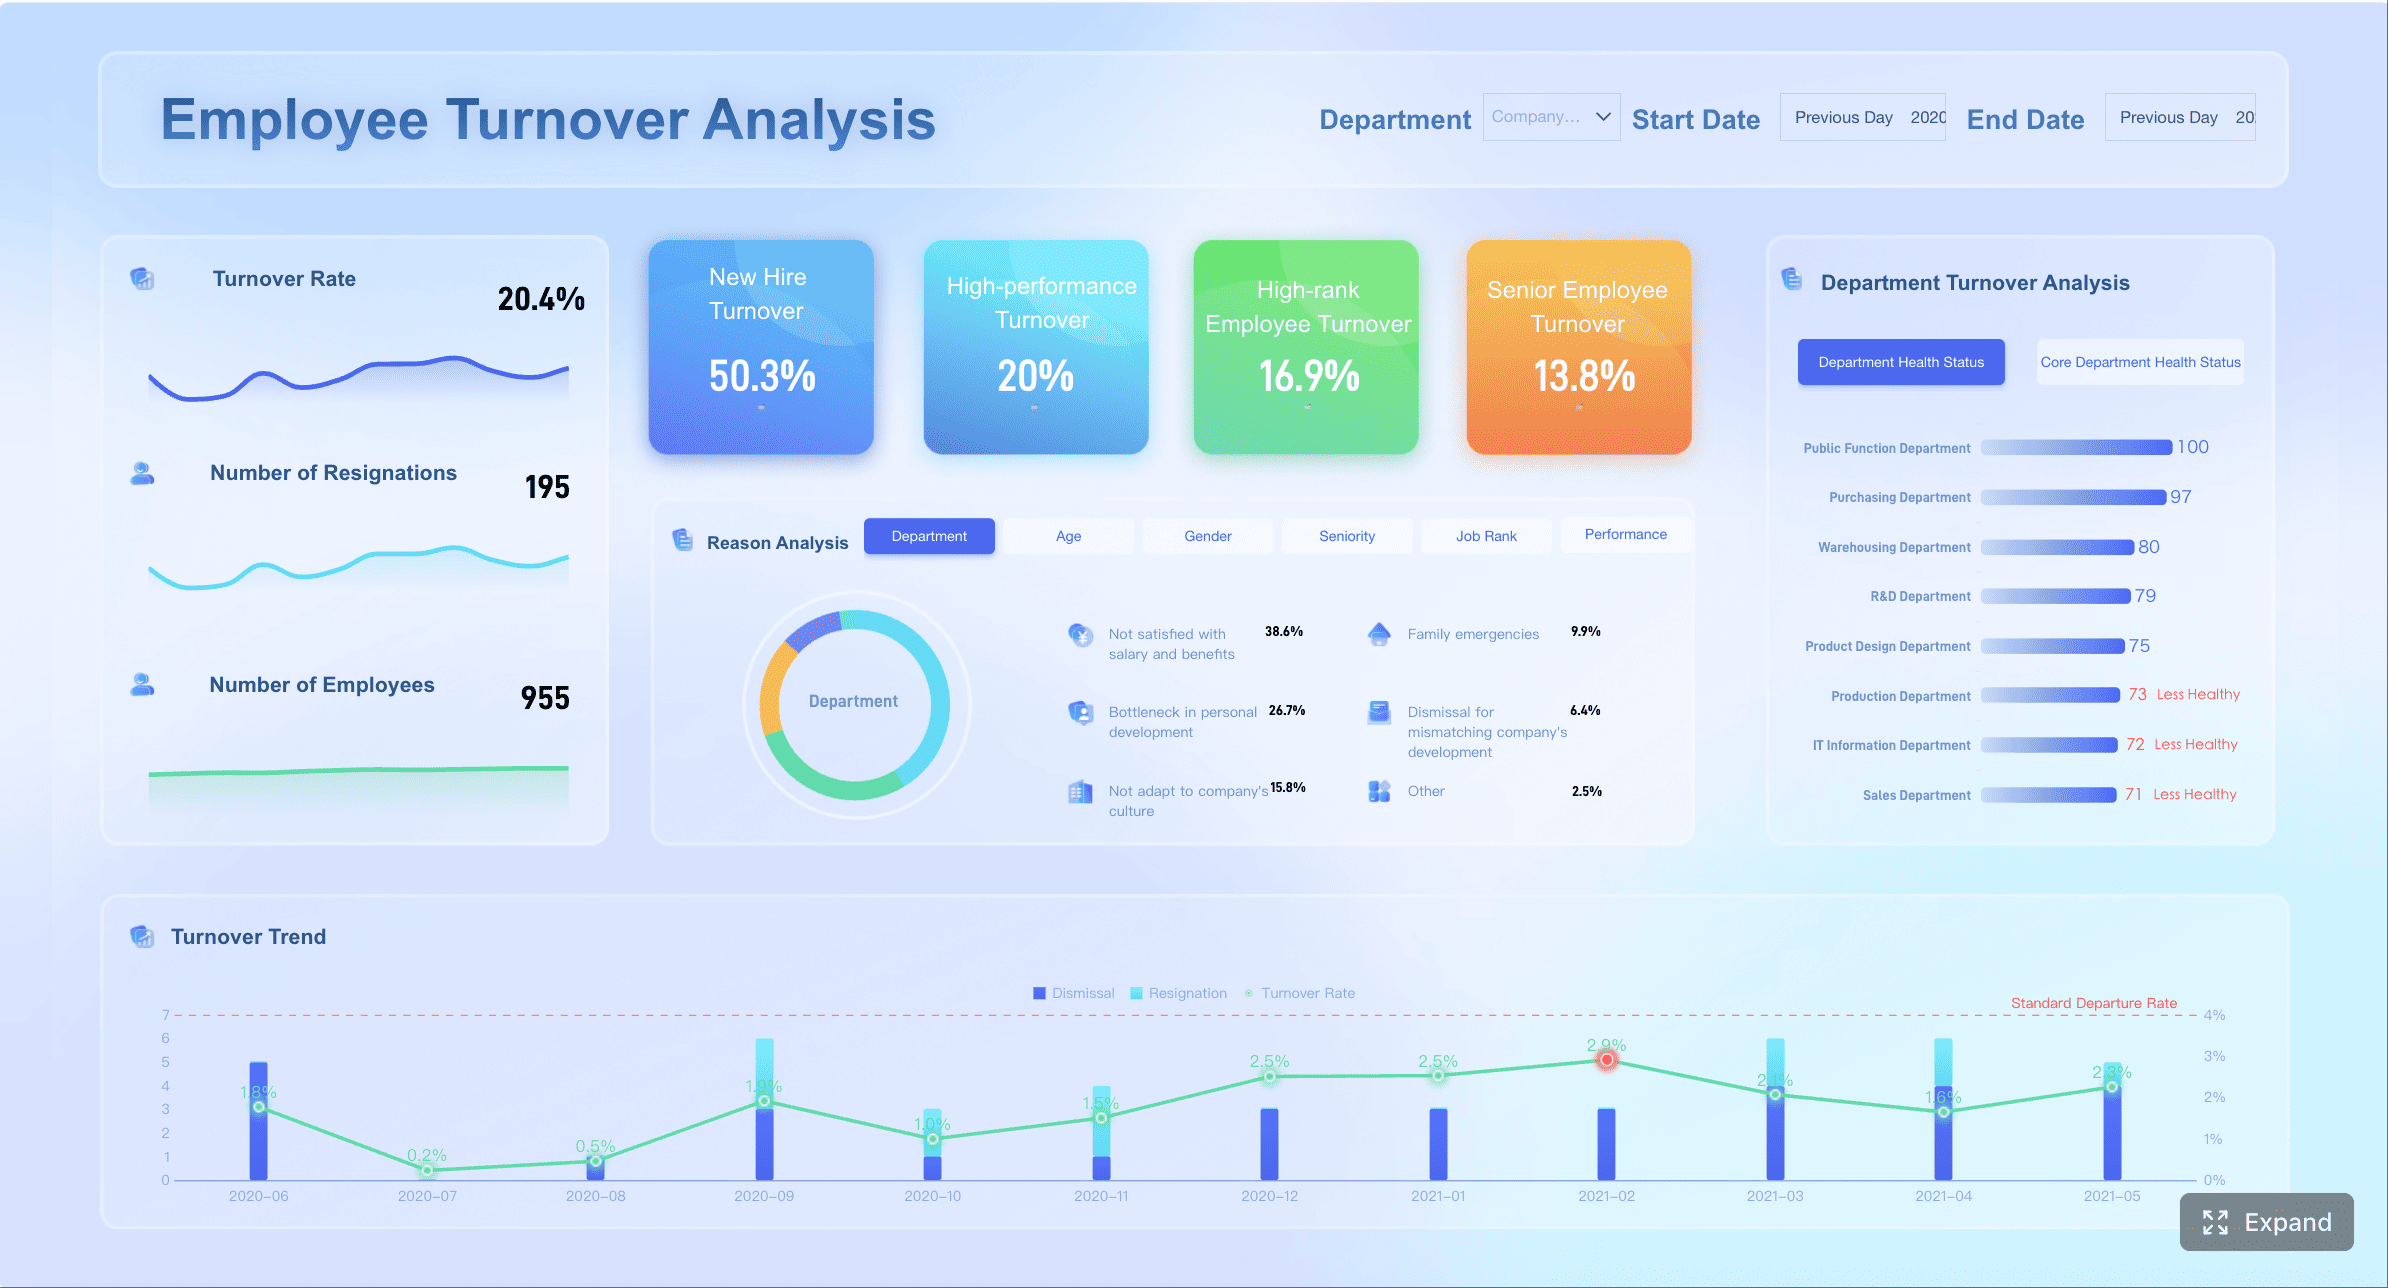
3. Turnover and retention risk dashboard
Turnover becomes expensive long before it becomes obvious in financial statements.
This dashboard helps leaders spot where people risk may turn into financial or operational disruption. It is especially important for critical functions, high-skill roles, and customer-facing teams.
Executive teams should not just see overall turnover. They should be able to identify where the risk is concentrated. For example:
High performers leaving one business unit
Short-tenure attrition increasing in frontline roles
Retention issues clustered under specific managers
Senior talent exits affecting succession depth
A useful design pattern is to combine a high-level attrition summary with a risk matrix that shows business impact and urgency.
After discussing regrettable loss and tenure mix, include a risk segmentation visual.
4. Time, attendance, and overtime dashboard
This dashboard is essential when labor efficiency problems show up in scheduling, attendance, or daily workforce execution.
It should allow leaders to review:
Absenteeism rate
Schedule adherence
Overtime spikes
Shift coverage gaps
Late arrivals or missed shifts
Cost impact of attendance variance
The executive value of this dashboard lies in diagnosis. Overtime and absence are often symptoms, not root causes. A strong dashboard helps distinguish whether labor inefficiency is:
Operational, due to poor staffing models
Policy-related, due to weak attendance controls
Manager-driven, due to inconsistent scheduling behavior
For HR and finance leaders, this dashboard is often where short-term cost leakage becomes visible before month-end closes.
A concise page might show enterprise trends at the top, with business-unit exceptions below. Leaders should immediately know where intervention is needed and which manager or function owns the issue.
After describing attendance and overtime diagnostics, add a targeted operations visual.
5. Recruiting pipeline and vacancy dashboard
Vacancies are not just recruiting metrics. They are business continuity and planning metrics.
A recruiting pipeline and vacancy dashboard connects open roles, funnel conversion, time to fill, and vacancy cost. It shows how recruiting friction affects payroll planning, team productivity, and operational resilience.
This dashboard is particularly useful for organizations with fast growth, hard-to-fill roles, distributed hiring, or strict budget governance.
Leaders should be able to see:
Which roles are aging beyond threshold
Where the hiring funnel is breaking
Which functions face the highest vacancy cost
Whether hiring delays are likely to create overtime or service issues elsewhere
A strong executive view links hiring delays to business consequences, not just recruitment activity.
After outlining pipeline conversion and vacancy cost logic, insert a recruiting performance layout.
6. Workforce planning and scenario dashboard
This is where the dashboard moves from reporting to planning.
A workforce planning and scenario dashboard helps leaders model staffing needs under different business conditions, such as growth, cost reduction, seasonal demand, restructuring, or regional expansion.
This dashboard often includes:
Baseline headcount forecast
Demand-based staffing scenarios
Productivity assumptions
Hiring freeze impact
Redeployment opportunities
Role prioritization logic
Cost implications of each scenario
Executive teams use this view to compare trade-offs. For example:
Can a revenue target be met without new hiring?
Which roles should remain open during a hiring freeze?
Where can talent be redeployed instead of replaced?
What is the cost and service impact of a 5% labor reduction?
The best scenario dashboards are not overly technical. They show a few clear assumptions, several modeled outcomes, and the recommended action path.
After explaining scenario modeling, add a planning-oriented visual.
7. Diversity, compliance, and workforce risk dashboard
Executive workforce reporting should not stop at cost and productivity. Governance matters.
A diversity, compliance, and workforce risk dashboard brings together:
Representation by level, function, or location
Pay equity indicators
Compliance alerts
Leave and labor rule exceptions
Critical role exposure
Succession or concentration risk
This dashboard helps leadership balance performance goals with governance responsibilities and long-term resilience.
Its value is strategic. Representation and compliance issues can affect employer brand, legal exposure, culture, and talent access. Critical role concentration can expose the business to continuity risk. Pay equity gaps can become both financial and reputational liabilities.
A useful executive view should not attempt to replicate legal or compliance systems. Instead, it should surface material exceptions and trends that require leadership attention.
This is also where many organizations benefit from integrating workforce data into a more flexible BI environment rather than relying only on static HR system reports. When leaders want to combine HR, payroll, operational, and financial indicators in one governed view, a modern analytics platform becomes important.
After this governance-focused section, include a risk-oriented executive board layout.
Best practices for turning workforce management dashboard data into action
A dashboard creates value only when it changes decisions. To make that happen, design for action, not observation.
Focus each view on one executive decision
Every dashboard page should answer one specific question.
Examples include:
Do we need to intervene on labor cost variance?
Which functions require hiring prioritization?
Where is turnover becoming a business risk?
Is overtime indicating a staffing model problem?
Each page should also have:
A clear owner
A review cadence
Defined thresholds
An expected next step
This prevents dashboard reviews from becoming passive status meetings.
A simple operating model is helpful:
Review KPI signal
Identify exception
Assign owner
Confirm corrective action
Track impact next cycle
After this process explanation, a visual workflow improves usability.
Balance summary views with drill-down capability
Executives need summary views first. Analysts and managers need the ability to investigate.
The ideal workforce management dashboard starts with enterprise-level indicators, then allows deeper analysis by:
Function
Region
Business unit
Manager
Role family
This structure keeps the executive layer clean while preserving analytical power.
Avoid the common mistake of putting too many charts on the homepage. Executive dashboards should emphasize:
Workforce priorities change. So should the dashboard.
Review dashboard usefulness on a regular basis and ask:
Which metrics directly influenced decisions this quarter?
Which visuals are rarely used?
Are definitions still aligned across HR and finance?
Have new workforce models changed what leaders need to see?
Are there missing measures that would improve planning accuracy?
Retire low-value visuals. Add measures only when they improve decisions. A lighter dashboard that leaders trust is always better than a comprehensive one that nobody uses.
How to choose the right workforce management dashboard setup for your organization
The right setup depends on organizational complexity, reporting maturity, and decision cadence.
A mid-sized company may only need one executive workforce management dashboard with a few drill-down pages. A larger enterprise may require a layered model with:
Template-based dashboards can accelerate launch when needs are standard and source data is relatively clean. Custom builds are better when the organization needs cross-functional metrics, nonstandard logic, regional definitions, or deeper scenario planning.
A practical launch checklist:
Define the top 5 executive decisions the dashboard must support
Agree on KPI definitions across HR and finance
Identify source systems and refresh frequency
Assign metric owners and data stewards
Design one page per decision type
Add thresholds, alerts, and exception flags
Enable drill-downs without cluttering the executive layer
Pilot with a small leadership group
Refine based on real decision use
Establish a quarterly dashboard review process
If your organization wants to move beyond static HR reports and build a more governed, flexible decision layer, FineBI is a strong option to evaluate. It can help HR and finance teams unify workforce data from multiple systems, create executive-friendly visual dashboards, support drill-down analysis, and maintain stronger governance over definitions and refresh logic. This is especially valuable when workforce decisions require one shared view across cost, staffing, productivity, and risk—not separate reports owned by different functions.
For organizations aiming to turn workforce reporting into a true management system, the goal is not just to build a dashboard. It is to build a trusted decision environment. That is where the right platform, the right KPI model, and the right executive design make the difference.
It should combine headcount, labor cost, overtime, vacancy rate, turnover, and capacity signals in one trusted view. The most useful dashboards also show variance to plan and highlight where action is needed.
A workforce management dashboard is built for staffing, labor cost, scheduling, and workforce planning decisions, not just HR reporting. It connects operational and financial metrics so leaders can act faster.
The core metrics usually include headcount, labor cost variance, overtime, vacancy rate, turnover, and capacity utilization. The right mix depends on the decisions leaders need to make each week or month.
Update frequency should match the decision being supported, with some metrics refreshed daily and others weekly or monthly. What matters most is having a clear refresh cadence that leaders trust.
They usually lose trust when data definitions differ across HR and finance, source systems are disconnected, or updates are inconsistent. Too many metrics without clear ownership can also make the dashboard less useful.
Product Trial
FineReport
Pixel-perfect reports · Interactive dashboards · Easy data entry · Digital twins