If you need to know how to create a management report faster, the real challenge is not writing slides or formatting charts. It is turning scattered raw data into a decision-ready story that executives can trust. For operations directors, finance managers, department heads, and IT leaders, the pain points are familiar: too many data sources, inconsistent numbers, unclear priorities, and last-minute reporting pressure. A strong management report solves this by aligning data, insights, and actions in one clear structure that supports better decisions.
How to Create a Management Report Faster: Start With Purpose and Audience
The fastest way to build a useful report is to define why it exists before collecting a single number. Many teams waste time because they gather everything first and think about relevance later. That approach creates bloated reports, inconsistent messaging, and rework.
Clarify the report’s decision-making goal before gathering information
Every management report should support a specific decision, review, or action. Ask:
Is this report meant to review monthly performance?
Does leadership need to approve budget changes?
Is the purpose to flag operational risks early?
Is it used to evaluate progress against strategic goals?
If the goal is vague, the report will become a document dump. If the goal is clear, the content becomes easier to filter.
A useful way to frame the objective is: What should the reader know, decide, or do after reading this report?
Identify who will read it, what they care about, and how much detail they need
A CFO, COO, sales director, and plant manager do not read reports the same way. Senior leaders usually want trends, exceptions, risks, and implications. Team managers may need more operational detail.
Before drafting the report, define:
Primary audience: Who is the main decision-maker?
Secondary audience: Who will use it for execution?
Detail level: Do they need a summary, analysis, or transaction-level backup?
Preferred format: One-page summary, dashboard, slide deck, or detailed written report?
All reports in this article are built with FineReport
Define the reporting period, scope, and success criteria to avoid rework
One of the biggest causes of reporting delays is scope creep. Teams begin with a monthly performance review, then add year-to-date comparisons, budget details, project commentary, and risk logs halfway through.
Set these boundaries upfront:
Reporting period: Weekly, monthly, quarterly, or year-to-date
Business scope: Company-wide, division-specific, project-based, or regional
Data scope: Financial, operational, customer, workforce, or mixed
Success criteria: What makes this report complete and useful?
Key Metrics (KPIs) for an Effective Management Report
No matter the industry, a management report works best when it focuses on a structured set of metrics. These are the core elements decision-makers expect.
Revenue or Output Performance: Measures top-line business results, production volume, or service delivery progress.
Budget Variance: Shows the gap between planned and actual spend or resource use.
Target Achievement Rate: Tracks progress against goals, quotas, SLAs, or milestones.
Trend Direction: Indicates whether performance is improving, stable, or declining over time.
Operational Efficiency: Measures cycle time, utilization, throughput, or productivity.
Risk Status: Highlights blockers, compliance issues, or emerging threats to performance.
Forecast Accuracy: Compares expected outcomes with current projections.
Action Completion Rate: Tracks whether agreed follow-up tasks are being executed on time.
These KPIs help management move from observation to action.
Organize Raw Data Before You Build the Report
Once the report purpose is clear, the next step is preparing raw inputs. This is where speed is won or lost. If your source data is incomplete, inconsistent, or badly grouped, the final report will take twice as long to build and still be less reliable.
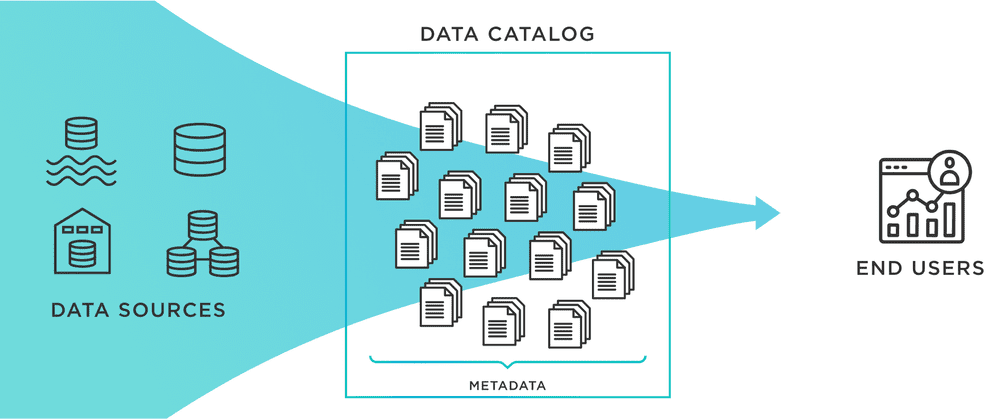
Gather inputs from the right sources
To understand how to create a management report efficiently, start by pulling data only from sources tied to the reporting objective.
The key is not collecting more data. It is collecting the right data.
When reviewing each source, ask:
Is it current?
Is it trusted by the business?
Does it align with the reporting period?
Is it directly relevant to the decisions this report supports?
Clean and group the information
Raw data is rarely report-ready. Before analysis, you need to clean and structure it.
Focus on these tasks:
Remove duplicate records
Fix or flag missing values
Standardize naming conventions
Align date formats and reporting periods
Normalize categories across sources
Validate totals and reconciliations
Then group the cleaned information into practical reporting categories such as:
Performance
Budget
Risks
Projects
Customer outcomes
Next steps
This categorization makes the final report easier to scan and easier to maintain over time.
Highlight the numbers that matter most
Executives do not need every available number. They need the few metrics that reveal performance shifts, business risk, and action priorities.
To separate signal from noise, look for:
Trends over time
Large variances versus plan
Missed milestones
Sudden spikes or drops
Gaps between teams or regions
Outliers needing explanation
A useful consultant habit is to ask: If I could only show five numbers, which five would change a decision?
Turn Data Into Insights Decision-Makers Can Use
A management report becomes valuable only when it explains what the numbers mean. Reporting data without interpretation forces decision-makers to do the analysis themselves, which slows action and reduces trust.
Compare results against targets and expectations
Numbers without context are weak. Always compare actual results against something meaningful, such as:
Strategic targets
Operating plan
Budget
Previous month or quarter
Same period last year
Forecast
This comparison shows whether performance is on track, ahead, or behind.
For example:
Revenue may be up 8%, but still below target by 3%.
Costs may be flat, but only because hiring was delayed.
Project completion may look healthy overall, while one critical milestone slipped.
That context is what makes a report decision-ready.
Explain what is driving the results
Once the performance gap is visible, explain the drivers clearly. Good reporting connects outcomes to business reality.
Common drivers include:
Operational process changes
Staffing or capacity constraints
Market demand shifts
Customer behavior changes
Supply chain delays
System issues
Budget freezes
Team execution quality
Keep facts and interpretation separate. State the evidence first, then explain the likely cause. This increases trust and makes discussions more productive.
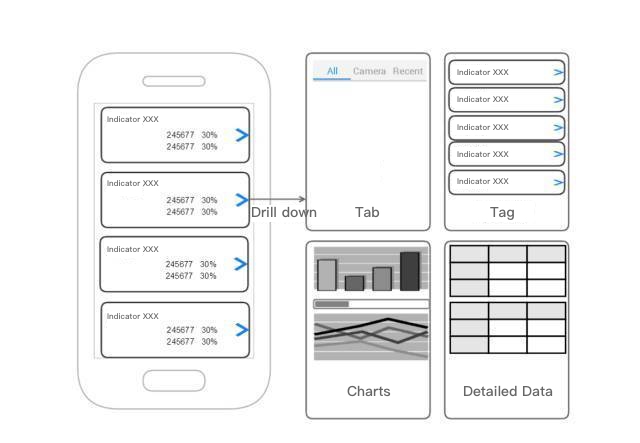
With drill-down function you can explain what is driving the results.
Prioritize the most important takeaways
One of the most common reporting mistakes is including too many findings with equal emphasis. Management does not need ten medium-priority observations. They need the top few issues that matter most.
Prioritize insights by:
Business impact: What affects revenue, cost, delivery, or customer outcomes most?
Urgency: What needs action now?
Risk level: What could worsen if ignored?
Decision relevance: What supports an upcoming leadership decision?
A practical rule: keep the report centered on three to five major takeaways.
Structure the Report for Fast Reading
Even strong analysis can fail if the report is hard to scan. Leaders read quickly. They want the headline, the impact, and the action path in minutes, not after ten pages of searching.
Lead with an executive summary
The executive summary should appear first and answer four questions immediately:
What happened?
Why does it matter?
What are the biggest risks or opportunities?
What action is recommended?
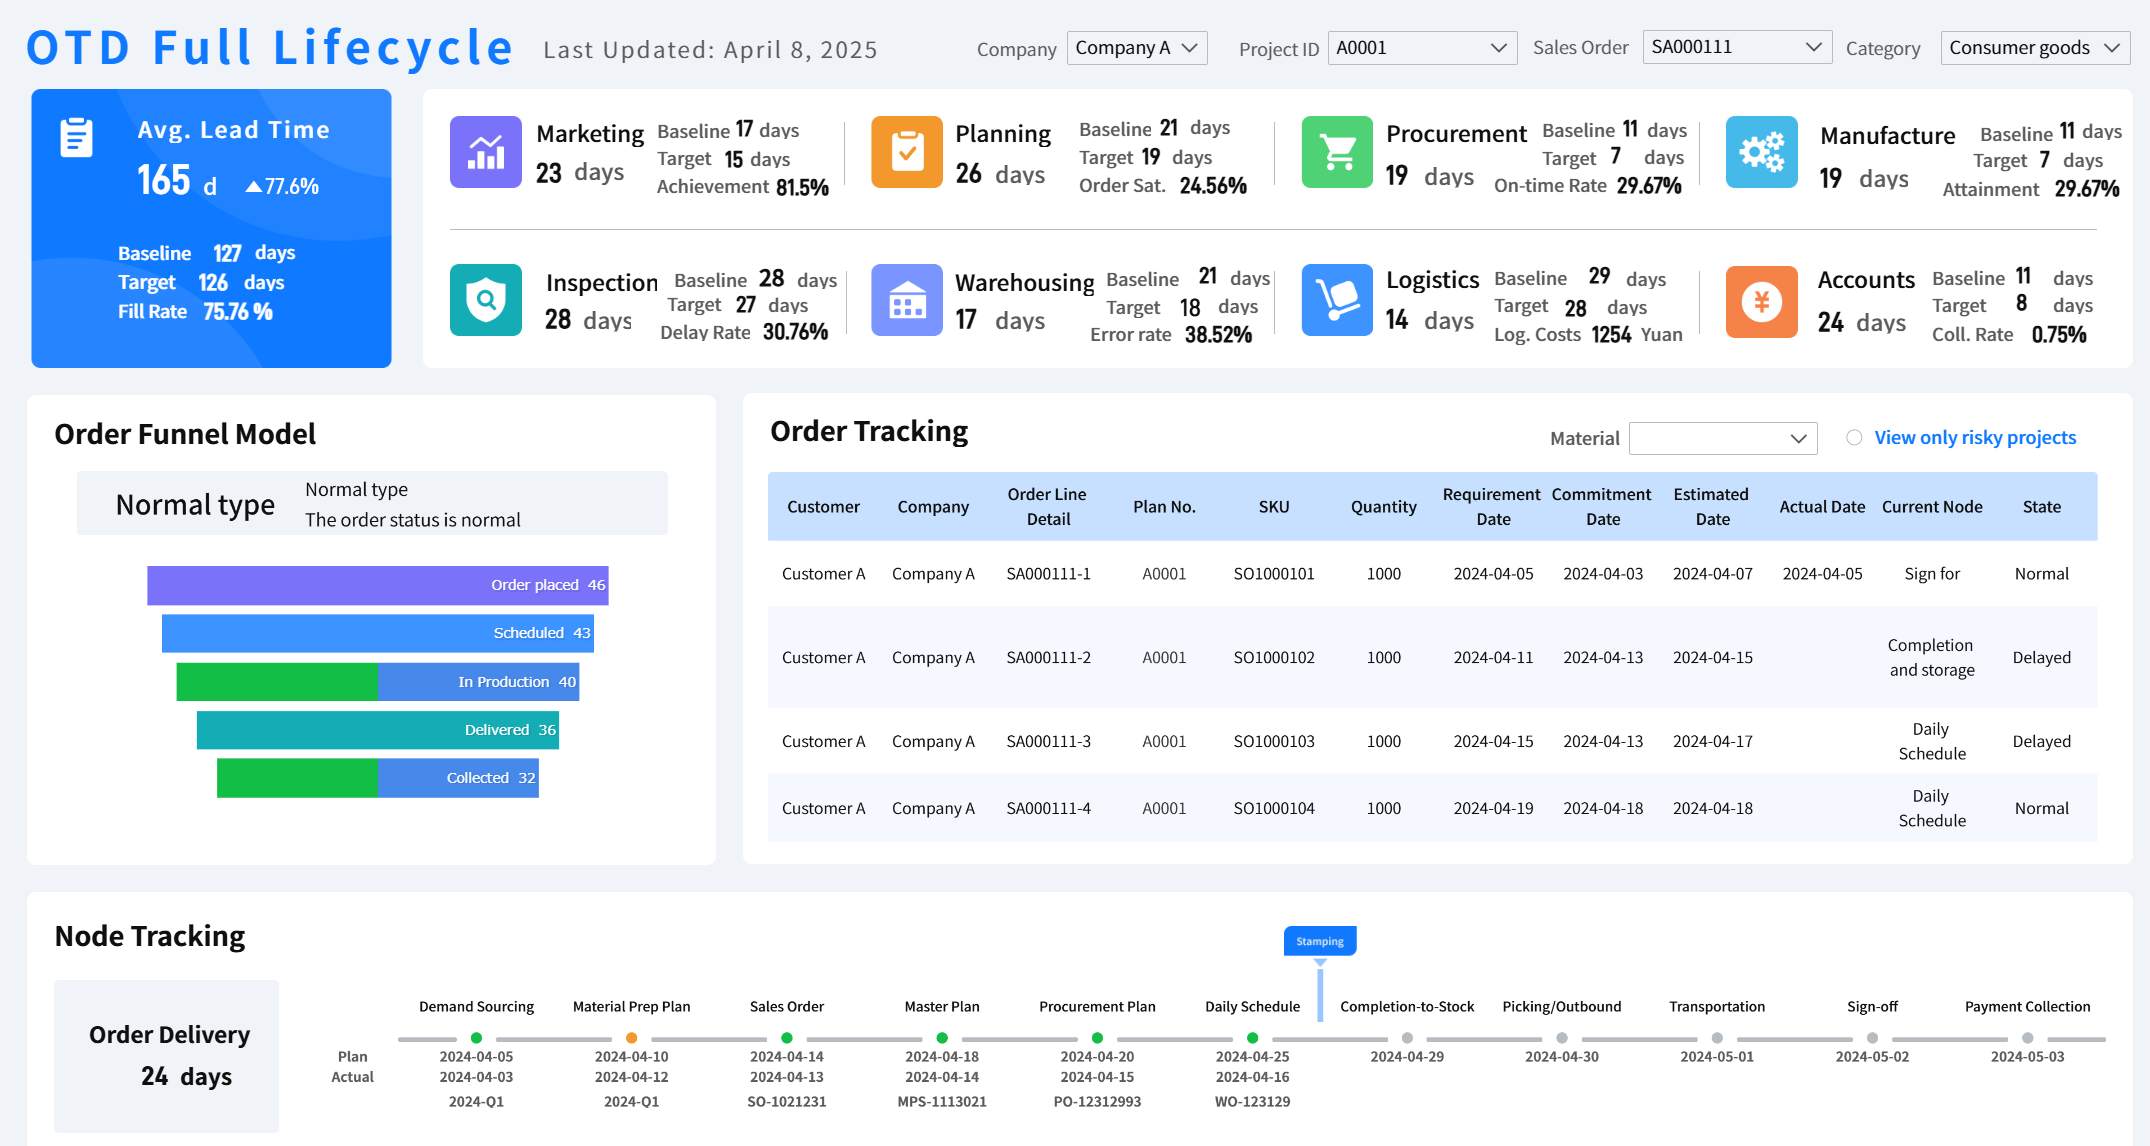
This section should be short, direct, and outcome-focused. Think of it as the management version of a control tower view.
A simple executive summary structure:
Element
What to include
Performance snapshot
Top KPIs and major movements
Business impact
Financial, operational, or strategic implication
Key issues
Major blockers, risks, or variances
Recommended actions
Clear next steps and decisions required
Build the body in a logical order
The body of the report should follow the questions leadership naturally asks next.
A high-performing structure often looks like this:
Performance overview
What are the top-line results?
Supporting analysis
What explains those results?
Risks and exceptions
Where is performance off track or exposed?
Recommendations and actions
What should happen next?
Each section should answer one core question. If a paragraph or chart does not support that question, it likely does not belong.
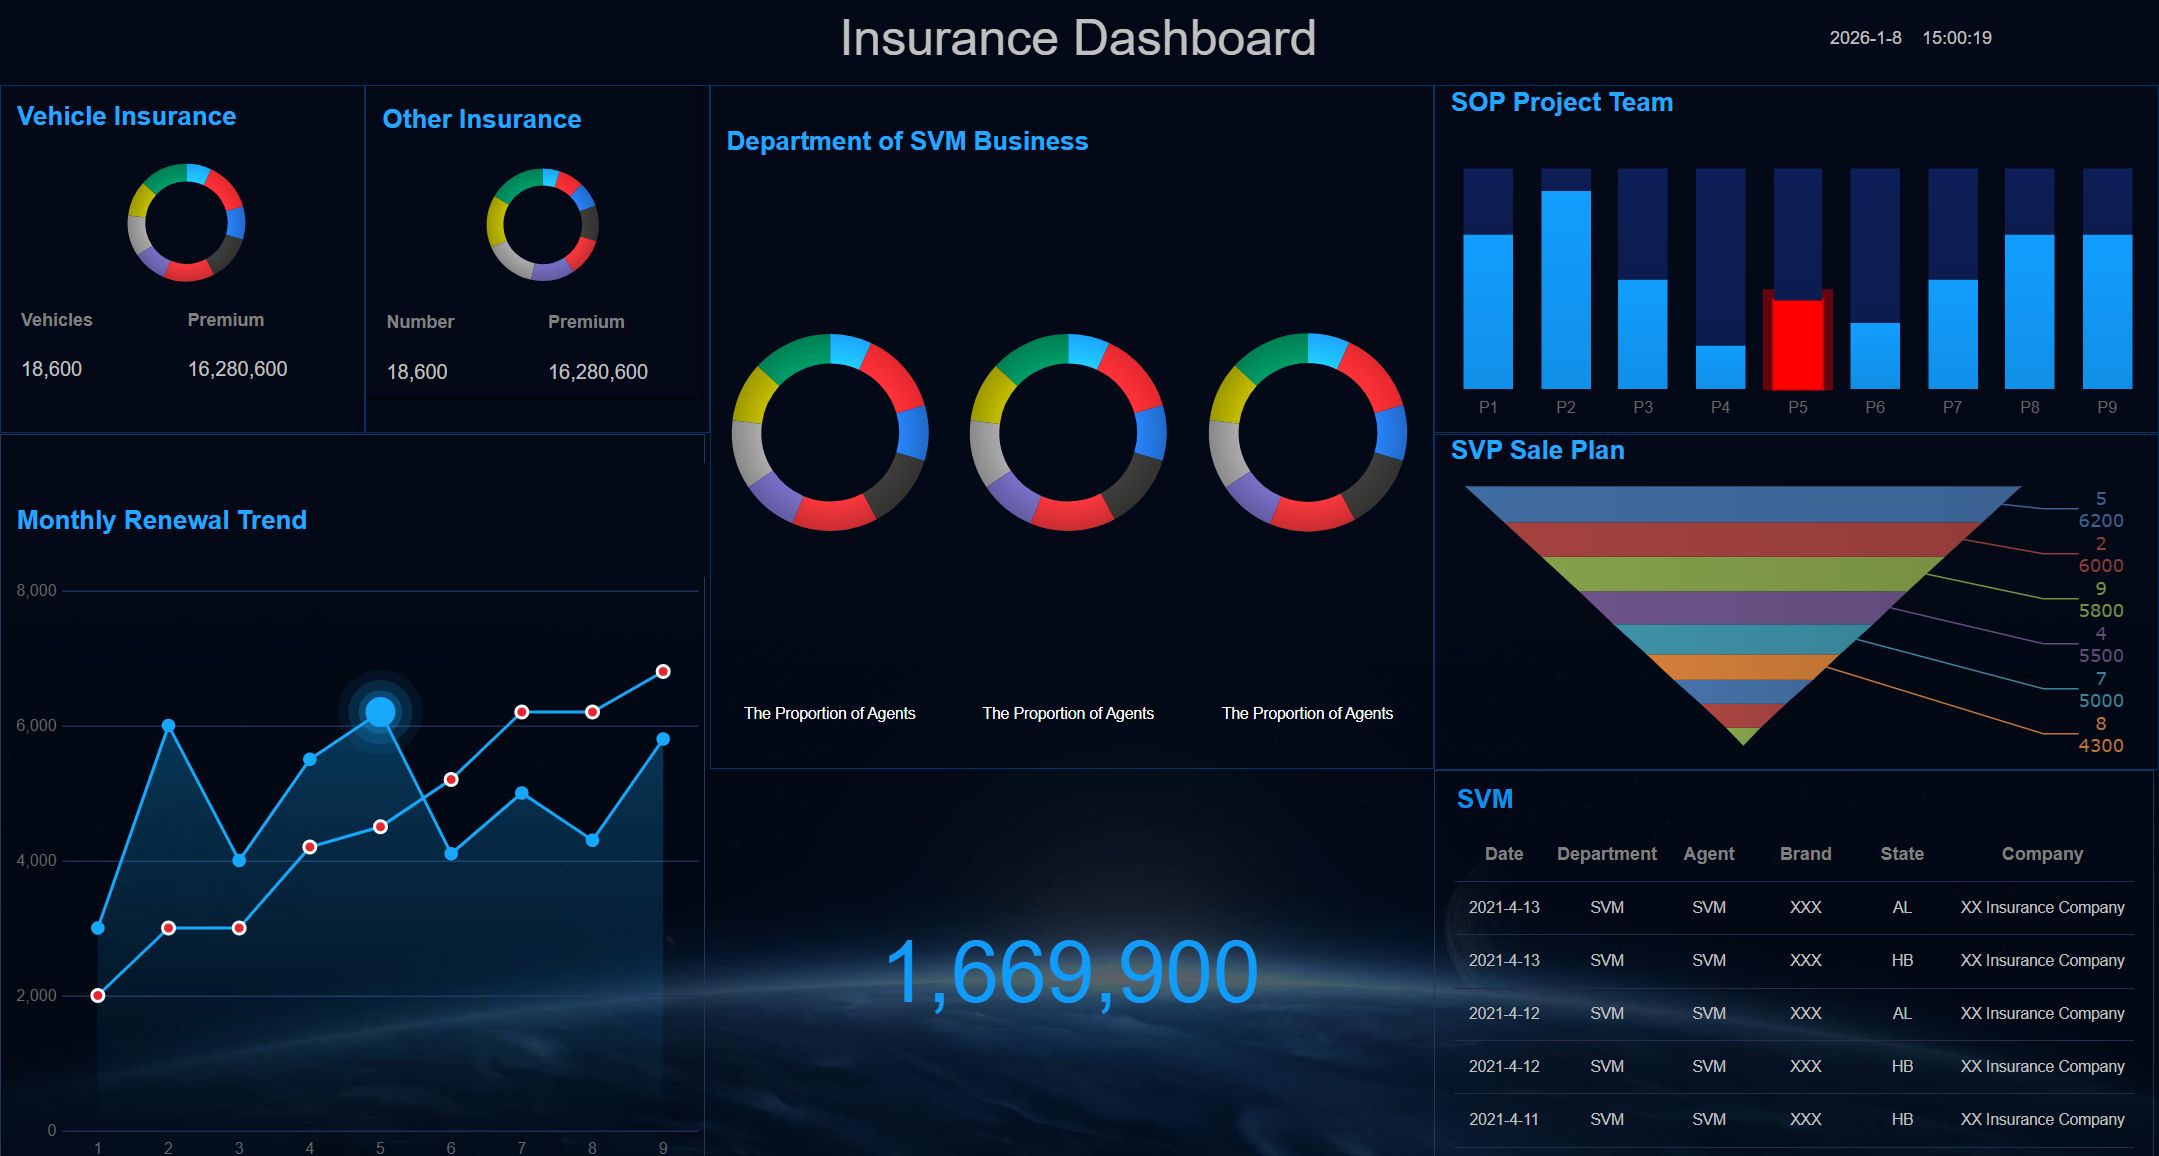
Use visuals and formatting to improve clarity
Charts, tables, and callouts should simplify understanding, not decorate the page. Use visuals only when they make comparison, trend recognition, or prioritization easier.
Best practices include:
Use line charts for trends over time
Use bar charts for category comparisons
Use variance tables for target versus actual analysis
The final stage is quality control. This is where experienced teams protect credibility. A report with a strong message but weak validation can create confusion, trigger unnecessary debate, and undermine trust.
Check accuracy and consistency
Before sending the report, validate both the numbers and the narrative.
A practical checklist helps reduce errors, especially when multiple teams contribute data.
Edit for clarity and brevity
Fast reports are not just built quickly. They are also read quickly. That means editing aggressively.
Remove:
Repeated explanations
Internal jargon
Dense paragraphs
Low-value details
Commentary that does not support a decision
Rewrite for:
Clear conclusions
Short action-oriented statements
Direct language
Specific recommendations
Finish with actions and follow-up
A management report should not end with observation alone. It should end with ownership.
Include:
Action items
Responsible owners
Due dates
Required decisions
Items to monitor next cycle
This makes the report operational, not just informative.
4 Best Practices to Create a Management Report Faster
If your team needs a repeatable process, these are the most effective practical steps.
1. Start with a reporting template, not a blank page
Use a standardized structure for recurring management reports. This reduces formatting time, improves consistency, and helps leaders know where to find information.
A good template should already include:
Executive summary
KPI section
Variance analysis
Risk section
Actions and owners
2. Automate data collection wherever possible
Manual copying from spreadsheets and systems is slow and error-prone. Connect source systems directly to reporting tools so updates flow automatically.
This is especially important when reports combine data from:
Finance systems
CRM platforms
ERP tools
Excel files
Department databases
3. Define KPI ownership across teams
Every number in the report should have an owner. That person is responsible for validating the metric, explaining major changes, and confirming business context.
This reduces last-minute confusion and improves accountability.
4. Build commentary around exceptions, not every metric
Do not write long explanations for stable performance. Focus commentary on:
Significant variances
Missed targets
Trend reversals
High-risk issues
Recommended interventions
This keeps the report concise and useful.
Build Faster, Smarter Management Reports With FineReport
Building a management report manually is possible, but scaling it across departments, periods, and stakeholders is complex. Data has to be collected from multiple systems, cleaned, matched, visualized, reviewed, and reformatted every cycle. That is exactly why so many organizations struggle with reporting delays and inconsistent insights.
FineReport makes this process much faster and more reliable. Instead of stitching together spreadsheets and static slides, teams can use ready-made templates, automated data integration, dashboard components, and scheduled distribution to standardize the entire workflow.
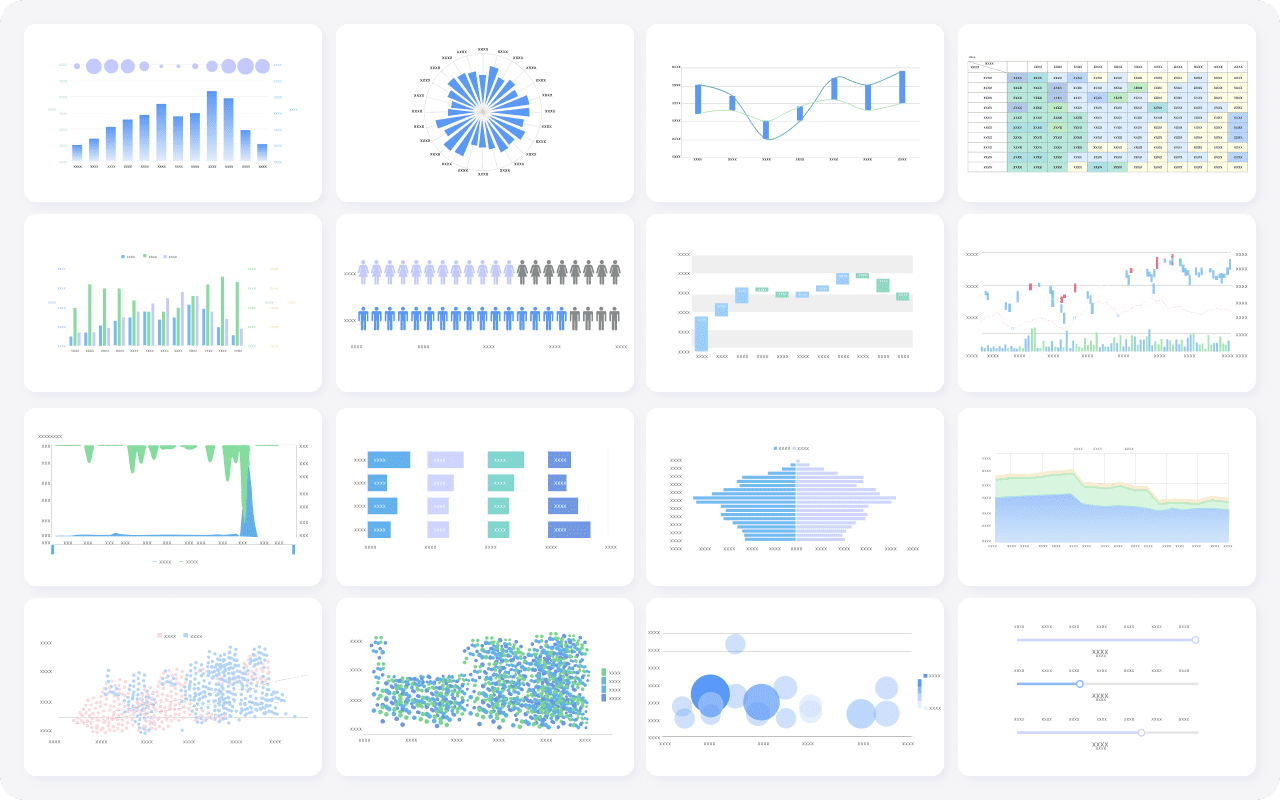
Get Ready-to-Use Dashboard Templates in Fine Gallery
Improve trust with governed, consistent data outputs
For organizations that need faster reporting cycles, better executive visibility, and less manual effort, FineReport is a practical solution. It helps transform management reporting from a repetitive task into a scalable decision-support system.
A management report should include its purpose, the target audience, a clear reporting scope, core KPIs, key insights, risks, and recommended actions. The goal is to help decision-makers understand performance quickly and act with confidence.
Start by defining the report objective, audience, and reporting period before collecting data. Then use only relevant sources, clean the data early, and organize it into clear categories such as performance, budget, risks, and next steps.
Common management report KPIs include revenue or output, budget variance, target achievement, trend direction, operational efficiency, risk status, forecast accuracy, and action completion. The best mix depends on the decision the report is meant to support.
Reporting usually slows down when teams collect too much data, work with inconsistent sources, or let the scope expand midway. Unclear goals and poor data preparation also lead to rework and last-minute fixes.
First, remove duplicates, fix missing values, standardize names, and align dates across sources. After that, group the data into reporting sections that match business priorities so the final report is easier to analyze and present.
Product Trial
FineReport
Pixel-perfect reports · Interactive dashboards · Easy data entry · Digital twins