A project tracking dashboard gives you a real-time, visual overview of your project’s progress, timelines, team tasks, and resource allocation. You use a project tracking dashboard to centralize all project information, making it easy to monitor updates, spot issues, and keep everyone aligned. This tool helps you manage multiple projects efficiently and improves transparency across your team.
When you lack a project tracking dashboard, you face several common challenges. The table below shows these issues:
| Challenge | Description |
|---|---|
| Scattered project data | Information is spread across multiple tools, making it hard to get a cohesive view of progress. |
| Lack of real-time reporting | Teams struggle to get timely insights without manual reporting, leading to delays in decision-making. |
| Integration challenges | Managing tasks across different platforms creates information silos, complicating project management. |
| Notification overload | Cluttered communication channels can cause important updates to be overlooked. |
| User adoption issues | Resistance to change from familiar tools can hinder the effective use of new project management tools. |
To create a project tracking dashboard step by step, you need to choose a reliable tool and follow a clear process. FineReport lets you build a dashboard that collects data from different sources, displays key metrics, and supports real-time monitoring. By following a structured approach, you ensure your project tracking dashboard delivers accurate insights and supports your goals as a professional or team leader.
You need to start every project tracking dashboard by defining clear objectives. Objectives guide your team and set the direction for your project. When you set objectives, focus on making them specific, measurable, attainable, relevant, and time-bound. These criteria help you create goals that drive progress and keep everyone aligned.
| Criteria | Description |
|---|---|
| Specific | Goals should be clear and specific to guide focus. |
| Measurable | Progress should be quantifiable to track success. |
| Attainable | Goals must be realistic and achievable. |
| Relevant | Goals should align with broader business objectives. |
| Time-bound | Goals need a clear deadline for completion. |
Best practices for defining objectives include making your dashboard easy to scan, using visuals like pie charts and bar charts, assigning ownership to milestones, and updating the dashboard regularly. Avoid adding too many details to prevent information overload.
Once you set objectives, you need to choose the right metrics for your dashboard tools. Metrics should reflect your project’s goals and help you measure progress. Common metrics in project management dashboards include net profit margin, cost variance, schedule variance, and resource utilization. You can also track estimated versus actual time, budget spend, and profit.
A well-structured dashboard links project data to daily decisions. When you select metrics, define the outcome you want to show, ask questions that reveal if you reached that outcome, and choose measures that answer those questions. Start by understanding your project’s scope, timeline, and expected results. This approach ensures your dashboard tools support your objectives.
You must align your dashboard with stakeholder needs to ensure its effectiveness. Meet with stakeholders to learn which metrics matter most to them. Use stakeholder mapping to visualize their priorities and influence. Gather feedback through surveys and interviews to improve navigation and data accuracy.
Engaging stakeholders in the dashboard-building process helps you design a tool that supports their goals. Continuous feedback ensures your dashboard remains relevant and useful throughout the project lifecycle.
Selecting the right project tracking dashboard tool is a critical step in building an effective project management dashboard. You want a solution that not only visualizes your project’s progress but also adapts to your workflow and scales with your needs.
Many teams rely on project tracking dashboard tools to centralize information and drive project success. In 2024, some of the most widely used options include:
When you compare these tools, consider what your project management dashboard must deliver. Look for features such as project planning, task management, communication, resource management, time and budget tracking, workflow automation, and robust dashboard visualization. Each tool offers a unique approach to building a project tracking dashboard, so align your choice with your team’s priorities.
FineReport stands out as a powerful project management dashboard solution for professionals who need more than basic tracking. You can use its drag-and-drop designer to create a project tracking dashboard tailored to your needs. FineReport supports multi-source data integration, allowing you to consolidate information from databases, spreadsheets, and cloud services into a single dashboard.
Real-world organizations have achieved significant results with FineReport. For example, the Abu Dhabi Projects and Infrastructure Centre (ADPIC) implemented a CXO dashboard using FineReport to enhance oversight and strategic planning. In manufacturing, companies use FineReport dashboards to monitor quality control, track defect rates, and optimize production processes. These examples show how a project management dashboard can transform decision-making and operational efficiency.
| Use Case | FineReport Application |
|---|---|
| Government Projects | CXO dashboard for real-time oversight and planning |
| Manufacturing | Quality control dashboard for defect and scrap monitoring |
A scalable project tracking dashboard must handle growing data and evolving business needs. FineReport excels in this area by integrating multiple data sources, which allows you to build a comprehensive project management dashboard. When you consolidate scattered data into one dashboard, you enable real-time reporting and informed decision-making. This integration supports both horizontal and vertical scaling, so your dashboard grows with your organization.
As your projects expand, the ability to manage different data formats and complexities becomes essential. FineReport’s flexible architecture ensures your project management dashboard remains efficient and reliable, no matter how your requirements change.
A successful project tracking dashboard relies on well-organized and accurate data. You need to follow a clear process to gather, structure, and validate your project information before building your dashboard.
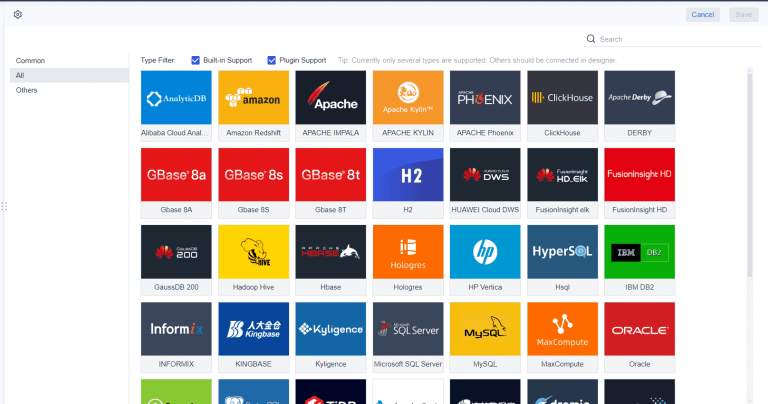
Start by identifying all the data sources that feed into your project tracking dashboard. These sources may include spreadsheets, databases, cloud services, and project management platforms. You should:
By collecting comprehensive and relevant data, you lay the foundation for a reliable dashboard.
Organizing your data for dashboard use improves performance and clarity. You can use several techniques to optimize your project tracking dashboard:
| Technique | Description |
|---|---|
| Data Curation | Select only relevant data to improve loading times and responsiveness. |
| Data Aggregation | Move data from sources to a central location for easier access. |
| Data Summarization | Reduce data into smaller, digestible chunks to enhance performance. |
| Data Normalization | Ensure consistent schema and formats for streamlined retrieval. |
| Indexing | Speed up data retrieval, especially in queried fields. |
| Query Optimization | Minimize resource consumption during data retrieval. |
| Caching Mechanisms | Store frequently accessed data for fast retrieval. |
Use these methods to ensure your dashboard loads quickly and displays information clearly.
Accurate data makes your project tracking dashboard trustworthy and actionable. You should:
Reliable data enables proactive issue identification, enhances decision-making, and improves project transparency. Stakeholders gain clear visibility into project progress, which fosters trust and alignment. When you prioritize data accuracy, your project tracking dashboard becomes a powerful tool for managing projects effectively.
Designing a project tracking dashboard requires careful attention to layout, features, and accessibility. You want your dashboard to provide clear insights, support collaboration, and deliver information wherever you need it. This section guides you through the essential elements that make a project tracking dashboard effective for your team.
A well-structured project tracking dashboard helps you understand project status at a glance. You should avoid overcrowding the dashboard with too much information, which can lead to confusion. At the same time, undercrowding leaves your dashboard sparse and less useful. The five-second rule suggests placing critical information in prominent positions with clear labels, so you can find what you need quickly. Position the most important data above the fold, at the top of the dashboard, to guide users logically.
| Principle | Description |
|---|---|
| Overcrowding | Avoid cramming too much information into the dashboard to prevent clutter and confusion. |
| Undercrowding | Ensure enough content is present to provide valuable insights without appearing sparse. |
| Five-second rule | Place critical information prominently and use clear labels for quick readability. |
| Above the fold | Position the most important data at the top for immediate visibility, guiding users logically. |
You can use dashboard templates to maintain consistency and clarity. Templates help you organize data, select the right visualizations, and ensure that each dashboard follows best practices. When you design your project tracking dashboard, choose layouts that highlight key metrics and make navigation easy.
FineReport offers a range of layout options for project tracking dashboards. You can select from 3D card animations, bullet maps, flow charts, water polo maps, mini maps, and standard bar or pie charts. These options allow you to present data in ways that suit your project’s needs and audience.
| Layout Option | Description |
|---|---|
| 3D Card Animation | Provides a soft native graphics experience with cool animations and switching effects. |
| Bullet Map | A visualization that replaces traditional odometers, representing data in a circular format. |
| Flow Chart | Used to describe behavior patterns in management, including various types of flowcharts. |
| Water Polo Map | A chart for presenting single percentage data with a clear interface and rich style options. |
| Mini Map | Supports bar, line, and area charts for compact data representation. |
| Bar and Pie Charts | Commonly used for size comparison and part-to-whole relationships, respectively. |

Your project tracking dashboard should include features that support real-time decision-making and team alignment. Project managers often request unified project visibility, role-specific insights, automated reporting, integrated workflows, and AI-powered foresight. These features help you monitor project health, customize dashboards for different stakeholders, and receive real-time updates without manual input.
| Feature | Description |
|---|---|
| Unified project visibility | Integrates data from various tools into a single real-time view for comprehensive project health. |
| Role-specific insights | Customizes dashboards for different stakeholders to display relevant information. |
| Automated reporting | Provides real-time updates without manual input, enhancing efficiency. |
| Integrated workflows | Connects dashboards directly to live workflows, reducing maintenance needs. |
| AI-powered foresight | Uses predictive analytics to identify risks and issues before they arise. |
Dashboard templates make it easier to implement these features. You can use templates to set up automated reporting, customize views for different roles, and integrate workflows. Custom views allow you to personalize your dashboard by selecting which widgets to display and applying filters. This flexibility helps you focus on the most relevant information for your role.
Collaboration features in your project tracking dashboard enable teams to share insights and work together. Interactive dashboards promote a culture of data-driven decision-making. When you use collaborative dashboards, you enhance engagement and understanding of metrics across departments. Sharing dashboards with stakeholders ensures everyone stays informed and aligned.
Mobile accessibility plays a vital role in user engagement with project tracking dashboards. Responsive design ensures you can access your dashboard on any device, including smartphones and tablets. Touch-friendly elements and real-time updates improve user interaction and make it easier to stay informed. A well-designed mobile dashboard provides timely and relevant information, which supports effective decision-making.
FineReport excels in mobile dashboard design. You can create dashboards that adapt to any screen size, ensuring stakeholders can access project data wherever they are. FineReport’s dashboard templates support mobile layouts, making it easy to build dashboards that work on both desktop and mobile devices.
3D dashboards add another layer of insight to your project tracking dashboard. FineReport’s 3D visualization options allow you to present complex data in an engaging format. You can use 3D dashboards to monitor production lines, track equipment status, and visualize trends in real time. These dashboards provide immediate insights, enhance accountability, and streamline collaboration.
| Advantage | Description |
|---|---|
| Real-time data access | Dashboards provide immediate insights, enabling quick decision-making when challenges or opportunities arise. |
| Enhanced accountability | Visualizing tasks and metrics fosters accountability, helping team members track their responsibilities. |
| Streamlined collaboration | A unified platform reduces redundancy and misunderstandings, allowing all stakeholders to access crucial data easily. |
| Mobile accessibility | Dashboards should be user-friendly on mobile devices, ensuring stakeholders can access information on the go. |
Manufacturing companies use FineReport’s project tracking dashboard to monitor quality control, track defect rates, and optimize production processes. For example, dashboards display qualification rates, defect trends, and scrap rates, helping teams identify issues and improve efficiency. In government projects, organizations like ADPIC use FineReport dashboards to provide CXO-level oversight and strategic planning. These use cases show how dashboard templates and advanced features support better project outcomes.
When you design your project tracking dashboard, focus on clarity, essential features, and accessibility. Use dashboard templates to streamline the process and ensure consistency. FineReport provides the tools and flexibility you need to build dashboards that drive project success.
You need to test your project tracking dashboard to ensure it meets user needs and supports project progress. Start by selecting usability testing methods that reveal how users interact with your dashboard. Common approaches include paper and pencil tests, think aloud sessions, codiscovery, field observation, query techniques, questionnaires, and card sorting. You can also use A/B testing to compare dashboard designs, interaction tracking with heatmaps, and accessibility checks to meet WCAG 2.1 standards.
| Usability Testing Method | Description |
|---|---|
| A/B Testing | Compare designs to find what works best. |
| Interaction Tracking | Use heatmaps and session recordings to spot user pain points. |
| Accessibility Checks | Ensure dashboards meet WCAG 2.1 standards for inclusivity. |
During testing, you may encounter challenges such as ease of navigation, interpretability of results, accuracy of data, and clarity of dashboard intent.
| Challenge | Description |
|---|---|
| Ease of Navigation | Users found it difficult to navigate through the dashboard effectively. |
| Interpretability of Results | Participants struggled to understand the data presented in the dashboard. |
| Accuracy of Results | Concerns were raised regarding the reliability of the data shown. |
| Perceived Intent of Dashboard | Users were unclear about the purpose and goals of the dashboard. |
Address these issues by refining your dashboard layout and improving data presentation.
You should train your team to use the project tracking dashboard effectively. Provide clear instructions and hands-on practice to help users understand dashboard features and interpret project report data. Encourage team members to share insights and feedback. Sharing dashboards with stakeholders ensures everyone stays informed about project progress and can make timely decisions. Use collaborative features to promote transparency and foster a data-driven culture.
You must optimize your project tracking dashboard regularly to maintain relevance and effectiveness. Establish a system for collecting and analyzing feedback. Empower your team to share suggestions and make feedback review part of your strategic planning process. Dashboards provide regular feedback on performance and keep teams engaged and focused on growth.
Organizations that review their strategy quarterly—or even monthly—are far more agile and effective than those that only revisit it annually.
Leverage dashboard data to measure impact and support informed decision-making. Focus on key metrics that align with your goals. Schedule regular reviews to adapt your dashboard to changing circumstances. Foster a culture of continuous improvement to keep your team proactive and your dashboard aligned with project needs.
You can build a project tracking dashboard by setting clear goals, choosing the right tool, organizing your data, designing for clarity, and testing for usability. A project management dashboard helps you improve communication, manage resources, and increase accountability. FineReport gives you flexible options for dashboard creation and real-time insights. The table below shows how dashboards contribute to better project outcomes.
| Benefit | Explanation |
|---|---|
| Improved Communication | Centralizes project details, keeping everyone informed. |
| Efficient Resource Management | Displays resource use for effective allocation. |
| Enhanced Risk Management | Highlights issues for proactive planning. |
| Increased Accountability | Tracks progress and tasks to foster responsibility. |
| Time and Cost Savings | Streamlines processes, reducing delays and mistakes. |
Start building your dashboard today to drive project success.

Best Dashboard Apps for Business Insights
What is a Call Center Dashboard and Why Does It Matter
What is a Reporting Dashboard and How Does it Work
What is An Interactive Dashboard and How Does It Work
What is a Call Center Metrics Dashboard and How Does It Work

The Author
Lewis
Senior Data Analyst at FanRuan
Related Articles

Payment Analytics Dashboard: 12 KPIs Every Operations Leader Should Track to Cut Revenue Leakage
Losing revenue to declines? Discover 12 essential KPIs to track in your payment analytics dashboard to stop leakage and manage disputes.
Lewis Chou
May 05, 2026

SOC Dashboard Explained: 12 Essential KPIs, Views, and Workflows Security Teams Use
Learn about SOC dashboards, the 12 essential KPIs for security teams, and how they centralize alerts and workflows for faster threat detection and response.
Lewis Chou
May 05, 2026

EMR Dashboard Guide: 12 Metrics to Track for Faster Clinical and Operational Decisions
Learn the 12 essential EMR dashboard metrics to track for faster clinical and operational decisions, improving patient flow and revenue cycle management.
Lewis Chou
May 05, 2026


