The MIS report full form is Management Information System report, and in business, it refers to a structured report that helps managers monitor performance, spot issues early, and make decisions faster. If you are running sales, inventory, HR, finance, or operations, an MIS report turns scattered business data into a usable management view. For operations directors, IT managers, and analysts, the value is simple: fewer blind spots, less manual consolidation, and more consistent decisions across teams.
All reports in this article are built with FineReport.
MIS Report Full Form and What It Means in Business
The full form of MIS is Management Information System. When people say MIS report, they usually mean a management report generated from that system to track business activity in a structured way.
In simple terms, an MIS report is a report that collects important business information, organizes it, and presents it in a format managers can review quickly. Instead of reading raw spreadsheets or pulling numbers from multiple tools, leaders use MIS reports to understand what is happening and what action is needed.
This is where many businesses get confused: an MIS report is not just raw data, not exactly the same as a dashboard, and not every business report qualifies as MIS reporting.
Here is the practical difference:
Raw data is unprocessed information, often too detailed to guide decisions on its own.
Dashboards are visual and often real-time, while MIS reports are usually structured for periodic review such as daily, weekly, or monthly.
General business reports may be one-off or informal, while MIS reports are standardized, repeatable, and designed for management control.
What Is an MIS Report Full Form?
Definition and core purpose
The MIS report full form stands for Management Information System report, which is a structured report used to monitor performance, support decision-making, and organize business data into a management-friendly format.
Its core purpose is to convert business activity into actionable insight. Managers do not need thousands of rows of transactions. They need a clear picture of what changed, what missed target, what improved, and what requires attention.
A good MIS report helps management answer questions like:
Are we meeting sales targets?
Which region or branch is underperforming?
Is inventory running below reorder level?
Are labor costs rising faster than output?
Is absenteeism affecting productivity?
Where do we need corrective action this week or this month?
In other words, MIS reports help managers move from data collection to decision support.
Why MIS reports matter
MIS reports matter because they improve visibility and control across the business. When management receives regular, structured reporting, it becomes easier to plan, coordinate, and respond.
Key business benefits include:
Better planning: Leaders can forecast demand, staffing, and budget needs.
Stronger control: Managers can compare targets against actual results.
Faster communication: Teams work from the same numbers and reporting logic.
Improved performance review: Department heads can assess outcomes consistently.
Higher accountability: Owners of each KPI become easier to identify.
Early issue detection: Missed targets, delays, and unusual patterns stand out sooner.
Regular reporting also reduces the risk of fragmented decision-making. When sales, finance, HR, and operations each use separate spreadsheets with different definitions, the business loses trust in its numbers. MIS reporting solves that by standardizing what gets measured and how it is reviewed.
Common Types of MIS Report Full Form
Daily, weekly, and monthly reports
MIS reports are often classified by reporting frequency. The right cadence depends on how quickly the business environment changes and how often managers need to act.
Daily MIS reports are used for fast-moving operations. These are common in retail, logistics, manufacturing, call centers, and distribution.
Examples include:
Daily sales summary
Daily attendance report
Daily stock movement report
Production output report
Delivery delay report
Weekly MIS reports help middle management review progress, exceptions, and short-term trends.
Examples include:
Weekly team performance report
Weekly collection report
Weekly shipment status report
Weekly inventory aging report
Monthly MIS reports are typically used for management review, budget control, and strategic tracking.
Examples include:
Monthly revenue report
Monthly branch performance report
Monthly payroll and overtime summary
Monthly profit and expense analysis
A daily report supports immediate action. A weekly report supports tactical adjustments. A monthly report supports broader management review.
Functional MIS reports by department
Different departments use different MIS reports because each function has its own goals and metrics.
Sales MIS reports
Track revenue, target achievement, conversion, product mix, and regional performance.
Finance MIS reports
Track profit, expenses, receivables, cash flow, budget variance, and margins.
HR MIS reports
Track attendance, overtime, headcount, attrition, hiring progress, and training compliance.
Operations MIS reports
Track productivity, downtime, delivery performance, output, and service levels.
Inventory MIS reports
Track stock on hand, stock-outs, reorder points, slow-moving inventory, and shrinkage.
This functional structure is what makes MIS reporting so useful in enterprise settings. Every department gets decision-ready reporting, but leadership can still roll those numbers up into a business-wide view.
Exception and summary reports
Not every manager needs the same level of detail. That is why MIS reporting often includes both exception reports and summary reports.
Exception reports highlight unusual conditions or deviations from expected performance. These reports are ideal when leaders need immediate attention on specific risks.
Examples:
Branches below target by more than 20%
Products below safety stock level
Employees with excessive overtime
Deliveries delayed beyond SLA
Expense categories exceeding budget limits
Summary reports give a top-level snapshot of performance. They are useful for senior leadership, monthly reviews, and board reporting.
Examples:
Revenue by region
Profit by department
Headcount and attrition summary
Monthly operations overview
Use a summary report when the objective is fast executive understanding. Use an exception report when the goal is intervention.
Real Examples of MIS Report Full Form in Business
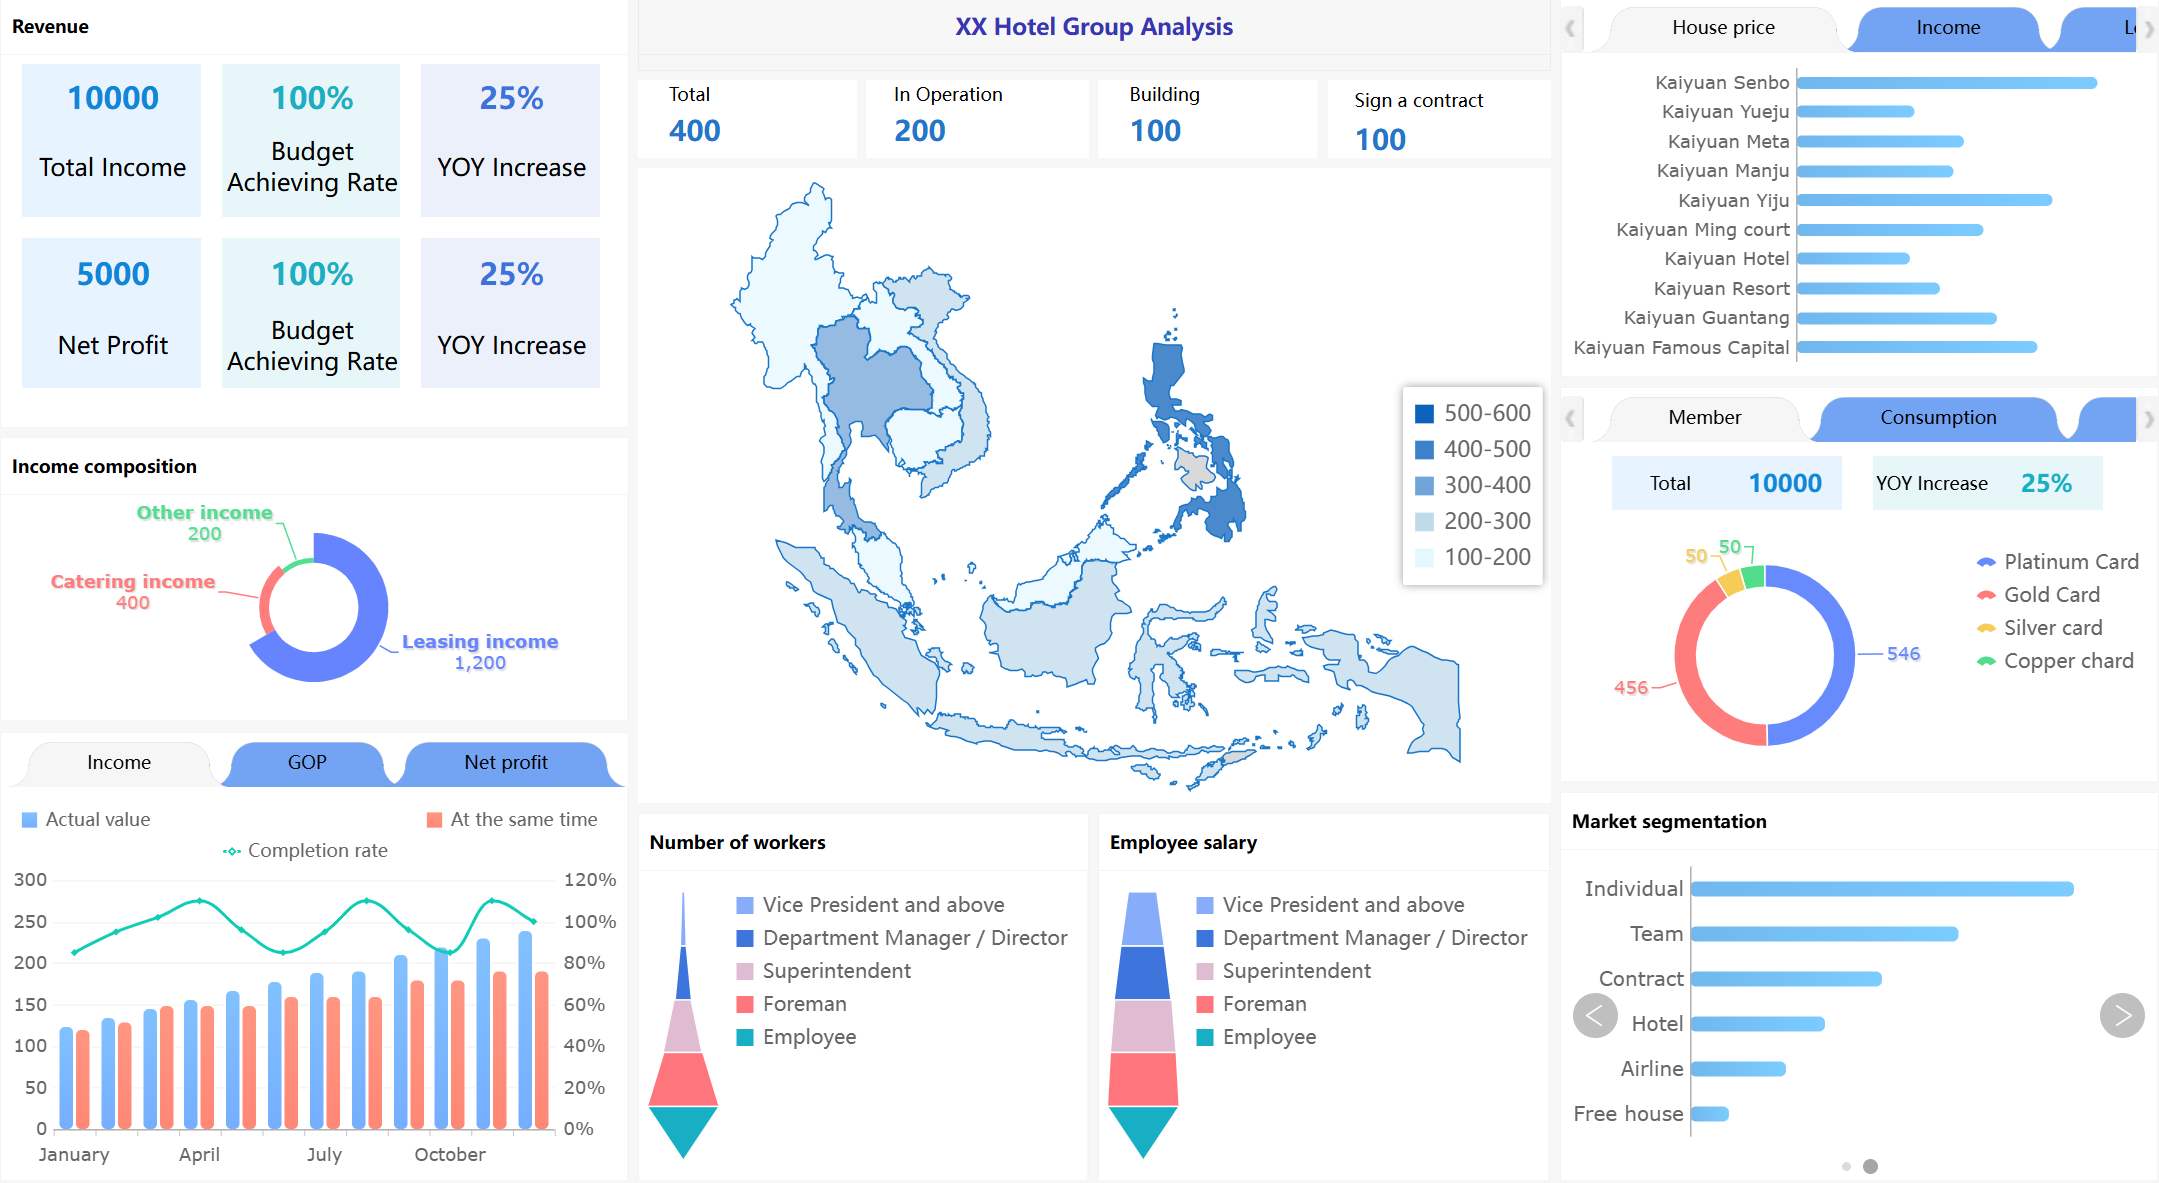
Sales and revenue reporting example
Imagine a regional sales director reviewing a monthly MIS report. The report compares target revenue versus actual revenue across products, sales teams, and geographies.
The report might include:
Monthly target revenue
Actual revenue achieved
Achievement percentage
Top-performing products
Low-performing regions
Gross margin by category
Sales trend over the last six months
A practical insight could be this: the company achieved 92% of total target, but one region delivered only 68% due to low conversion on a key product line. At the same time, another region exceeded target because of strong performance in high-margin products.
This tells management what happened, where it happened, and where corrective action or replication is needed.
Sales Target: Planned revenue goal for the reporting period.
Actual Revenue: Revenue generated in the same period.
Achievement Rate: Percentage of target achieved.
Average Order Value: Average revenue per transaction or order.
Product Contribution: Share of revenue by product or category.
Regional Performance: Revenue comparison across markets or branches.
Gross Margin: Profitability after direct costs.
Conversion Rate: Percentage of leads or opportunities converted into sales.
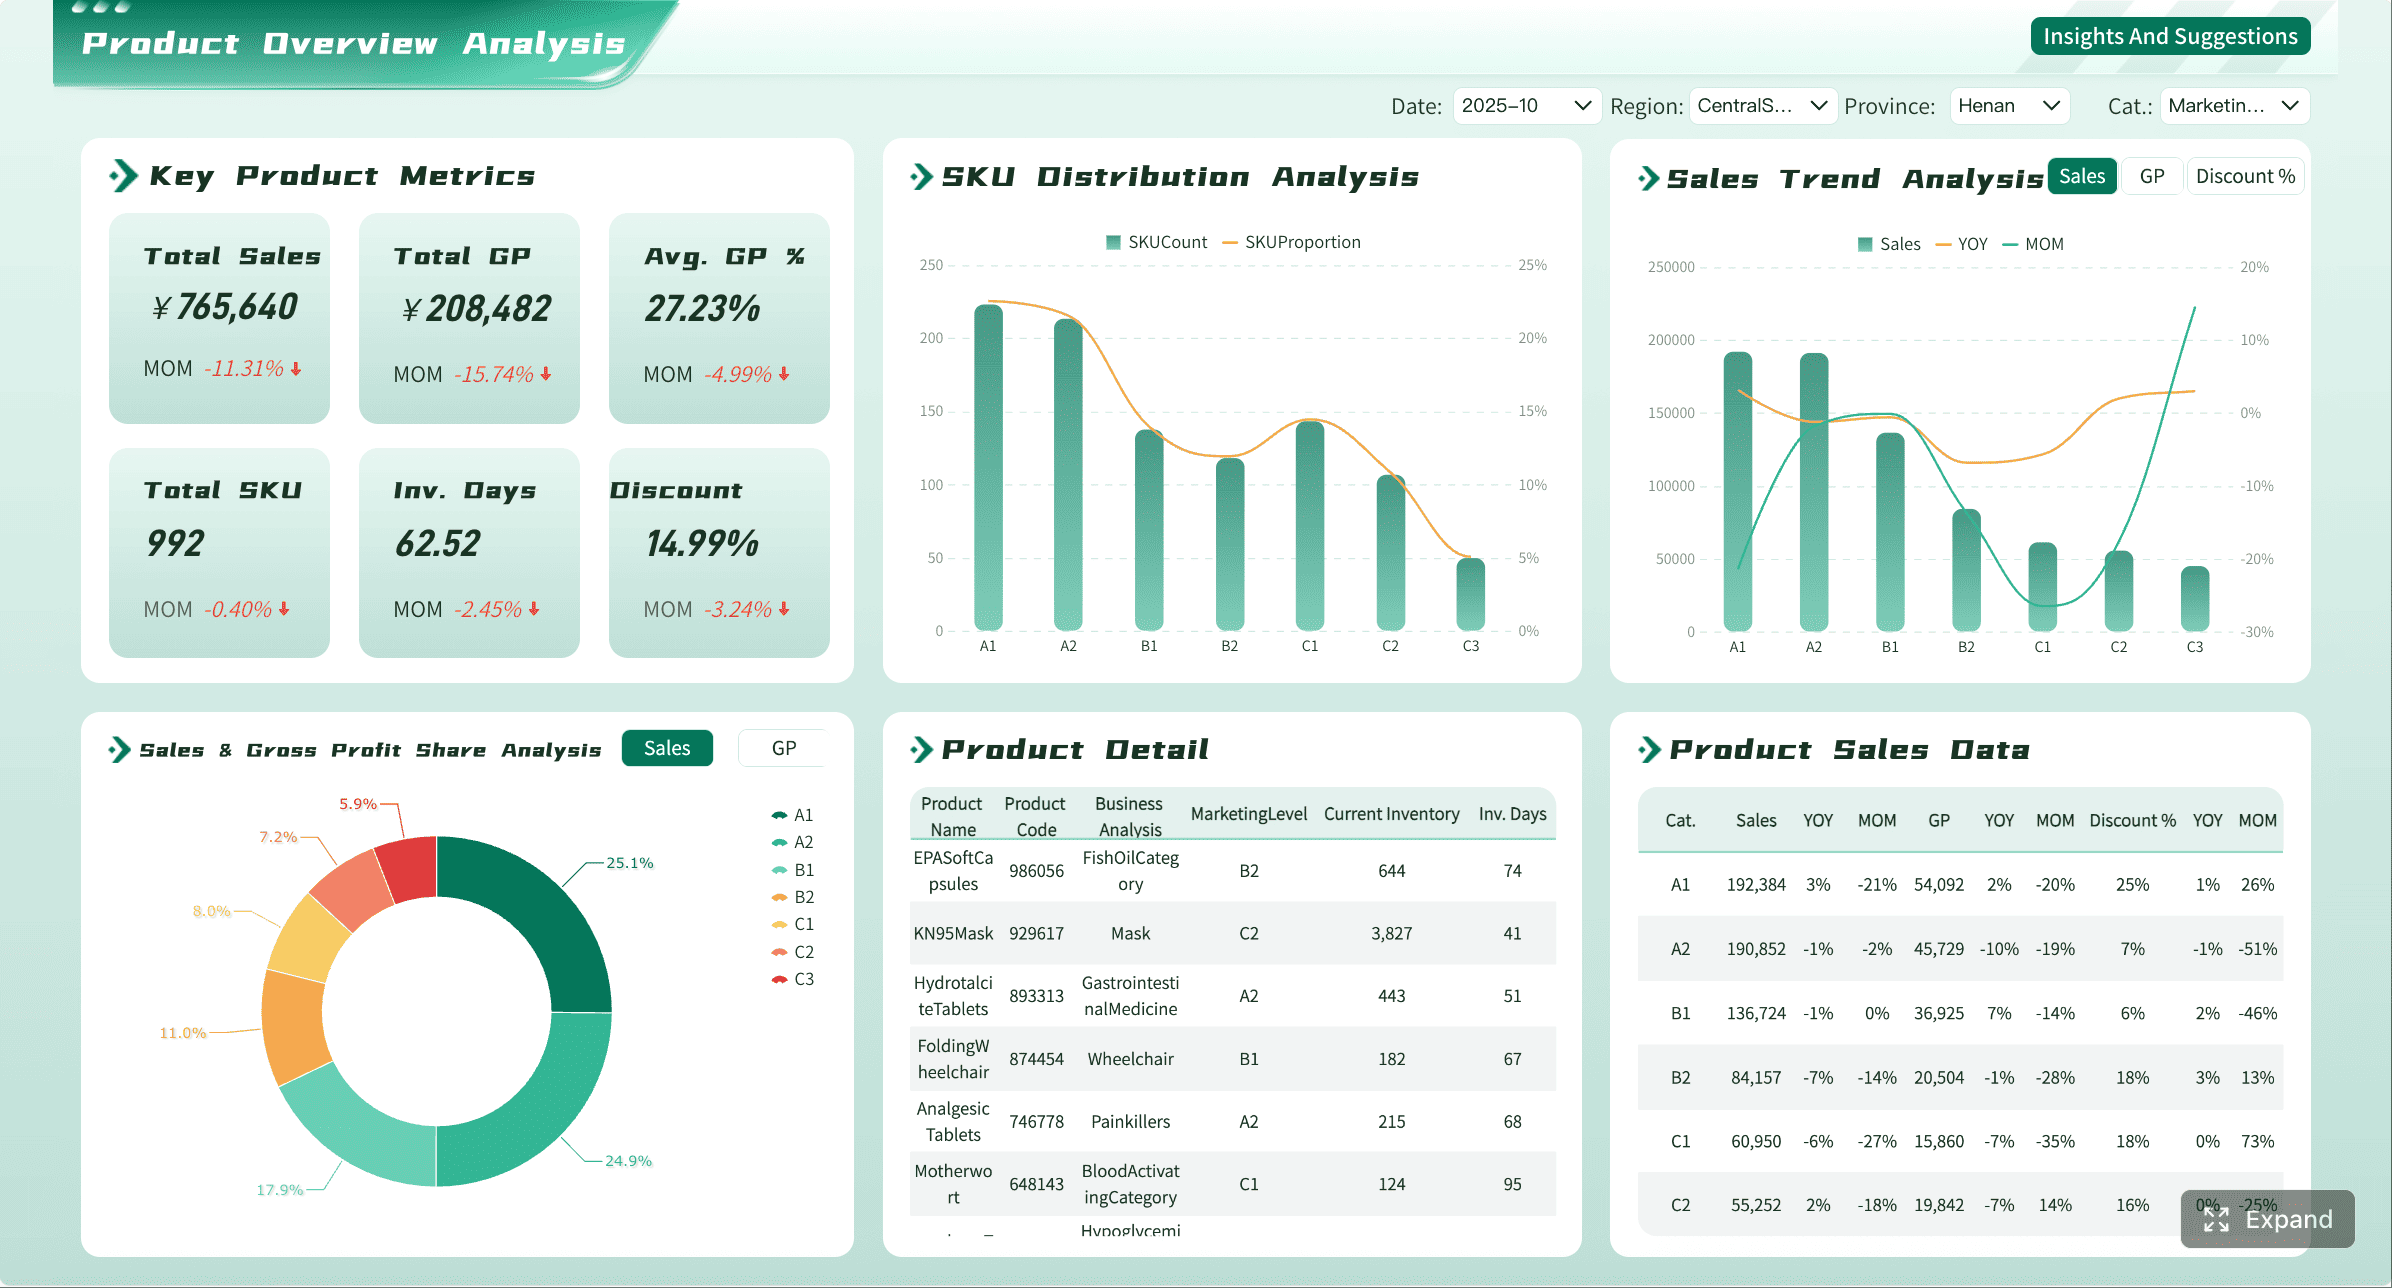
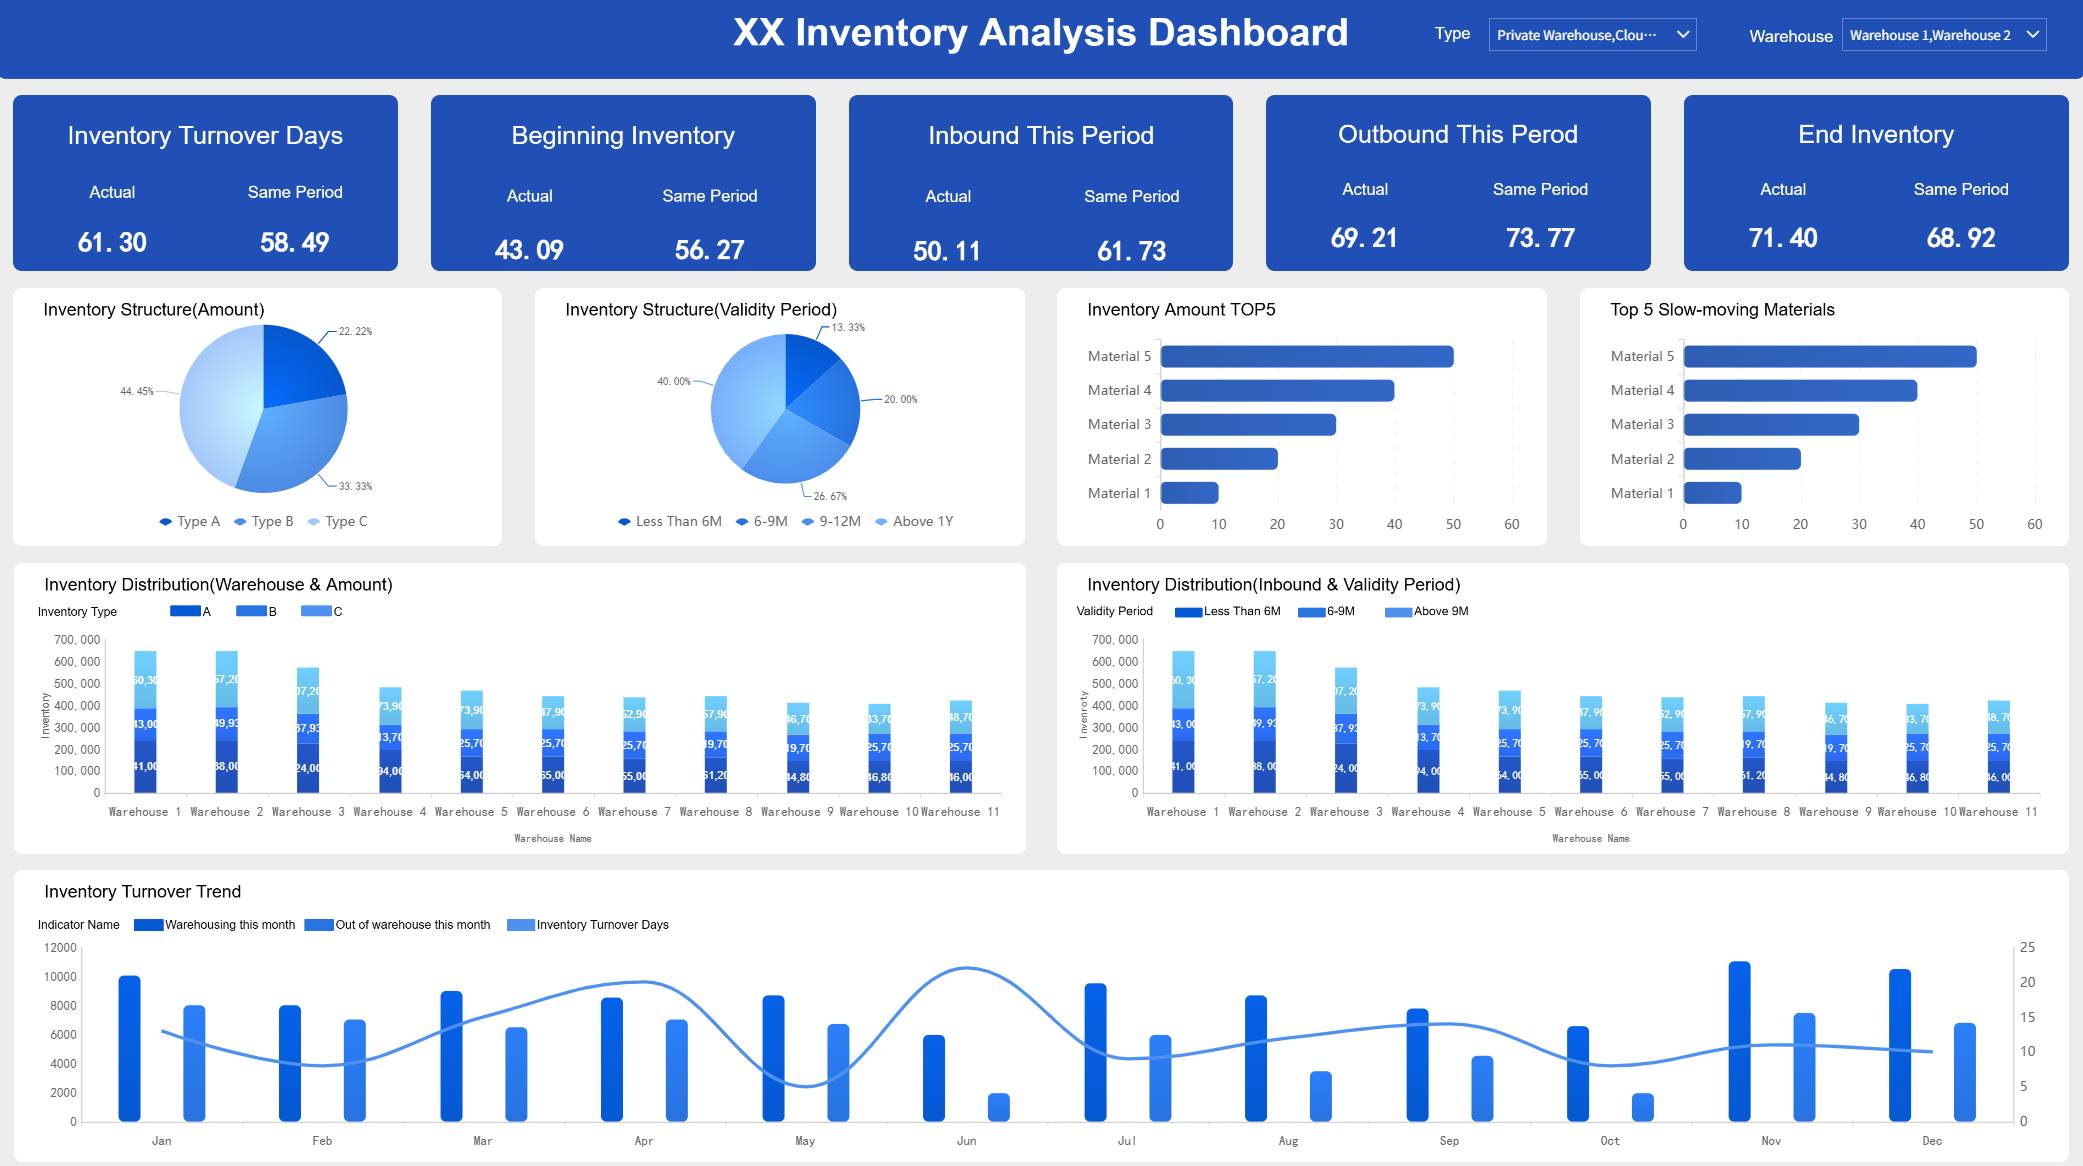
Inventory and operations reporting example
Now consider an operations manager in a manufacturing or distribution business. Their MIS report focuses on stock availability, production throughput, and delivery reliability.
This report may show:
Current stock by SKU
Minimum reorder level
Stock-out alerts
Slow-moving items
Supplier delivery delays
Production planned versus actual
Order fulfillment rate
A useful management scenario: stock levels for a high-demand item fall below the reorder point for three consecutive days, while supplier lead time has increased by 18%. The MIS report helps the team act before customer service levels drop.
Key Metrics (KPIs) for Inventory and Operations MIS
Stock on Hand: Current available inventory.
Reorder Point: Inventory threshold that triggers replenishment.
Stock-out Rate: Frequency of zero-stock situations.
Inventory Turnover: Speed at which inventory is sold or used.
Order Fulfillment Rate: Percentage of orders completed on time.
Production Output: Actual units produced in the period.
Downtime: Time lost due to machine or process interruptions.
Delivery Delay Rate: Share of shipments delivered late.
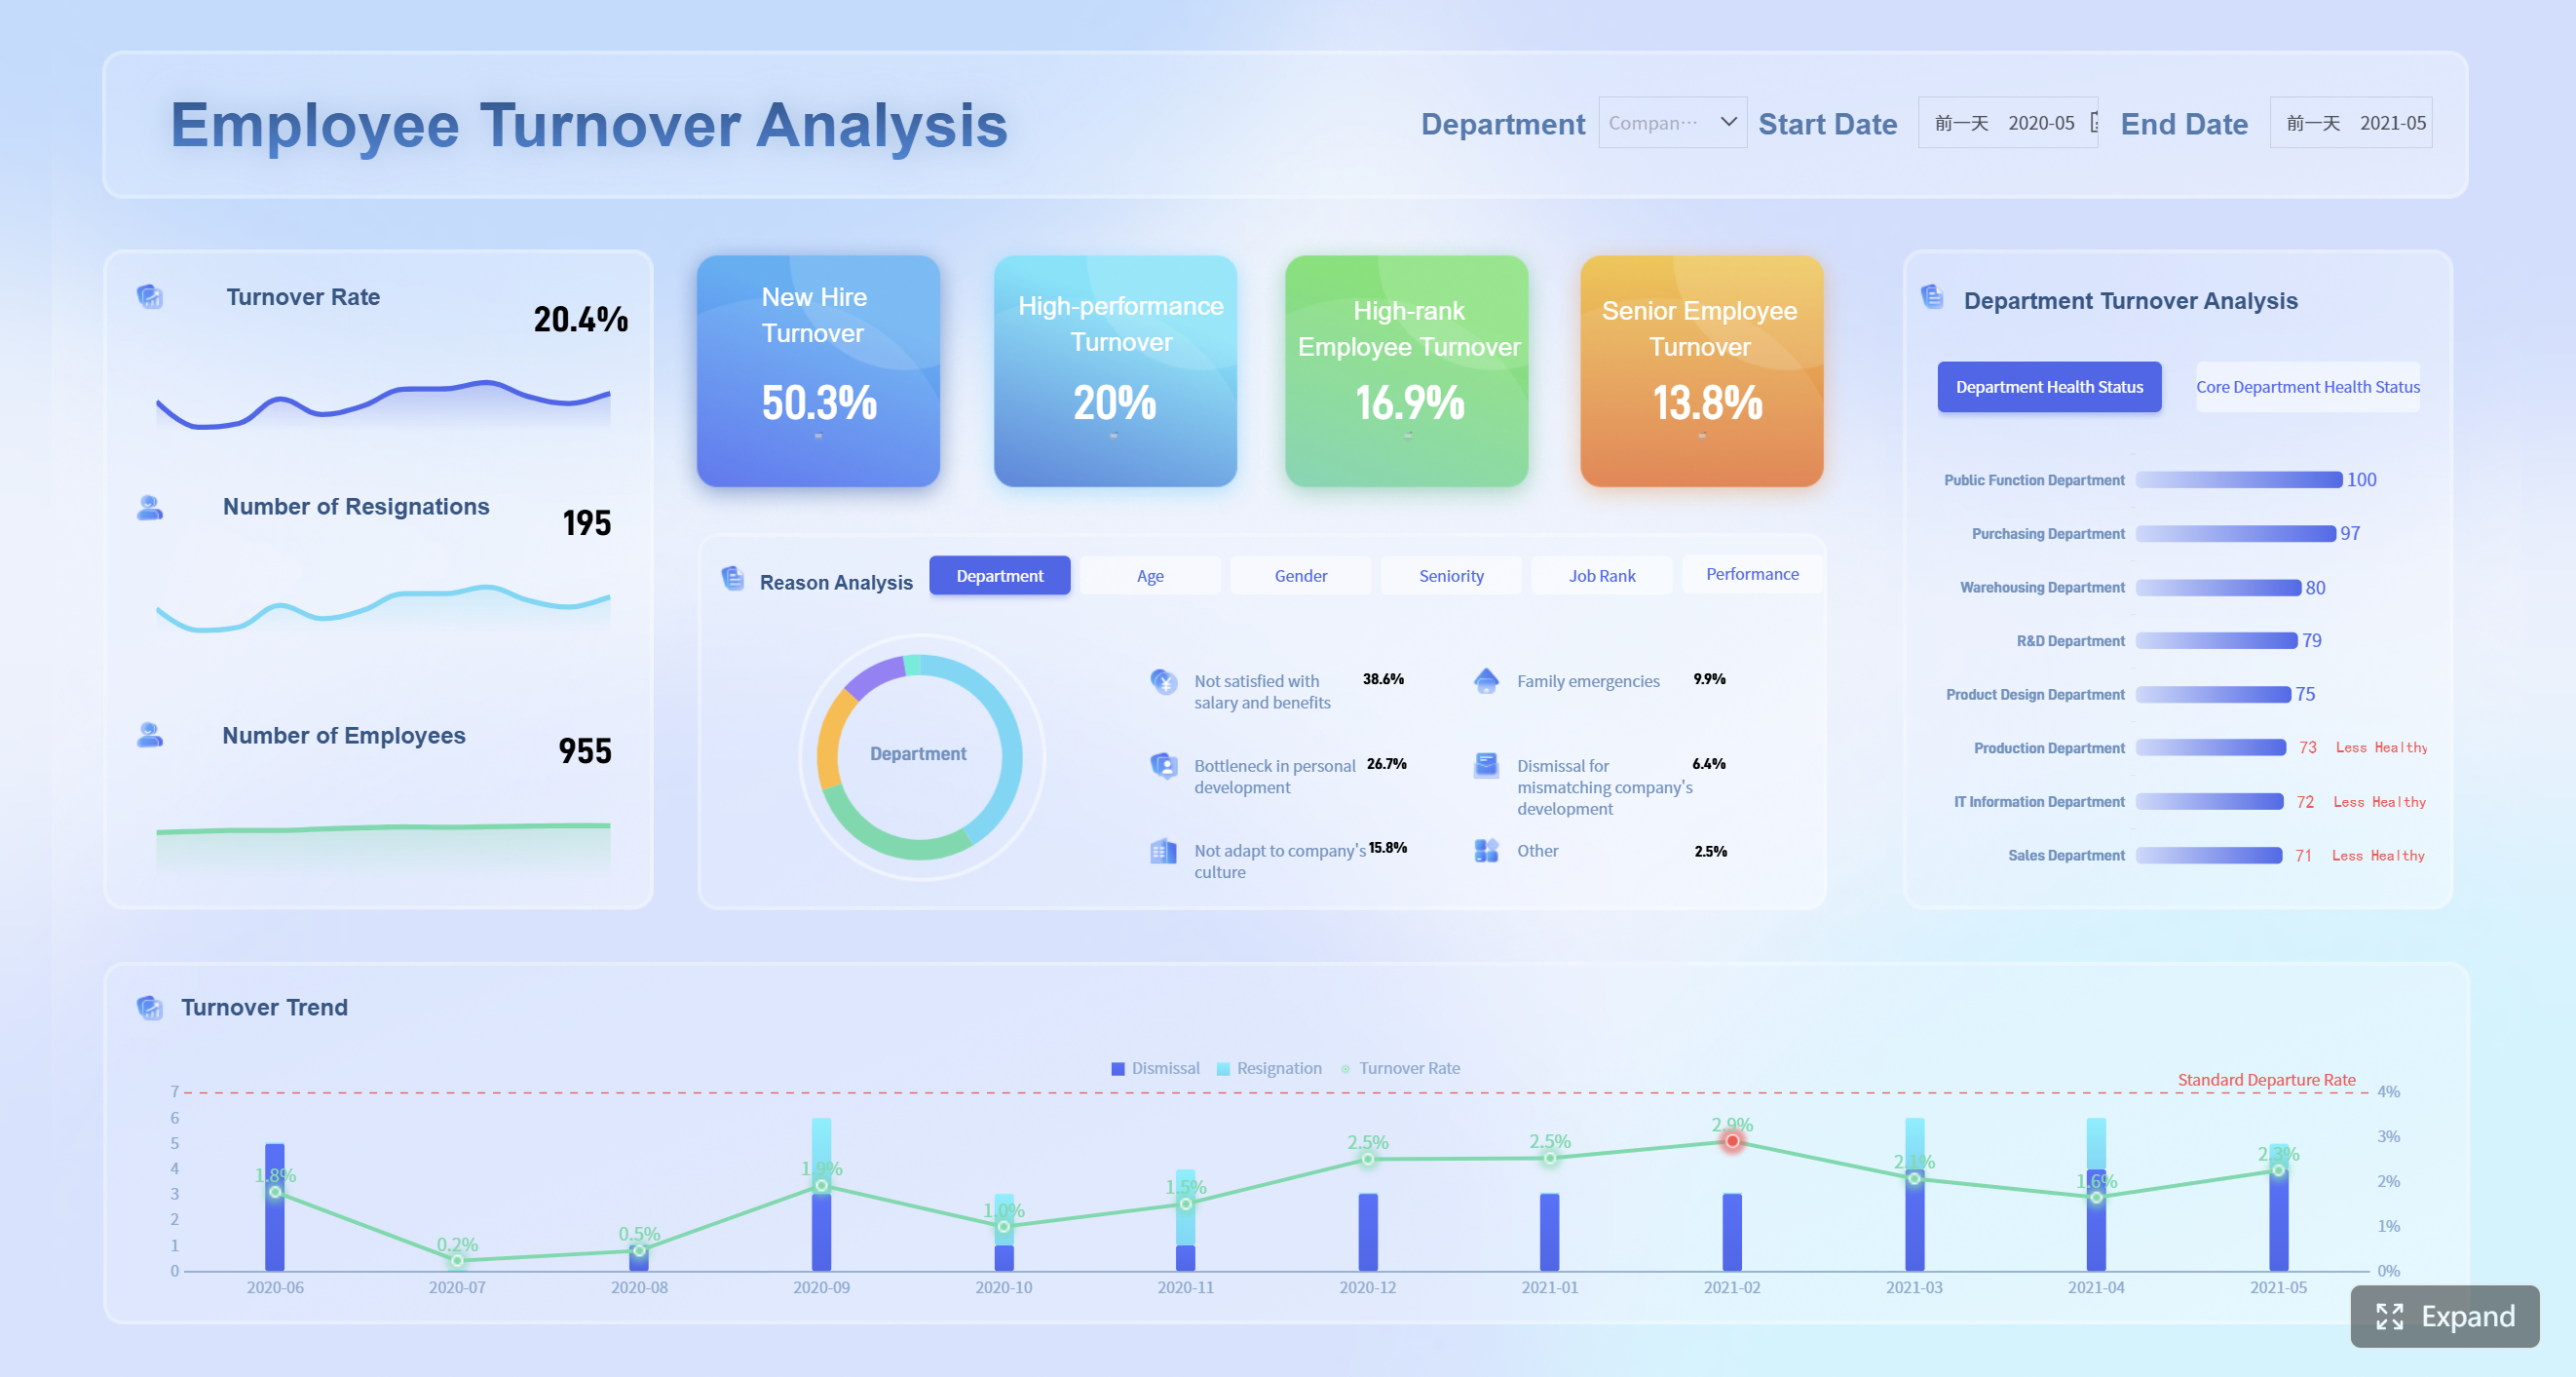
HR and compliance reporting example
In HR and regulated industries, MIS reporting is critical for workforce control and compliance tracking.
In a regulated environment such as healthcare, manufacturing, or transportation, the report might also track safety certifications, policy acknowledgments, or testing compliance deadlines.
A real business use case: a plant manager notices overtime rising in one shift while attendance declines and mandatory training completion remains below threshold. The MIS report surfaces a combined workforce and compliance risk that may affect output, safety, and audit readiness.
Key Metrics (KPIs) for HR and Compliance MIS
Attendance Rate: Percentage of scheduled attendance achieved.
Absenteeism Rate: Share of missed work time.
Overtime Hours: Extra hours worked beyond standard schedules.
Attrition Rate: Percentage of employees leaving during the period.
Headcount: Total active workforce.
Time to Hire: Average time required to fill a role.
Training Completion Rate: Percentage of required training completed.
Compliance Status: Whether mandatory policies, tests, or certifications are up to date.
How to Create an MIS Report Full Form
Key elements to include
A useful MIS report should be structured, concise, and easy to review. Regardless of department, most strong reports include the following elements:
Accuracy, clarity, and consistency matter more than visual complexity. A simple report with reliable metrics is more valuable than a beautiful report built on weak data.
Pull data from the systems that matter, such as ERP, CRM, HRMS, finance software, spreadsheets, or operational databases. Make sure the data is timely and validated.
3. Organize metrics and KPIs
Choose only the KPIs that support the objective. Group them logically and avoid stuffing the report with too many numbers.
4. Choose the reporting format
The format should match the audience:
Tables for detail
Charts for trends
Scorecards for targets
Exception highlights for fast action
Dashboards for ongoing review
5. Review and distribute
Check accuracy, review anomalies, add context where needed, and share the report on a fixed schedule. Timeliness is part of report quality.
Businesses often begin with spreadsheets, then move toward ERP-generated reports or BI software as reporting complexity grows. That transition becomes necessary once multiple departments, frequent refreshes, and standardized logic are involved.
Best practices for making reports useful
From a consulting perspective, the most effective MIS reports share a few practical traits.
1. Keep the layout simple and audience-focused
An executive does not need a transaction dump. A branch manager may need more operational detail. Design the report around the user, not the data source.
2. Use relevant metrics, not every available number
Good MIS reporting is selective. The goal is decision support, not data overload.
3. Standardize definitions and formats
If revenue, headcount, or stock availability mean different things across teams, the report will create confusion instead of clarity.
4. Add insights, not just numbers
A report should explain what changed and why it matters. Even a short comment can make the output far more useful.
5. Review reports regularly and refine them
A report that was useful six months ago may no longer fit the business. Review the reporting structure as goals, systems, and risks evolve.
Building strong MIS reporting manually is possible, but it becomes difficult at scale. Once you are combining multiple systems, refreshing reports frequently, and distributing role-based views, automation becomes the better path.
Benefits of MIS Report Full Form and Final Takeaway
The MIS report full form is Management Information System report, but the real value goes beyond the definition. MIS reports help businesses organize information, monitor KPIs, improve visibility, and support better decisions across sales, finance, HR, inventory, and operations.
The biggest benefits are clear:
Better management visibility
Faster and more informed decisions
Improved cross-team communication
Consistent performance tracking
Earlier detection of business issues
Stronger planning and control
For students and professionals, understanding MIS reports is also useful beyond day-to-day business work. It builds foundational knowledge for careers in business operations, analytics, management, finance, reporting, and enterprise systems.
Building MIS reports at scale: why automation matters
Building this manually is complex; use FineReport to utilize ready-made templates and automate this entire workflow. Instead of stitching together spreadsheets from multiple departments, teams can centralize data, create standardized MIS templates, schedule delivery, and give decision-makers faster access to trusted metrics.
That matters most when you need to:
Consolidate data from multiple business systems
Build department-specific and executive-level reports
Standardize KPIs across the organization
Automate daily, weekly, and monthly reporting cycles
Deliver dashboard-style MIS views with drill-down capability
If you remember one thing, remember this: an MIS report is the management layer between raw data and business action. Use it when decisions depend on clear, recurring, structured reporting—not just scattered numbers.
MIS report stands for Management Information System report. It is a structured report that summarizes business data so managers can monitor performance and make decisions more quickly.
The main purpose of an MIS report is to turn raw business data into useful management insight. It helps leaders track KPIs, spot issues early, and take action based on consistent information.
A dashboard is usually more visual and often updated in real time, while an MIS report is typically standardized for daily, weekly, or monthly review. MIS reports are also more focused on repeatable management control and formal performance tracking.
Common examples include sales reports, inventory reports, attendance reports, cash flow reports, and budget versus actual reports. Different departments use different MIS reports depending on the metrics they need to monitor.
It depends on the business process and how quickly managers need to respond. Fast-moving operations may need daily MIS reports, while strategic and financial reviews are often done weekly or monthly.
Product Trial
FineReport
Pixel-perfect reports · Interactive dashboards · Easy data entry · Digital twins