Essential Property Management KPI Dashboard Metrics for Success help you track and measure the most important factors for property management. Key performance indicators show you how well your properties perform. You can monitor occupancy rates, tenant turnover, rent collection rate, and maintenance response time.
A property management kpi dashboard gives you real-time data. You see financial health, tenant satisfaction, and operational efficiency at a glance. With this tool, you make faster decisions and improve your management strategies.

Tracking financial property management KPIs is essential for understanding the profitability and stability of your portfolio. When you use Essential Property Management KPI Dashboard Metrics for Success, you gain a clear view of your financial health and can make informed decisions quickly.
Net Operating Income (NOI) stands out as one of the most important property management KPIs. You calculate NOI by subtracting all operating expenses from your total income. This figure helps you compare different properties and assess which ones deliver the best returns. When NOI increases, you see that your property portfolio is becoming more profitable and efficient. Investors rely on NOI to evaluate the financial performance and investment potential of each property.
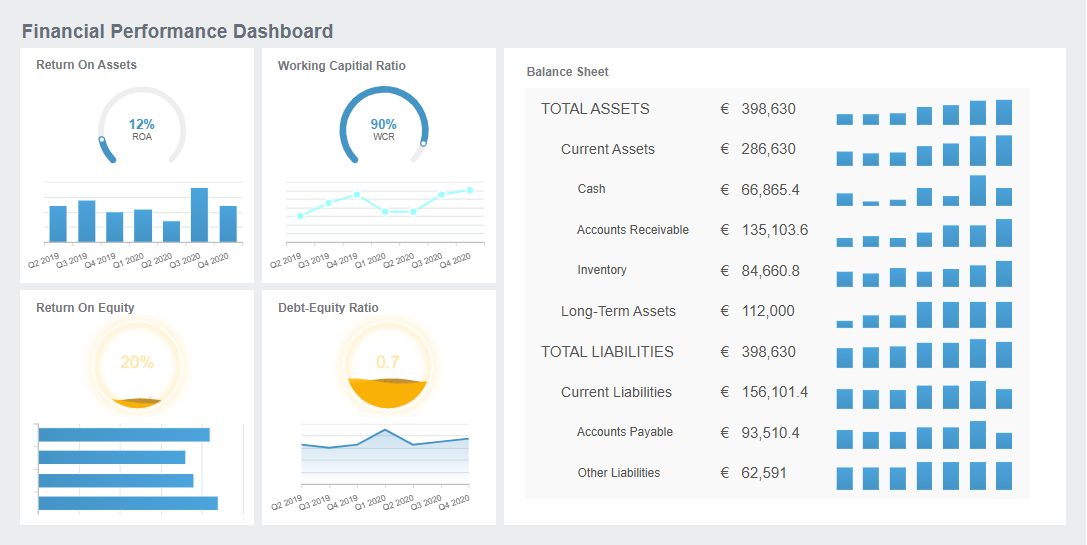
Cash flow metrics are vital financial KPIs for property managers. Cash flow represents the money left after you pay all bills and capital expenditures. To calculate cash flow, follow these steps:
Strong cash flow means you can cover expenses and invest in improvements. The 1 percent rule suggests that rental income should be at least 1 percent of the property's purchase price. Higher cash flow often leads to better investment returns, though it does not guarantee long-term property appreciation.
Rent collection rate is a critical property management KPI. This metric shows how much rent you collect compared to what is due. High rent collection rates improve cash flow and make your finances more predictable. Efficient rent collection helps you reduce vacancies and increase revenue. The average property management fee ranges from 8% to 12% of monthly rental income, influenced by location, property type, and services offered.
| Evidence | Explanation |
|---|---|
| Higher collection rates lead to improved cash flow | You can manage finances better and invest in property improvements. |
| Reducing vacancy increases revenue | High rent collection rates minimize vacancies and boost revenue. |
| Shortening accounts receivable days makes cash flow predictable | Efficient processes create stable cash flow for property management. |
Expense ratio measures the percentage of income spent on operating expenses. This property management KPI helps you identify cost-saving opportunities. Compare expense ratios across property types to spot inefficiencies.
| Property Type | Typical Expense Ratio (%) |
|---|---|
| Apartment Buildings | 35% - 45% |
| Office Buildings | 35% - 55% |
| Retail Properties | 20% - 30% |
| Industrial Properties | 15% - 25% |
| Hospitality | 50% - 65% |
When you analyze expense ratios, you can find areas to reduce costs. A higher ratio may reveal inefficiencies, while a lower ratio could mean underreporting expenses. Use Essential Property Management KPI Dashboard Metrics for Success to monitor these financial KPIs and optimize your property management strategy.
Tracking operational performance KPIs is essential for understanding how well your properties function day-to-day. Essential Property Management KPI Dashboard Metrics for Success help you monitor these KPIs in real time, giving you the power to improve property performance and tenant satisfaction.
You need to measure occupancy and vacancy rates to assess how efficiently you fill your units. High occupancy means your property generates steady income, while high vacancy signals lost revenue and increased costs. The following table shows current industry averages for different property types:
| Property Type | Vacancy Rate | Notes |
|---|---|---|
| Industrial Properties | 6.8% | Early 2025 statistics |
| Office Properties | 19.6% | Highest on record in Q1 2025 |
| Retail Properties | 4.2% | Lowest since 2007 |
| Multifamily | 8% | Stabilization with strong rental demand |
| General Retail | 2.6% | Lowest vacancy rate among commercial types |
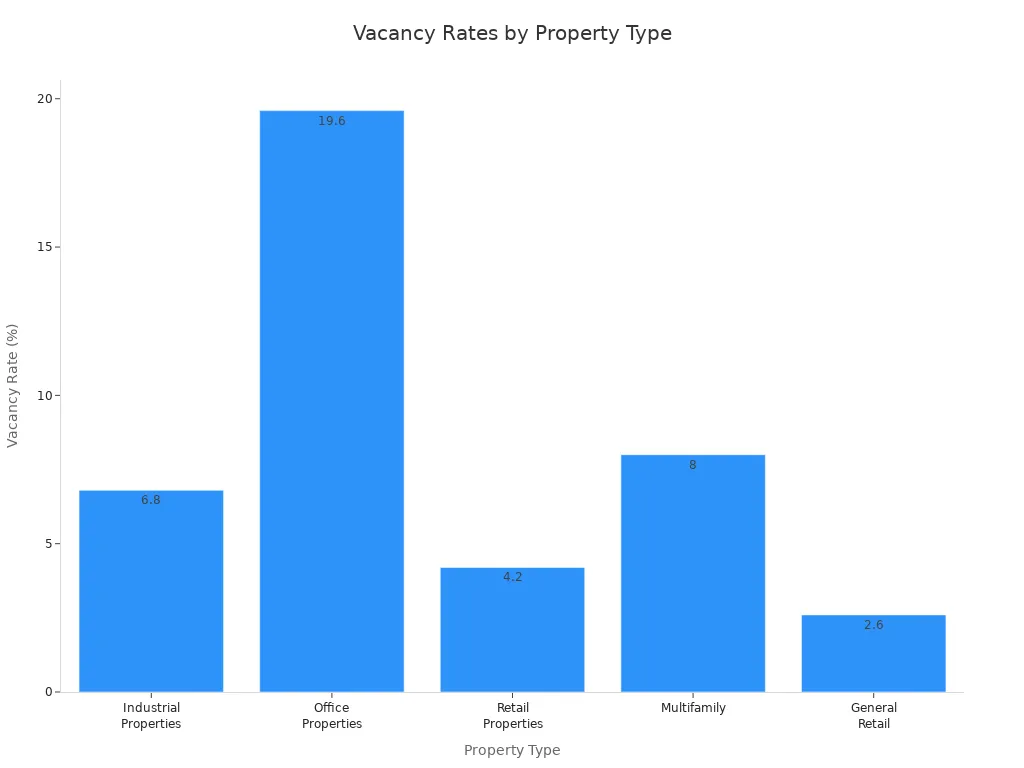
When you track occupancy and vacancy rates, you can quickly spot trends and take action. High vacancy leads to lost rental income, increased marketing costs, property deterioration, and a negative impact on your portfolio’s value.
Maintenance response time is a key operational KPI. Fast response times keep tenants happy and reduce complaints. The table below outlines industry standards:
| Response Time | Description |
|---|---|
| Under 4 hours | Strong response time |
| Under 24 hours | Acceptable response time |
| Over 24 hours | Risk tenant satisfaction |
Prompt maintenance boosts tenant retention and satisfaction. Delays can cause frustration and even lead to tenants moving out. As one property manager shared:
I’ll never forget a situation I witnessed firsthand at a CWS apartment community. The maintenance department failed to respond to six emergency calls over a 13-hour period. That’s not just negligence, it’s indifference. When a tenant rents a home, they’re paying for a certain level of livability and support. They choose professional management because they expect professional results. In that case, the tenants didn’t just feel ignored, they were ignored. No one returned their calls, no one came to fix the issue, and no one cared enough to check in afterward. That single failure cost the community a tenant.
Tenant turnover is one of the most important property performance KPIs. The average tenant turnover rate in property management is 48.8%. High turnover increases costs for cleaning, repairs, and marketing. It also leads to loss of rental income and more operational challenges. Common causes of tenant turnover include maintenance issues, poor property upkeep, safety concerns, and poor communication. You can reduce tenant turnover by focusing on fast maintenance response and clear communication.
| Cost Type | Description |
|---|---|
| Increased Costs | Expenses for cleaning, repairs, and marketing rise with high turnover rates. |
| Loss of Rental Income | Vacant units result in no revenue, impacting profitability. |
| Operational Challenges | Managing frequent turnovers requires additional time and effort. |
When you use Essential Property Management KPI Dashboard Metrics for Success, you can track these KPIs and make data-driven decisions to improve operational efficiency and profitability.
Tracking tenant experience KPIs with Essential Property Management KPI Dashboard Metrics for Success helps you understand how well you meet tenant needs and expectations. These metrics reveal how satisfied tenants feel, how likely they are to renew leases, and how quickly you resolve their requests. Focusing on these KPIs improves tenant retention and boosts property value.
Tenant satisfaction score measures how happy tenants are with your property and services. You can collect this score through surveys or feedback forms. High scores show that tenants appreciate your management style and property upkeep. When you monitor tenant satisfaction, you see direct links to retention and positive recommendations. Satisfied tenants often renew leases and refer others, which increases occupancy and reduces marketing costs.
| Evidence Type | Description |
|---|---|
| Retention and Renewal Rates | Higher tenant satisfaction leads to increased retention and renewal rates. |
| Positive Recommendations | Satisfied tenants are more likely to recommend your property. |
| Improved Resident Experiences | Proactive management increases lease renewals. |
Lease renewal rate is a vital KPI for property managers. This metric shows how many tenants choose to stay when their lease ends. A high lease renewal rate means you maintain steady income and avoid costs from turnover. You can improve this KPI by reaching out to tenants early, maintaining open communication, and keeping the property in excellent condition. Setting fair rent rates based on market research also encourages renewals. Essential Property Management KPI Dashboard Metrics for Success lets you track lease expiry profiles and average lease terms, helping you forecast occupancy and plan for future retention.
Lease renewals stabilize cash flow and minimize vacancy-related expenses. If you offer fair renewal rates, you increase tenant retention rate and reduce turnover costs.
Request resolution time measures how quickly you address tenant requests and work orders. Fast resolution improves tenant satisfaction and retention. Delays can lead tenants to seek other properties. Establishing benchmarks for response times helps your team prioritize urgent issues. Essential Property Management KPI Dashboard Metrics for Success allows you to monitor resolution times and identify areas for improvement. When you resolve requests quickly, you increase tenant retention rate and create a positive living experience.
Monitoring these KPIs with Essential Property Management KPI Dashboard Metrics for Success gives you actionable insights to enhance tenant experience, increase retention, and maximize property performance.

You need to see your property management KPIs as they change. A property management KPI dashboard gives you instant access to the most important metrics. You can track property management KPIs such as occupancy rates, rent collection, maintenance response times, and average daily rate. When you use FineReport, you get real-time updates from multiple data sources. This means you always have the latest information to guide your decisions.
FineReport connects to databases, spreadsheets, and cloud platforms. You can integrate financial performance KPIs, operational data, and tenant experience metrics into one dashboard. The drag-and-drop interface lets you build dashboards quickly. You do not need advanced technical skills. You can monitor trends, compare properties, and identify issues before they become problems.
Automated reporting features in FineReport save you time. You can schedule reports to run daily, weekly, or monthly. The system sends updates to your email or mobile device. You stay informed about your property portfolio without manual effort. This approach supports data-driven property management and helps you respond to changes in occupancy, expenses, or tenant satisfaction.
You want a dashboard that fits your business needs. FineReport offers flexible customization options for your property management KPI dashboard. You can choose which KPIs to display, arrange charts and tables, and set up alerts for critical metrics like average daily rate or expense ratio. The dashboard adapts to different screen sizes, so you get a clear view whether you use a computer, tablet, or smartphone.
FineReport supports mobile access through several methods. You can use the DataAnalyst app on iOS or Android devices. The app provides a comfortable experience and lets you interact with charts and reports. You can bind the app to your mobile device for secure access. You do not need to register for single-template access via H5 terminals, making it easy to view reports on the go.
The table below shows how you can access your property management KPI dashboard across different platforms:
| Scenario | Decision-making Platform | Mobile Decision-making Platform | Mobile Report Display |
|---|---|---|---|
| PC platform | Registration required | No registration required | No registration required |
| DataAnalyst app | Registration required | Registration required | Registration required |
| Single-template access via H5 terminals | SSO not supported (no registration) | SSO supported (registration) | No registration required |
| Platform directory access via integrated H5 apps | Registration required | No registration required | Registration required |
You can customize your dashboard layout with FineReport. You can drag and drop components, select chart types, and adjust colors to match your brand. The dashboard supports interactive features, so you can drill down into specific KPIs and view detailed reports. You can also set up automated alerts for important changes, such as a drop in occupancy or a spike in expenses.

You need a clear strategy to track property management KPIs effectively. Start by identifying the most important KPIs for your business, such as net operating income, rent collection rate, tenant turnover, and average daily rate. Use FineReport to integrate data from all your sources. This ensures you get a complete picture of your property portfolio.
Follow these best practices to get the most from your property management KPI dashboard:
Tip: Use interactive features in FineReport to drill down into specific metrics. For example, you can click on a chart to see details about rent collection or maintenance response times. This helps you find the root cause of issues and take action quickly.
You can also use FineReport’s 3D visualization tools to make complex data easier to understand. These tools help you present financial performance KPIs, operational metrics, and tenant experience data in a way that is clear and engaging. When you follow these best practices, you improve your reporting process and make better decisions for your property portfolio.
A property management KPI dashboard built with FineReport gives you the flexibility, speed, and insight you need to manage your properties successfully. You can track property management KPIs, customize your dashboard, and access your data from any device. This approach supports data-driven property management and helps you achieve your business goals.

Tracking property management KPIs drives business growth and efficiency. You identify issues like high vacancy rates and slow rent collection. You improve service delivery and align strategies with your goals. Using Essential Property Management KPI Dashboard Metrics for Success with FineReport gives you actionable insights and transparency. Review your current KPI tracking methods and consider FineReport for better performance. Regularly update your KPIs as your business needs change.

Best Dashboard Apps for Business Insights
What is a Call Center Dashboard and Why Does It Matter
What is a Reporting Dashboard and How Does it Work
What is An Interactive Dashboard and How Does It Work
What is a Call Center Metrics Dashboard and How Does It Work

The Author
Lewis
Senior Data Analyst at FanRuan
Related Articles

Payment Analytics Dashboard: 12 KPIs Every Operations Leader Should Track to Cut Revenue Leakage
Losing revenue to declines? Discover 12 essential KPIs to track in your payment analytics dashboard to stop leakage and manage disputes.
Lewis Chou
May 05, 2026

SOC Dashboard Explained: 12 Essential KPIs, Views, and Workflows Security Teams Use
Learn about SOC dashboards, the 12 essential KPIs for security teams, and how they centralize alerts and workflows for faster threat detection and response.
Lewis Chou
May 05, 2026

EMR Dashboard Guide: 12 Metrics to Track for Faster Clinical and Operational Decisions
Learn the 12 essential EMR dashboard metrics to track for faster clinical and operational decisions, improving patient flow and revenue cycle management.
Lewis Chou
May 05, 2026


