
What Is a Dashboard?
Dashboard vs Report
What’s the difference between a dashboard and a report?
- Dashboards represent how you’re performing against strategic goals visually and in real-time. And by goals, we mean specific business outcomes, such as targeted quarterly revenue or targeted new customers per month.
- Reports support dashboards by representing the tactical processes or actions necessary to achieve the overall goals. Reports track and measure the success against targets for specific actions, often providing granular, historical data in a tabular format. More resources:
- Dive deeper on the question, “What is a data dashboard?”
- EXplore more interactive dashboards
Don't just collect data. Visualize what matters.
Download the Dashboard Guide to learn:
- 10 essential steps to build effective dashboards
- How to choose the right charts and avoid visual clutter
- 15 top-notch dashboard templates for 2026

Dashboard Examples And Templates
In this guide, we’ve identified and prioritized the most impactful dashboard examples for each department. Use the table of contents below to find the dashboard templates most relevant to your organization and teams.
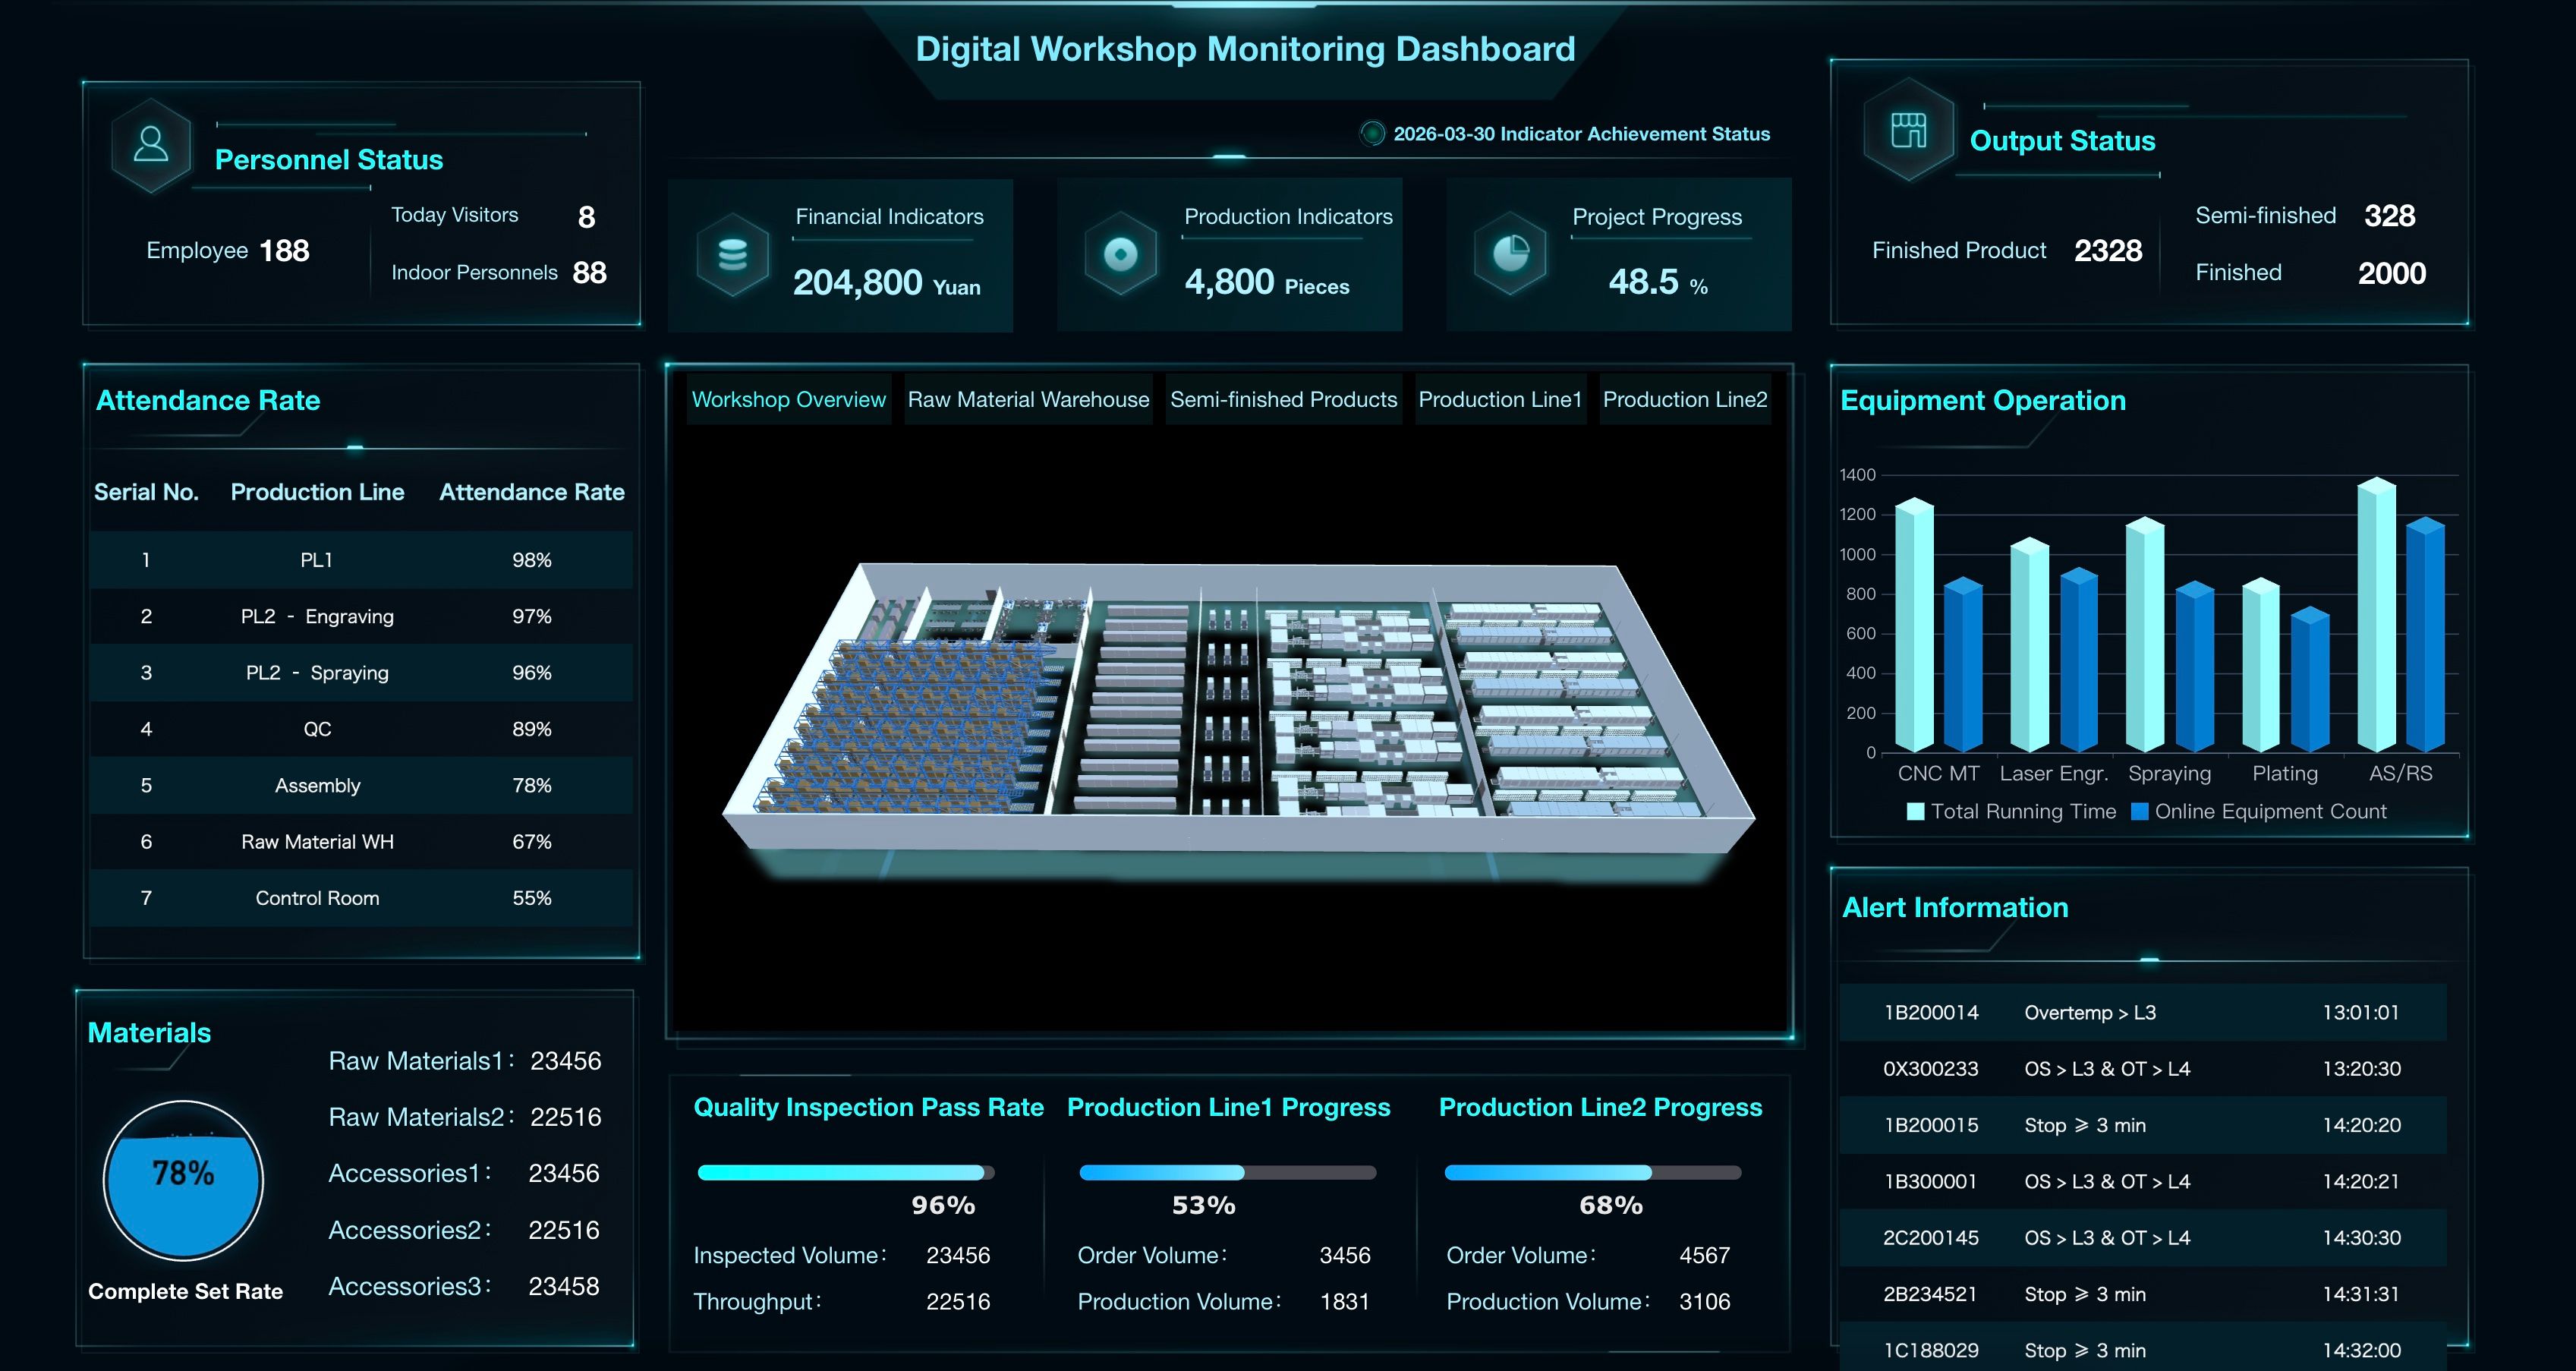
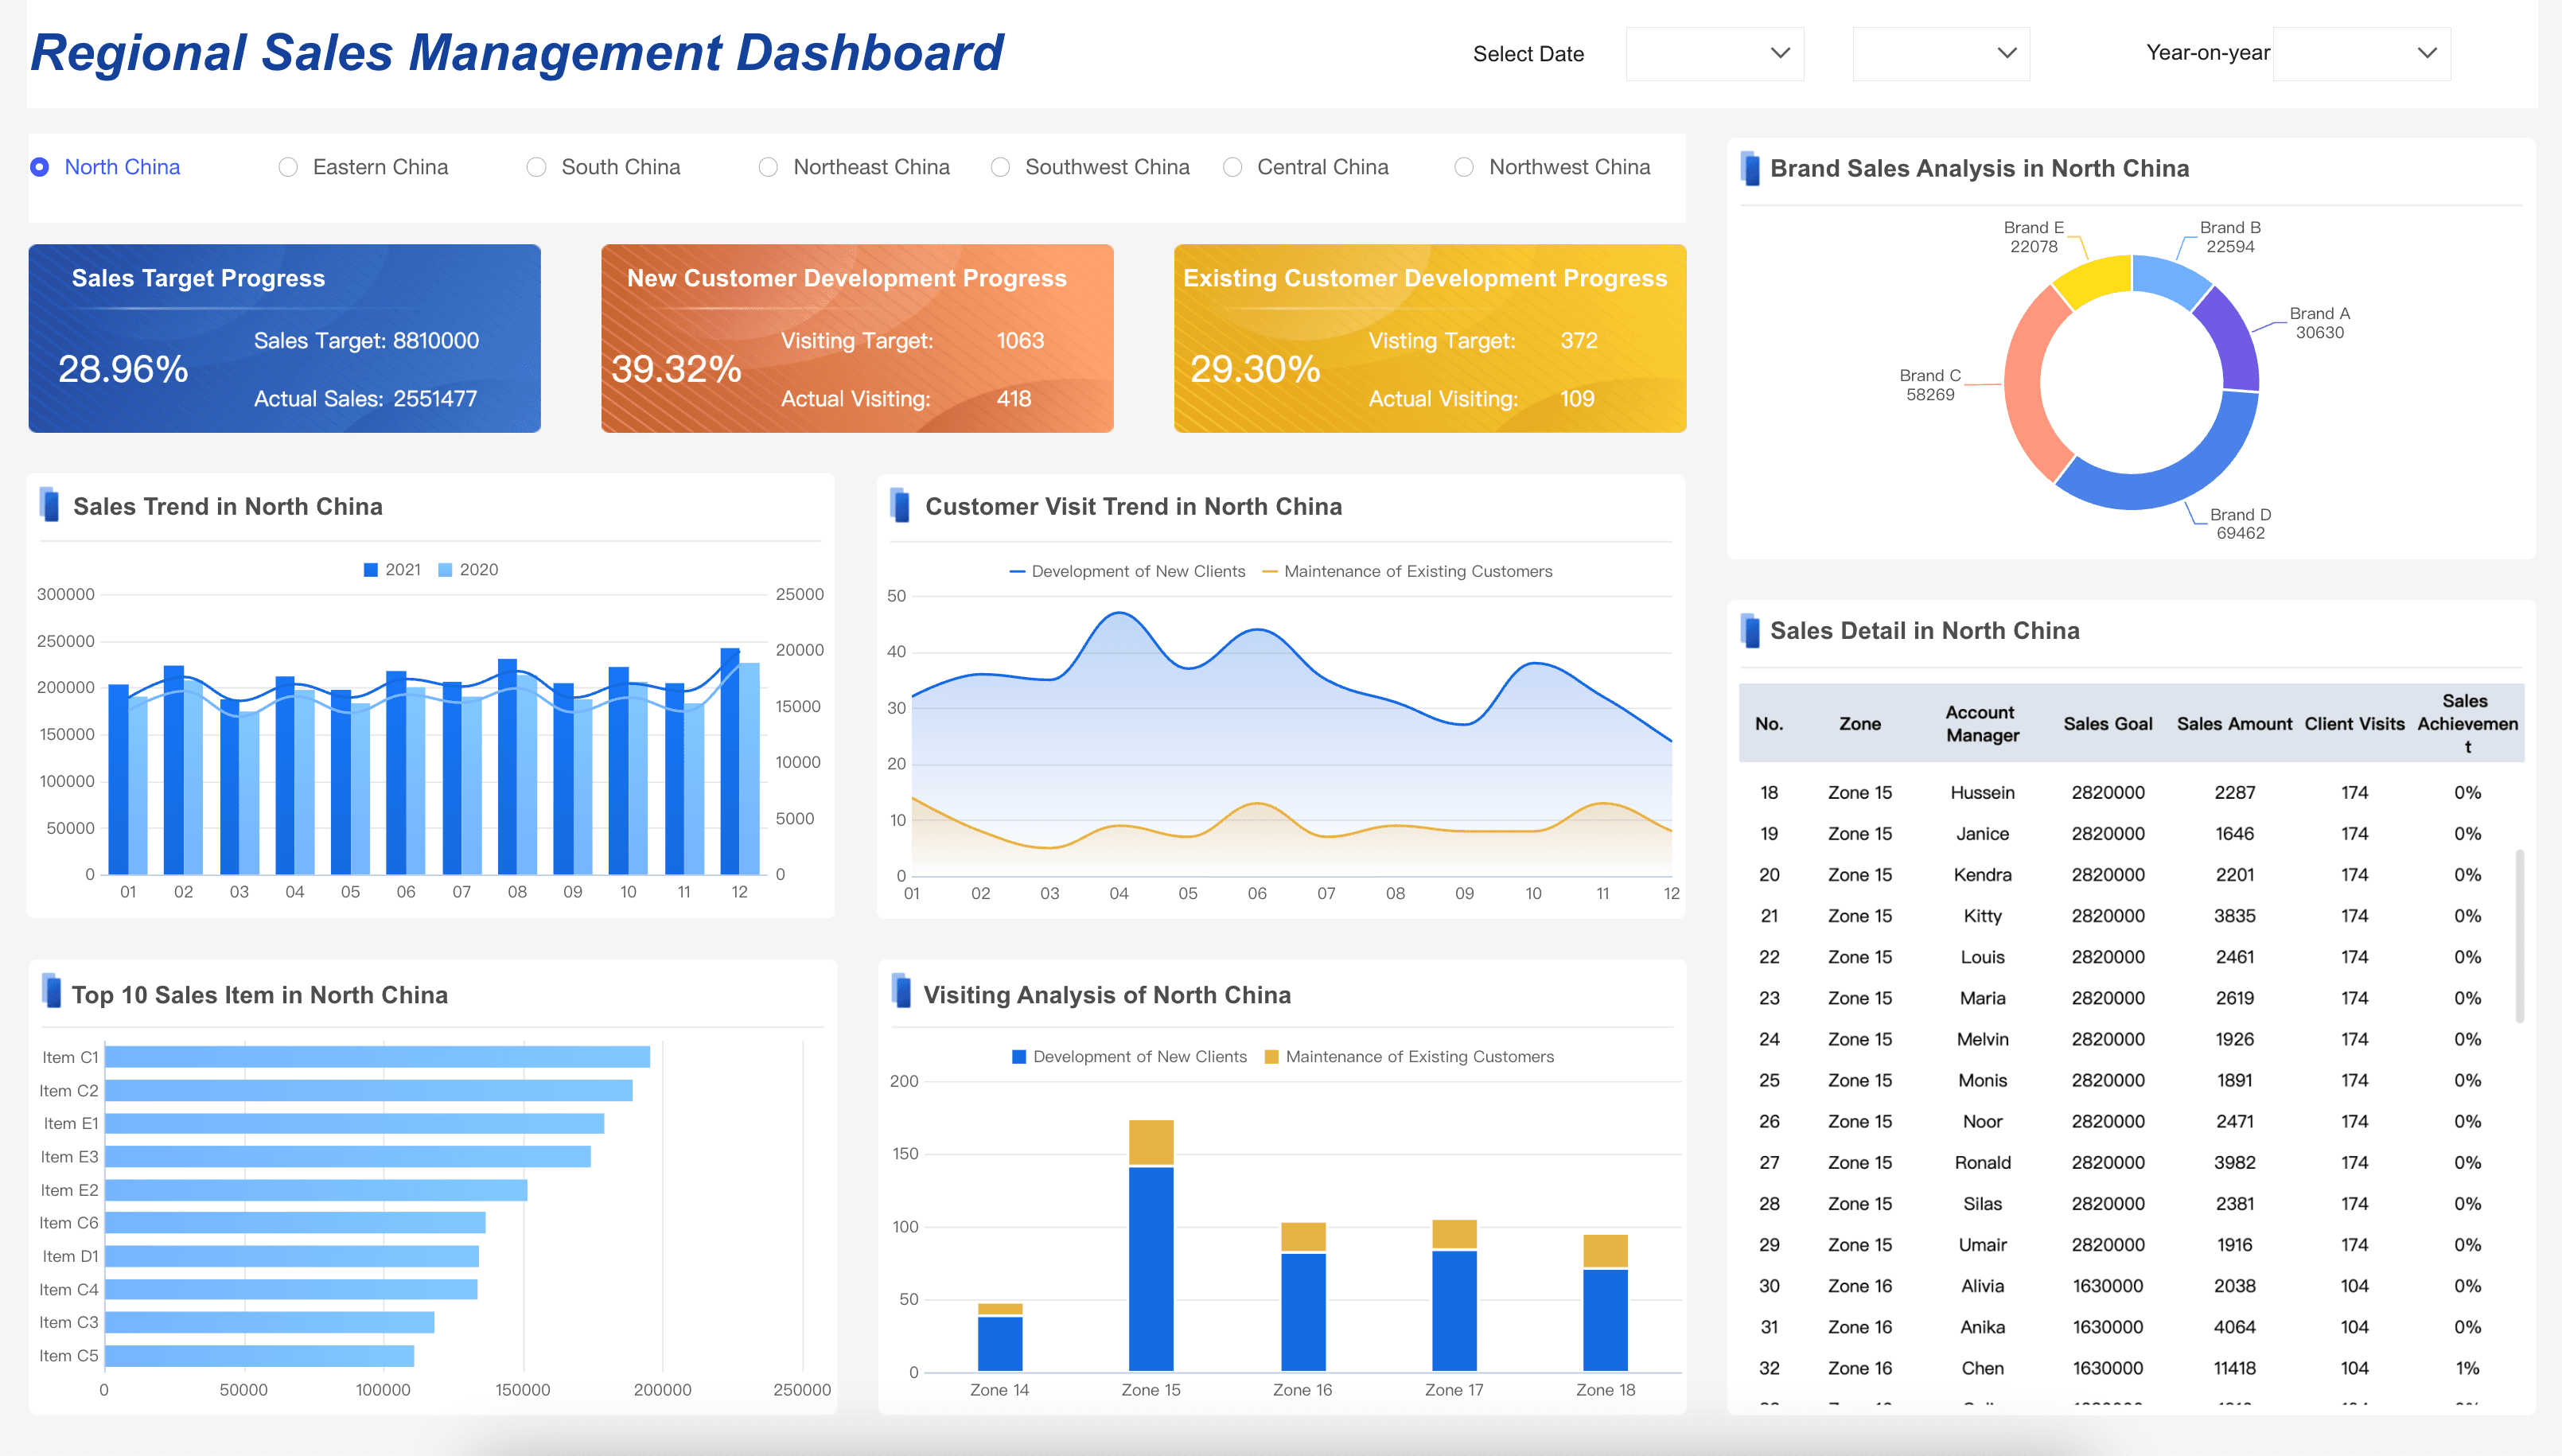
Manufacturing Dashboard Examples
Manufacturing leaders and plant managers need to track the metrics that help them optimize production and minimize downtime. Below are essential elements for your manufacturing dashboard:
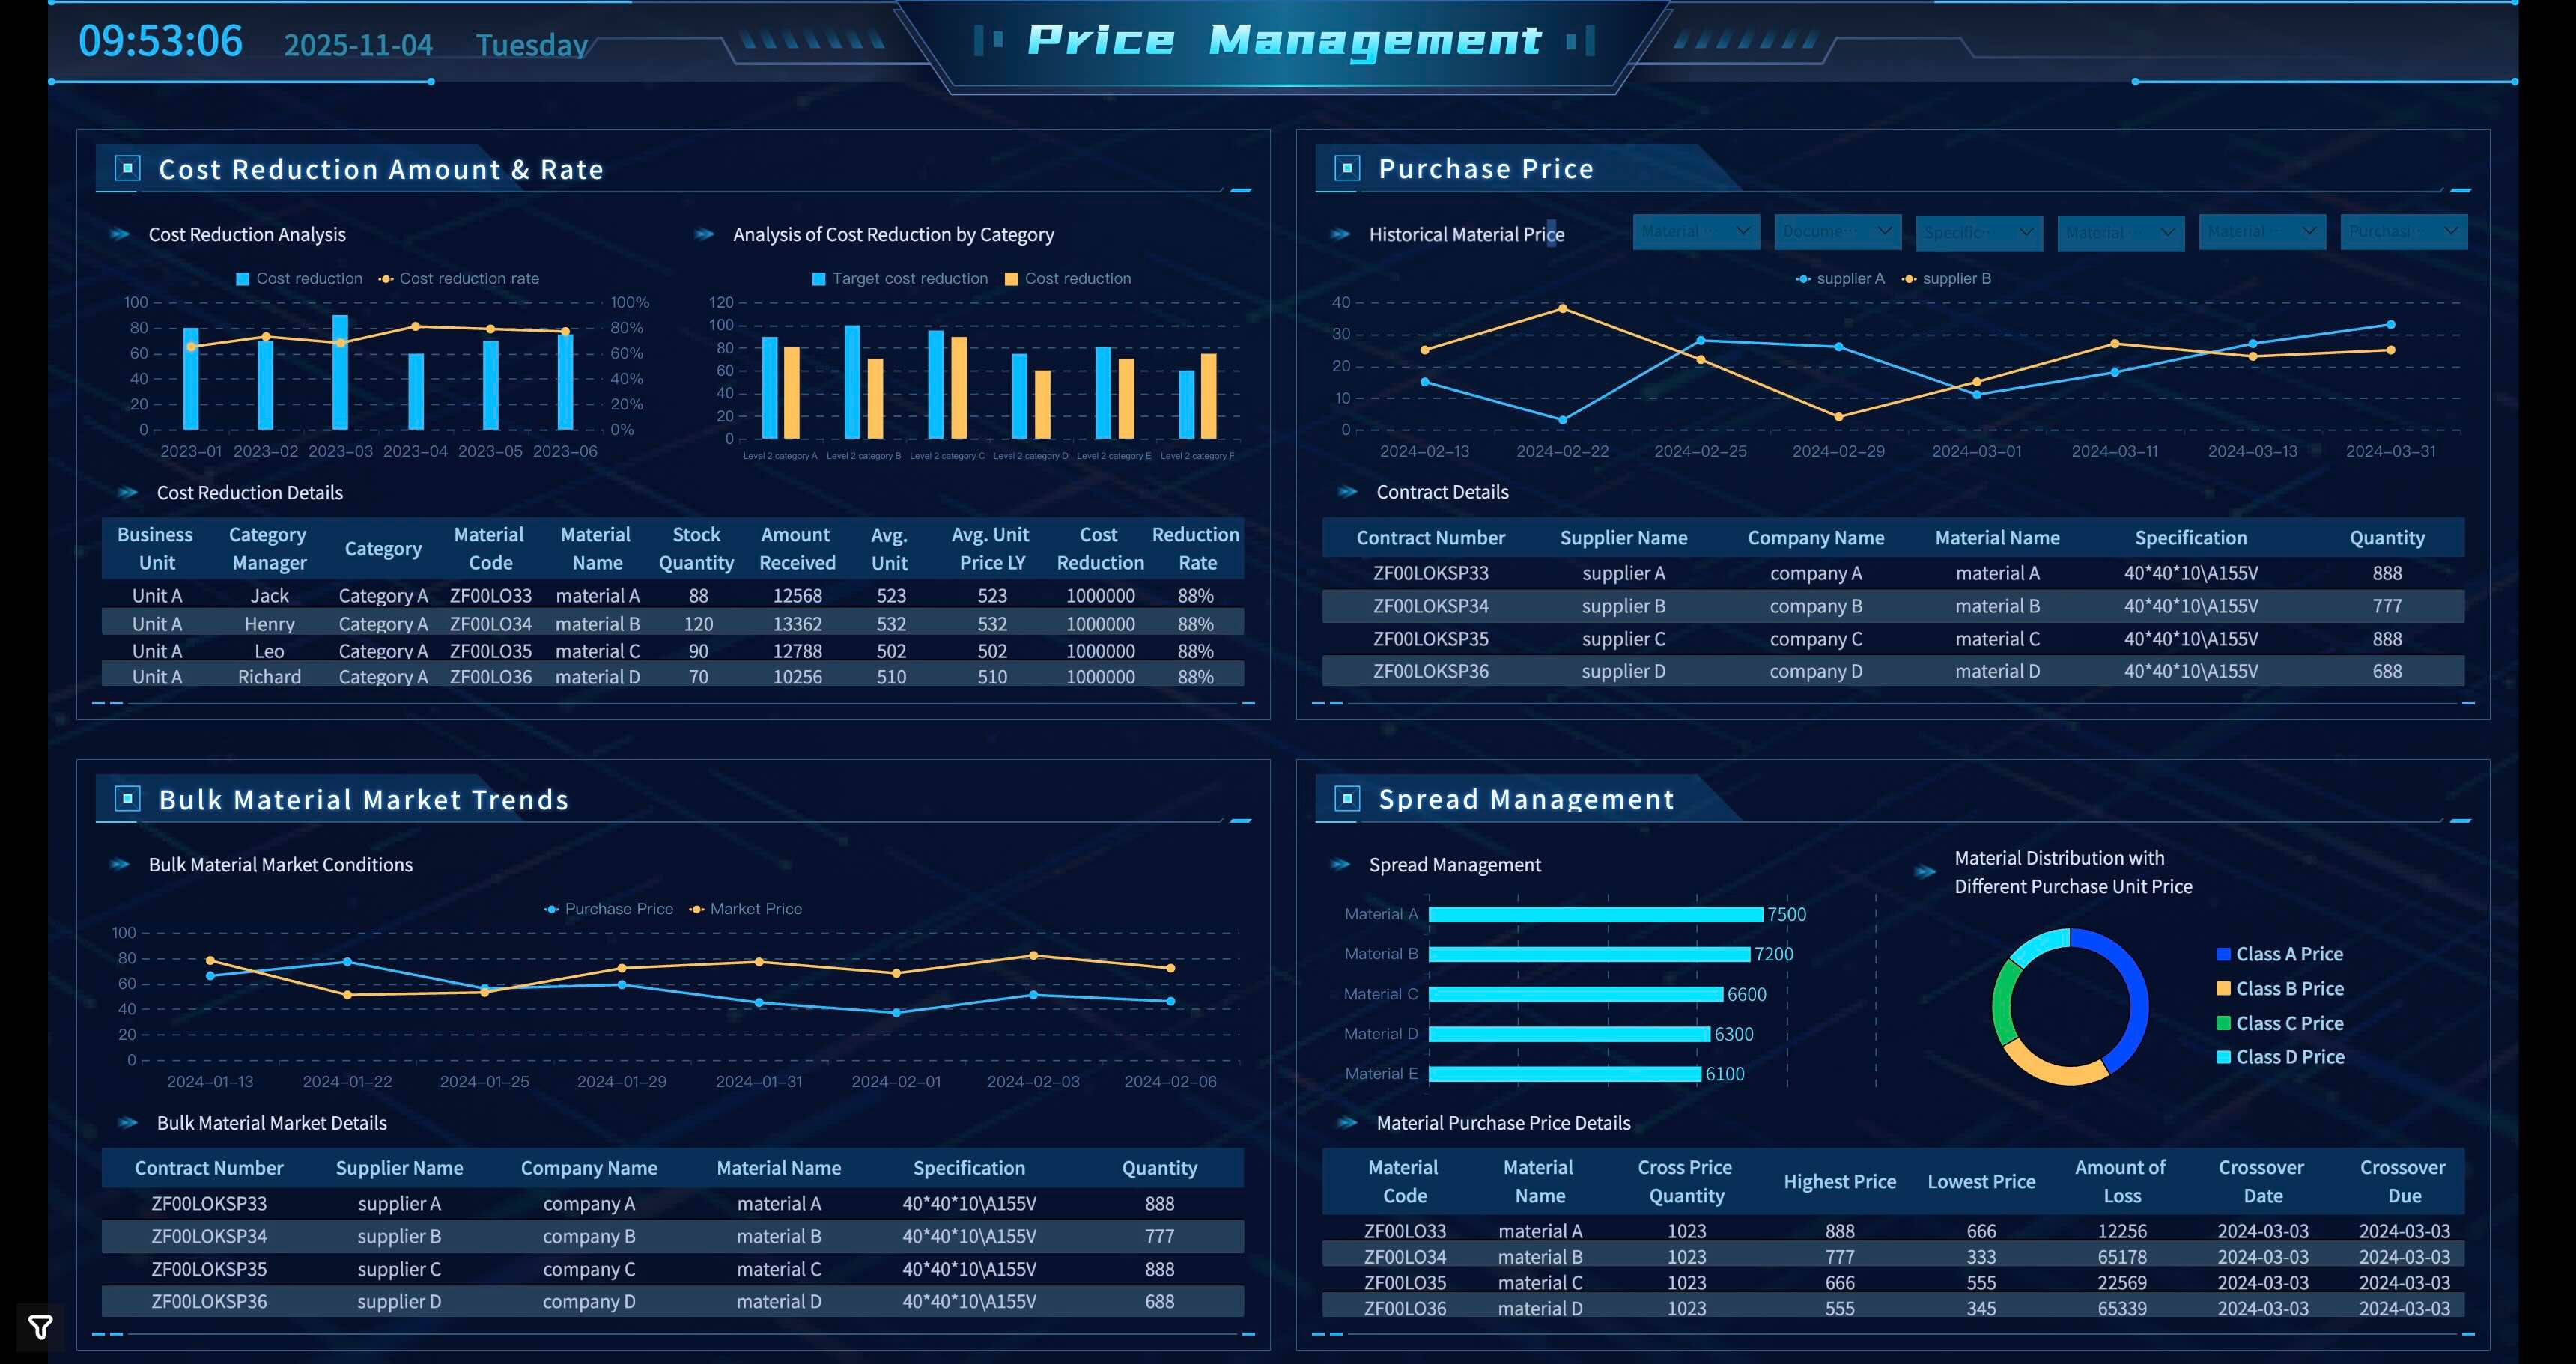
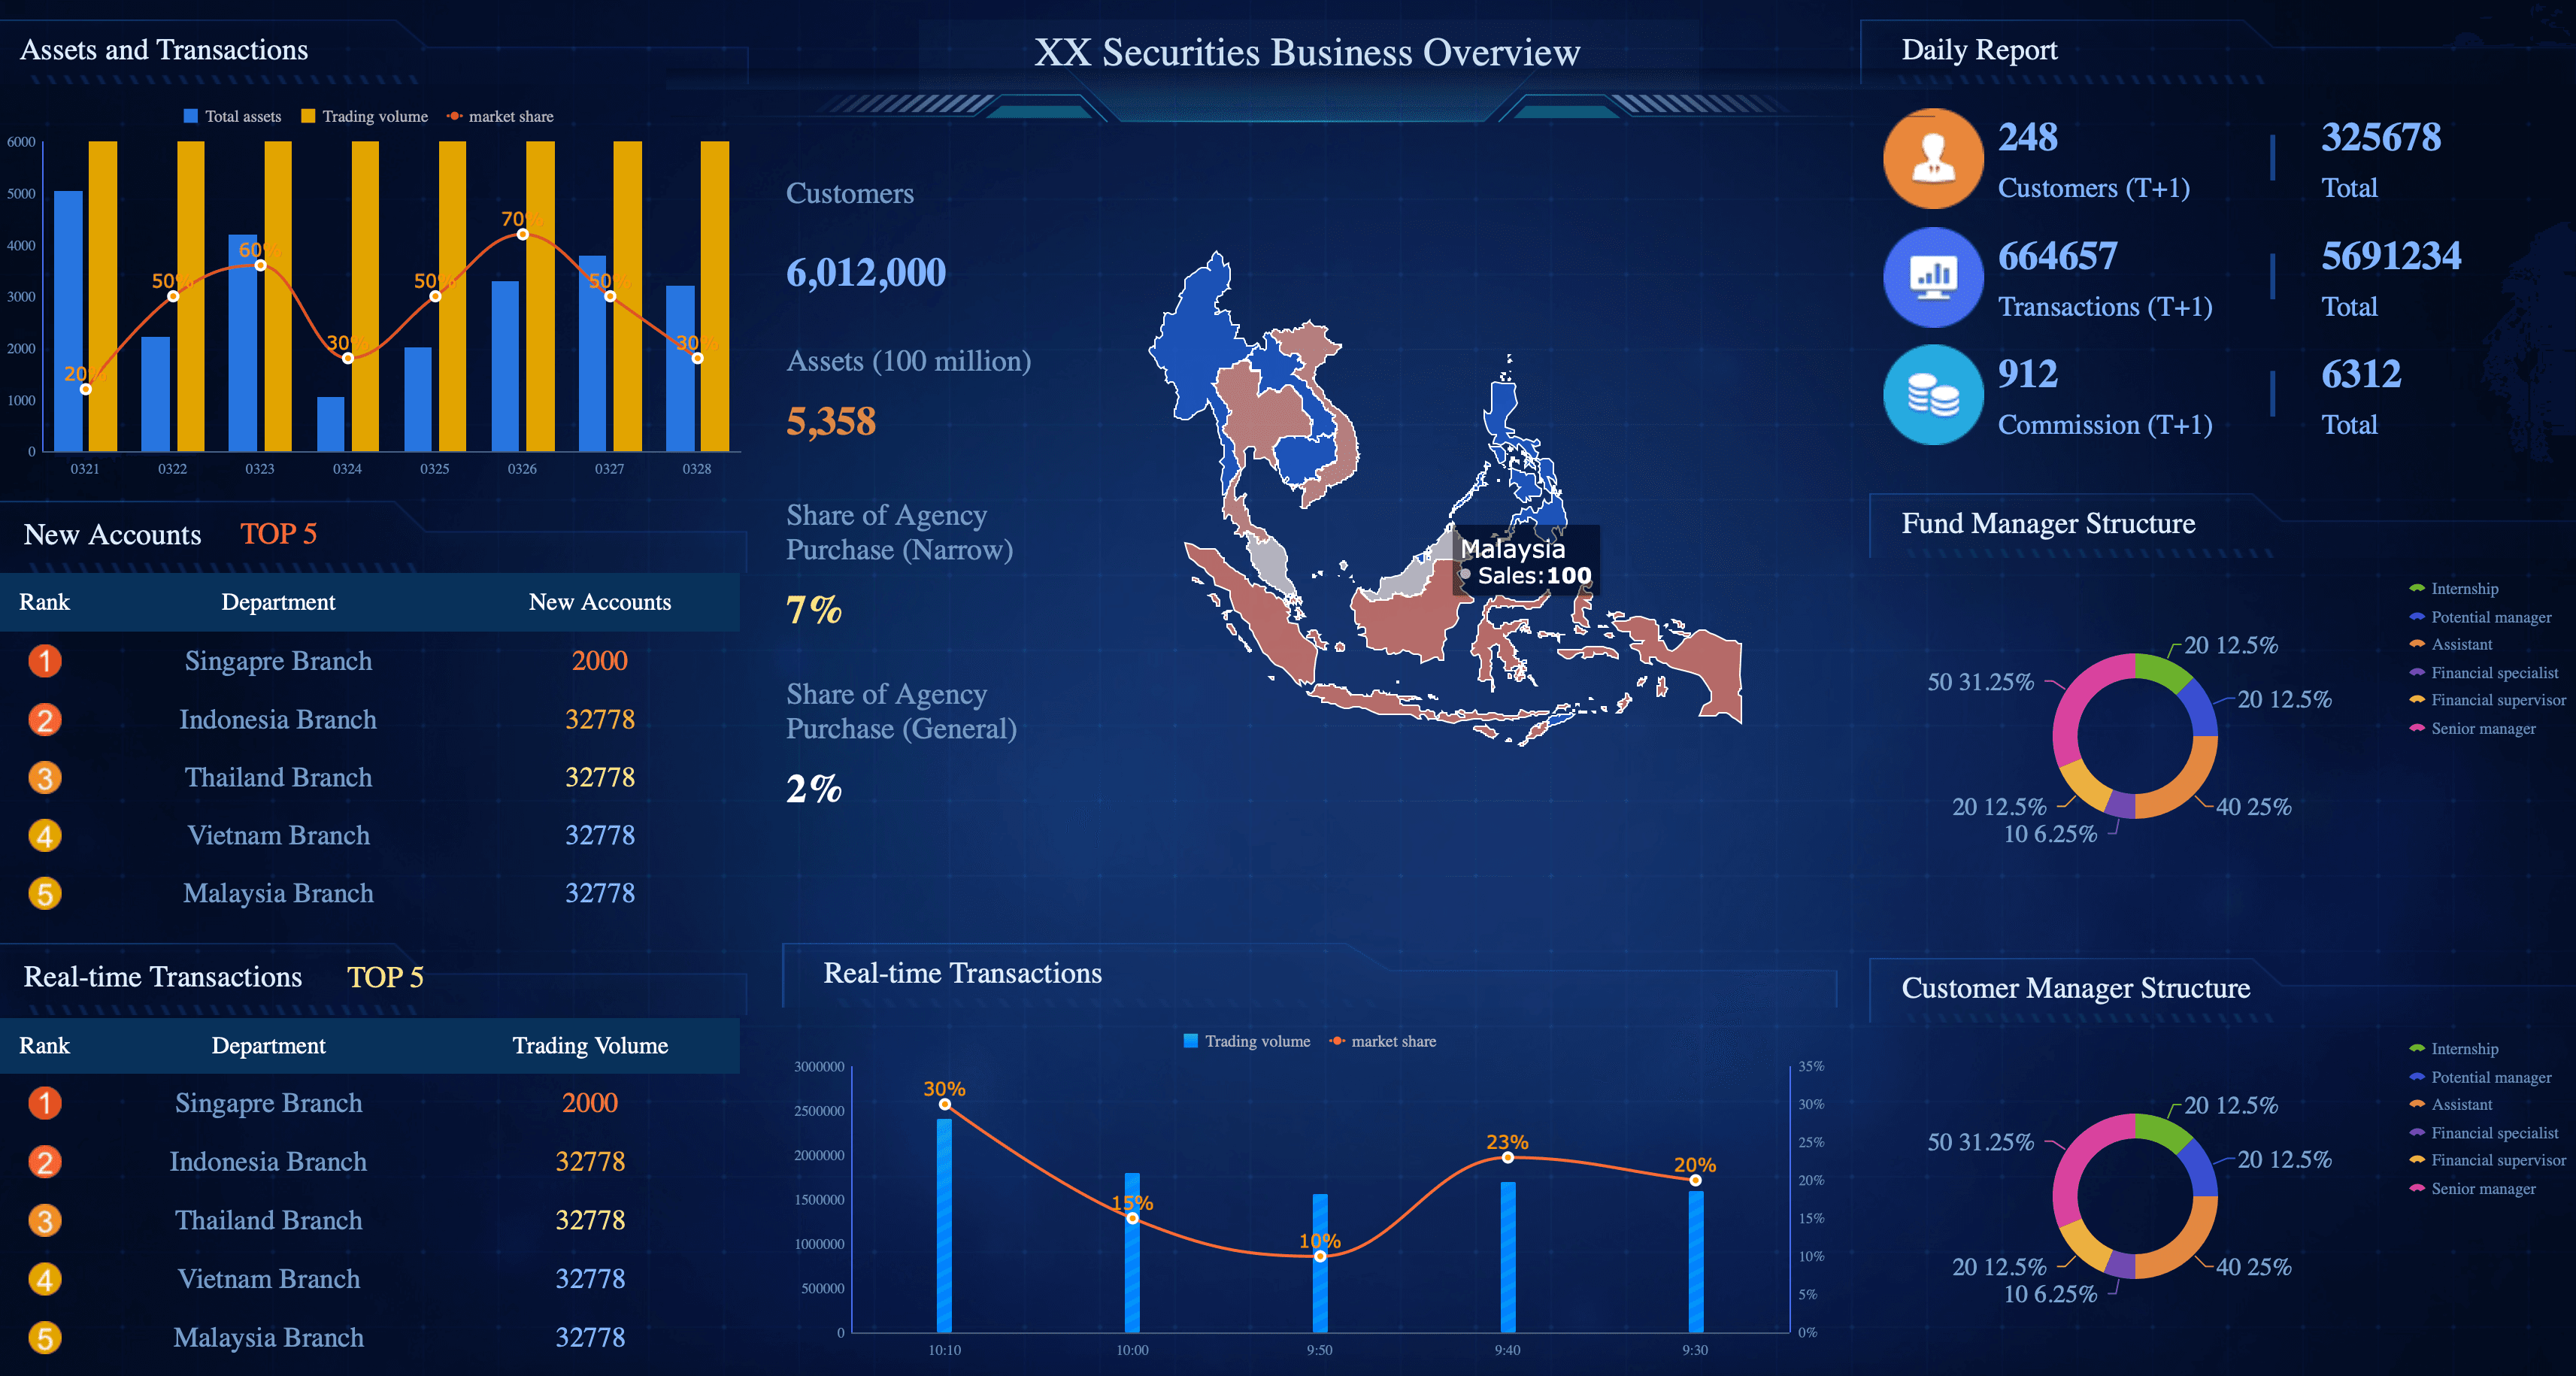
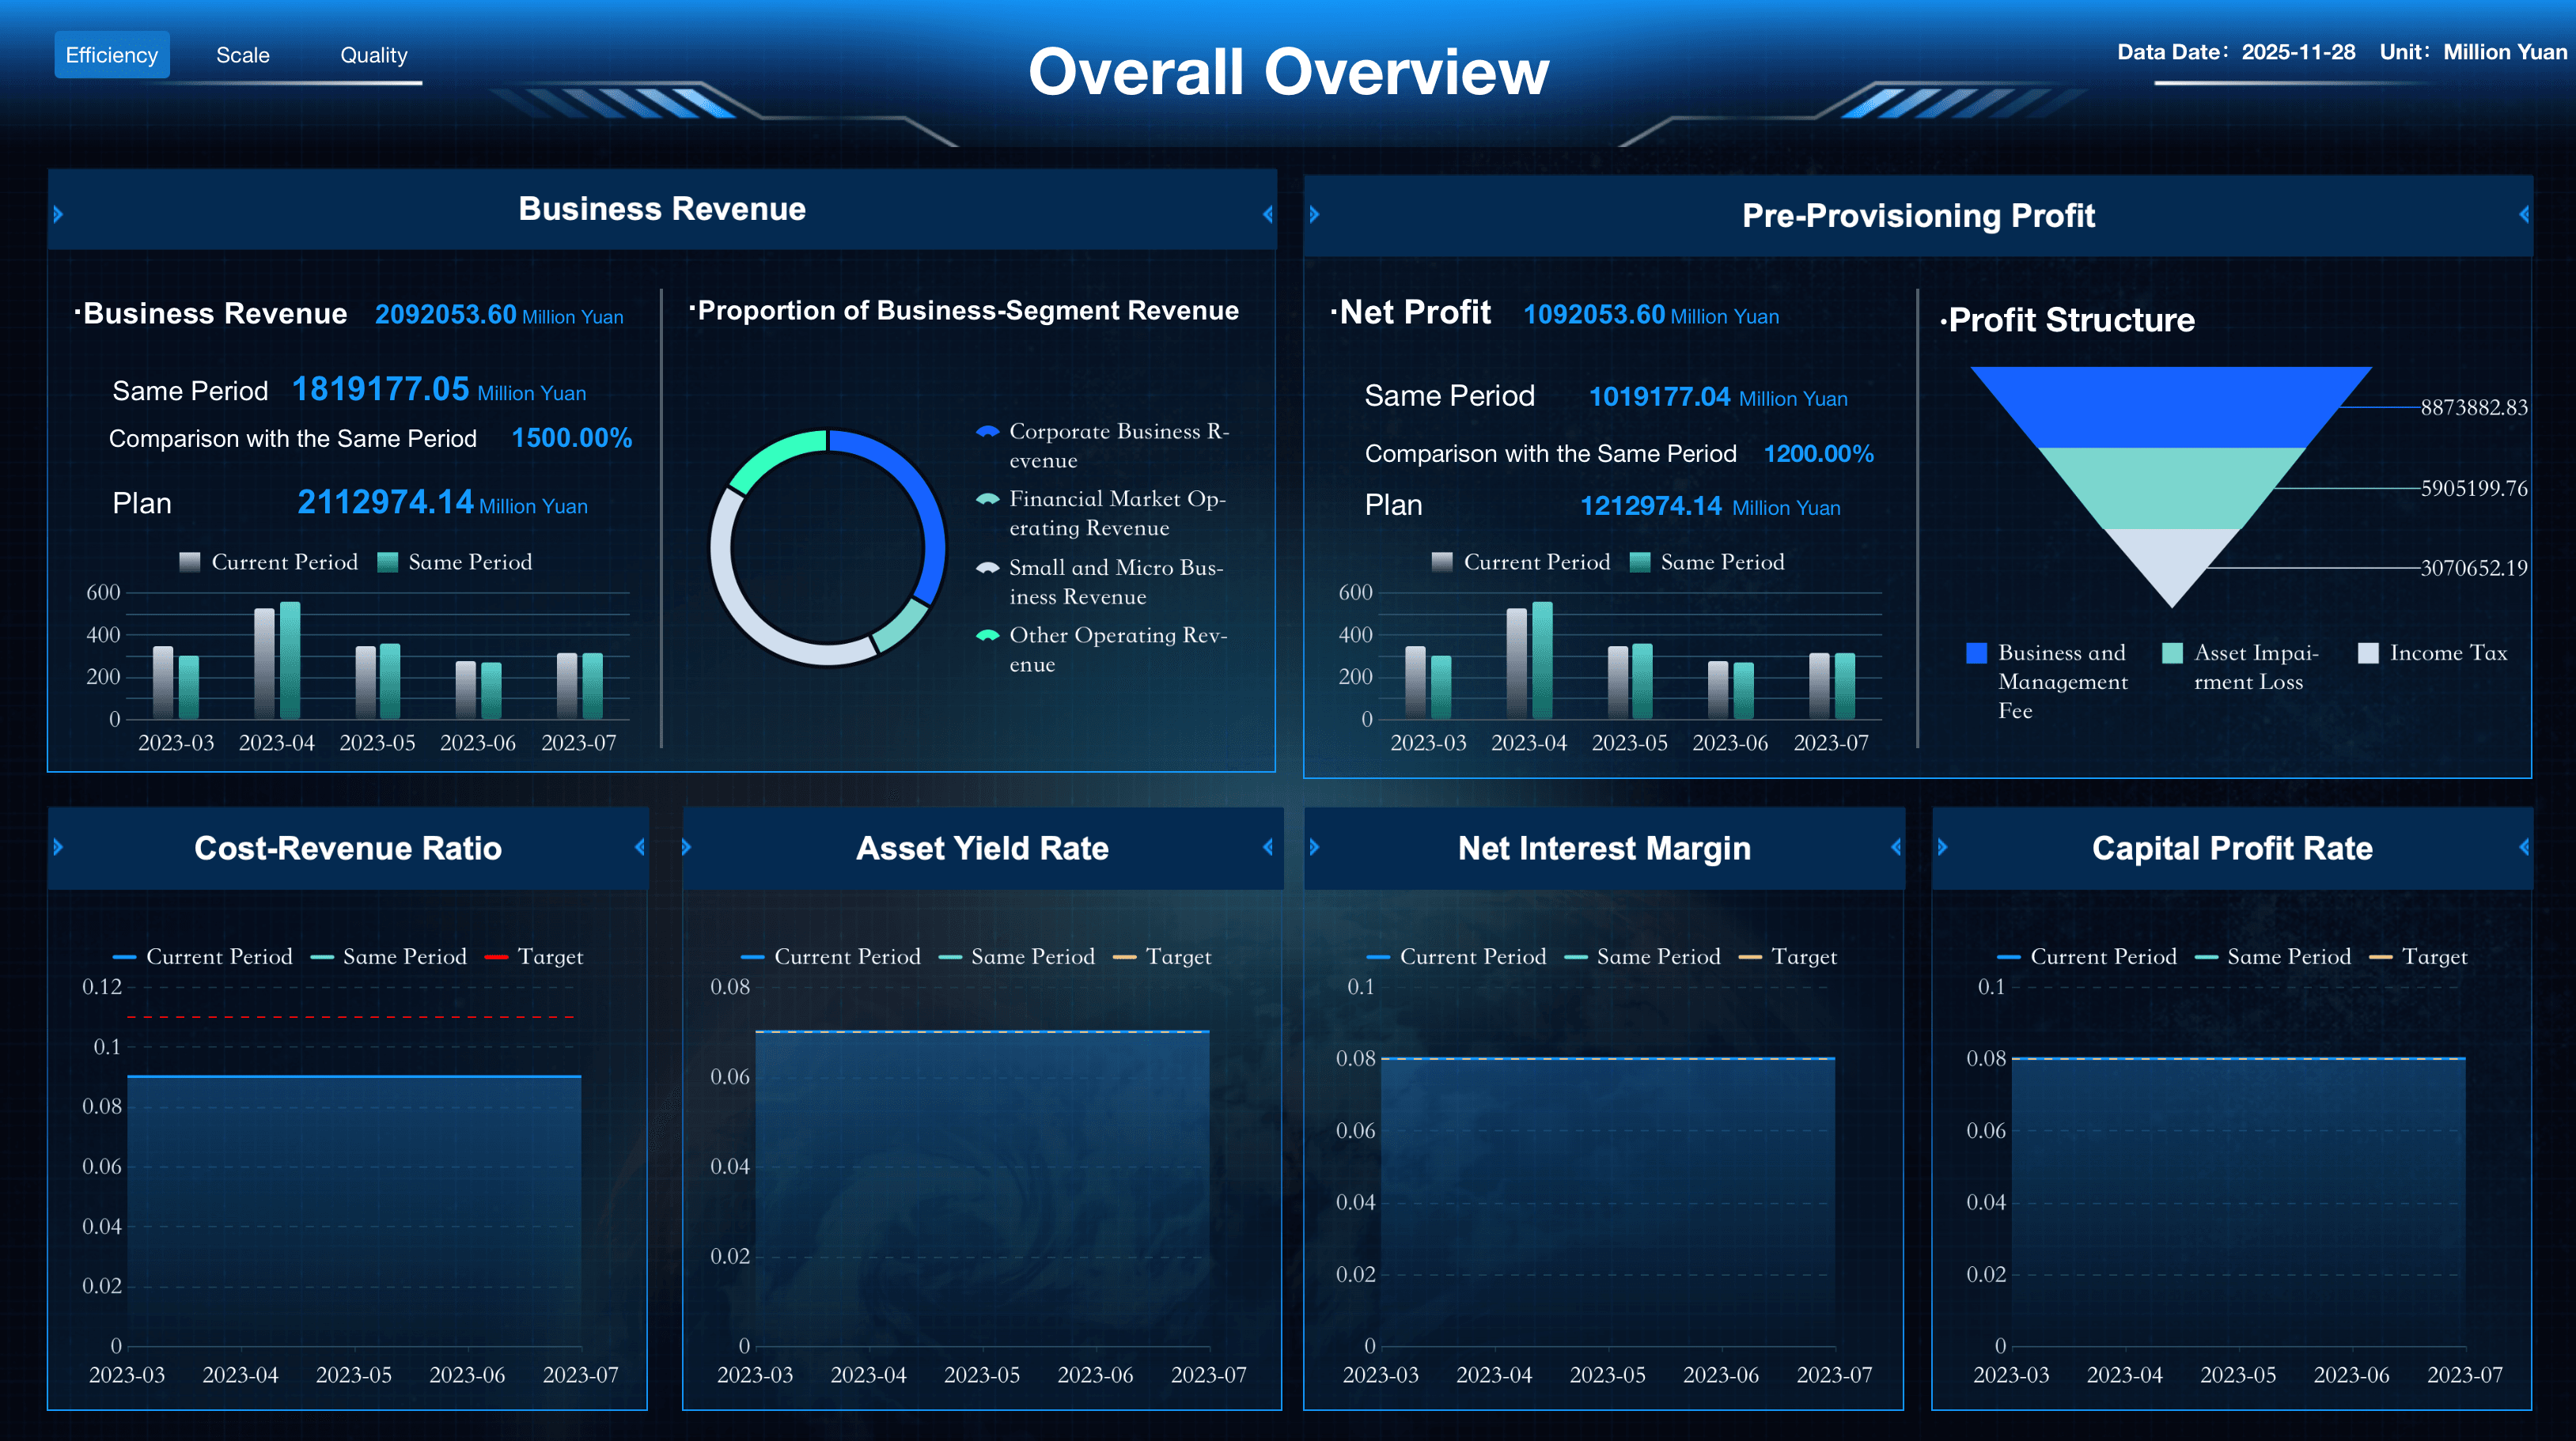
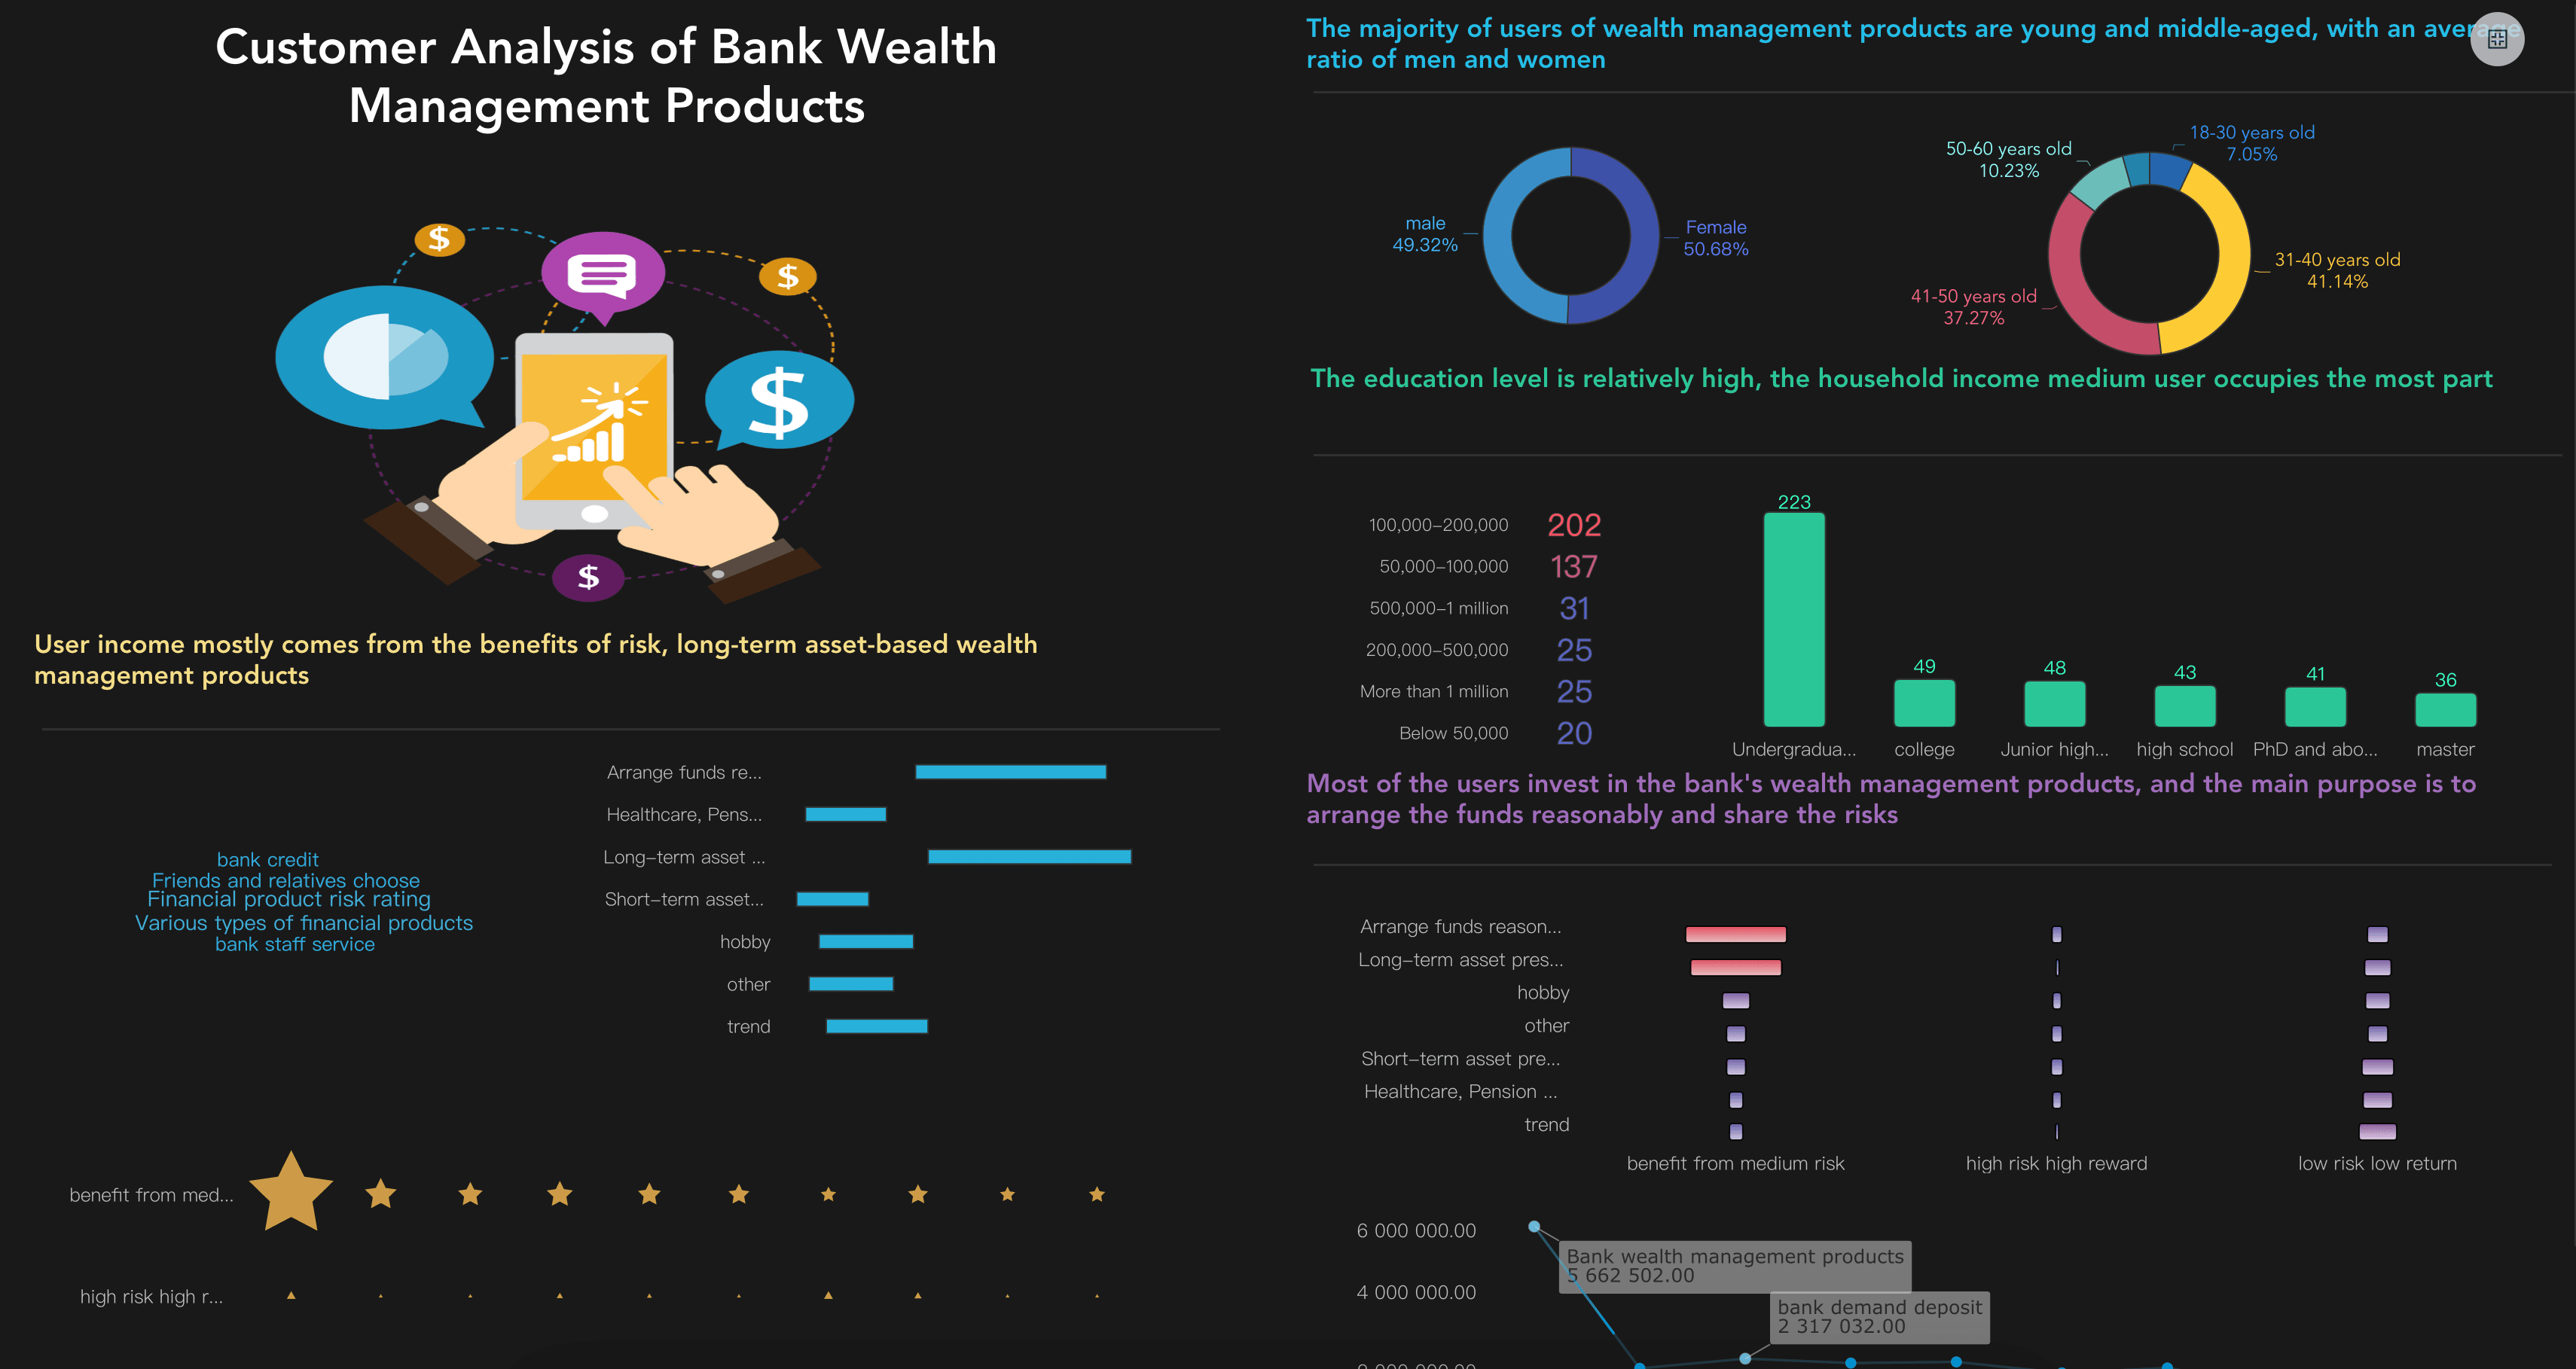
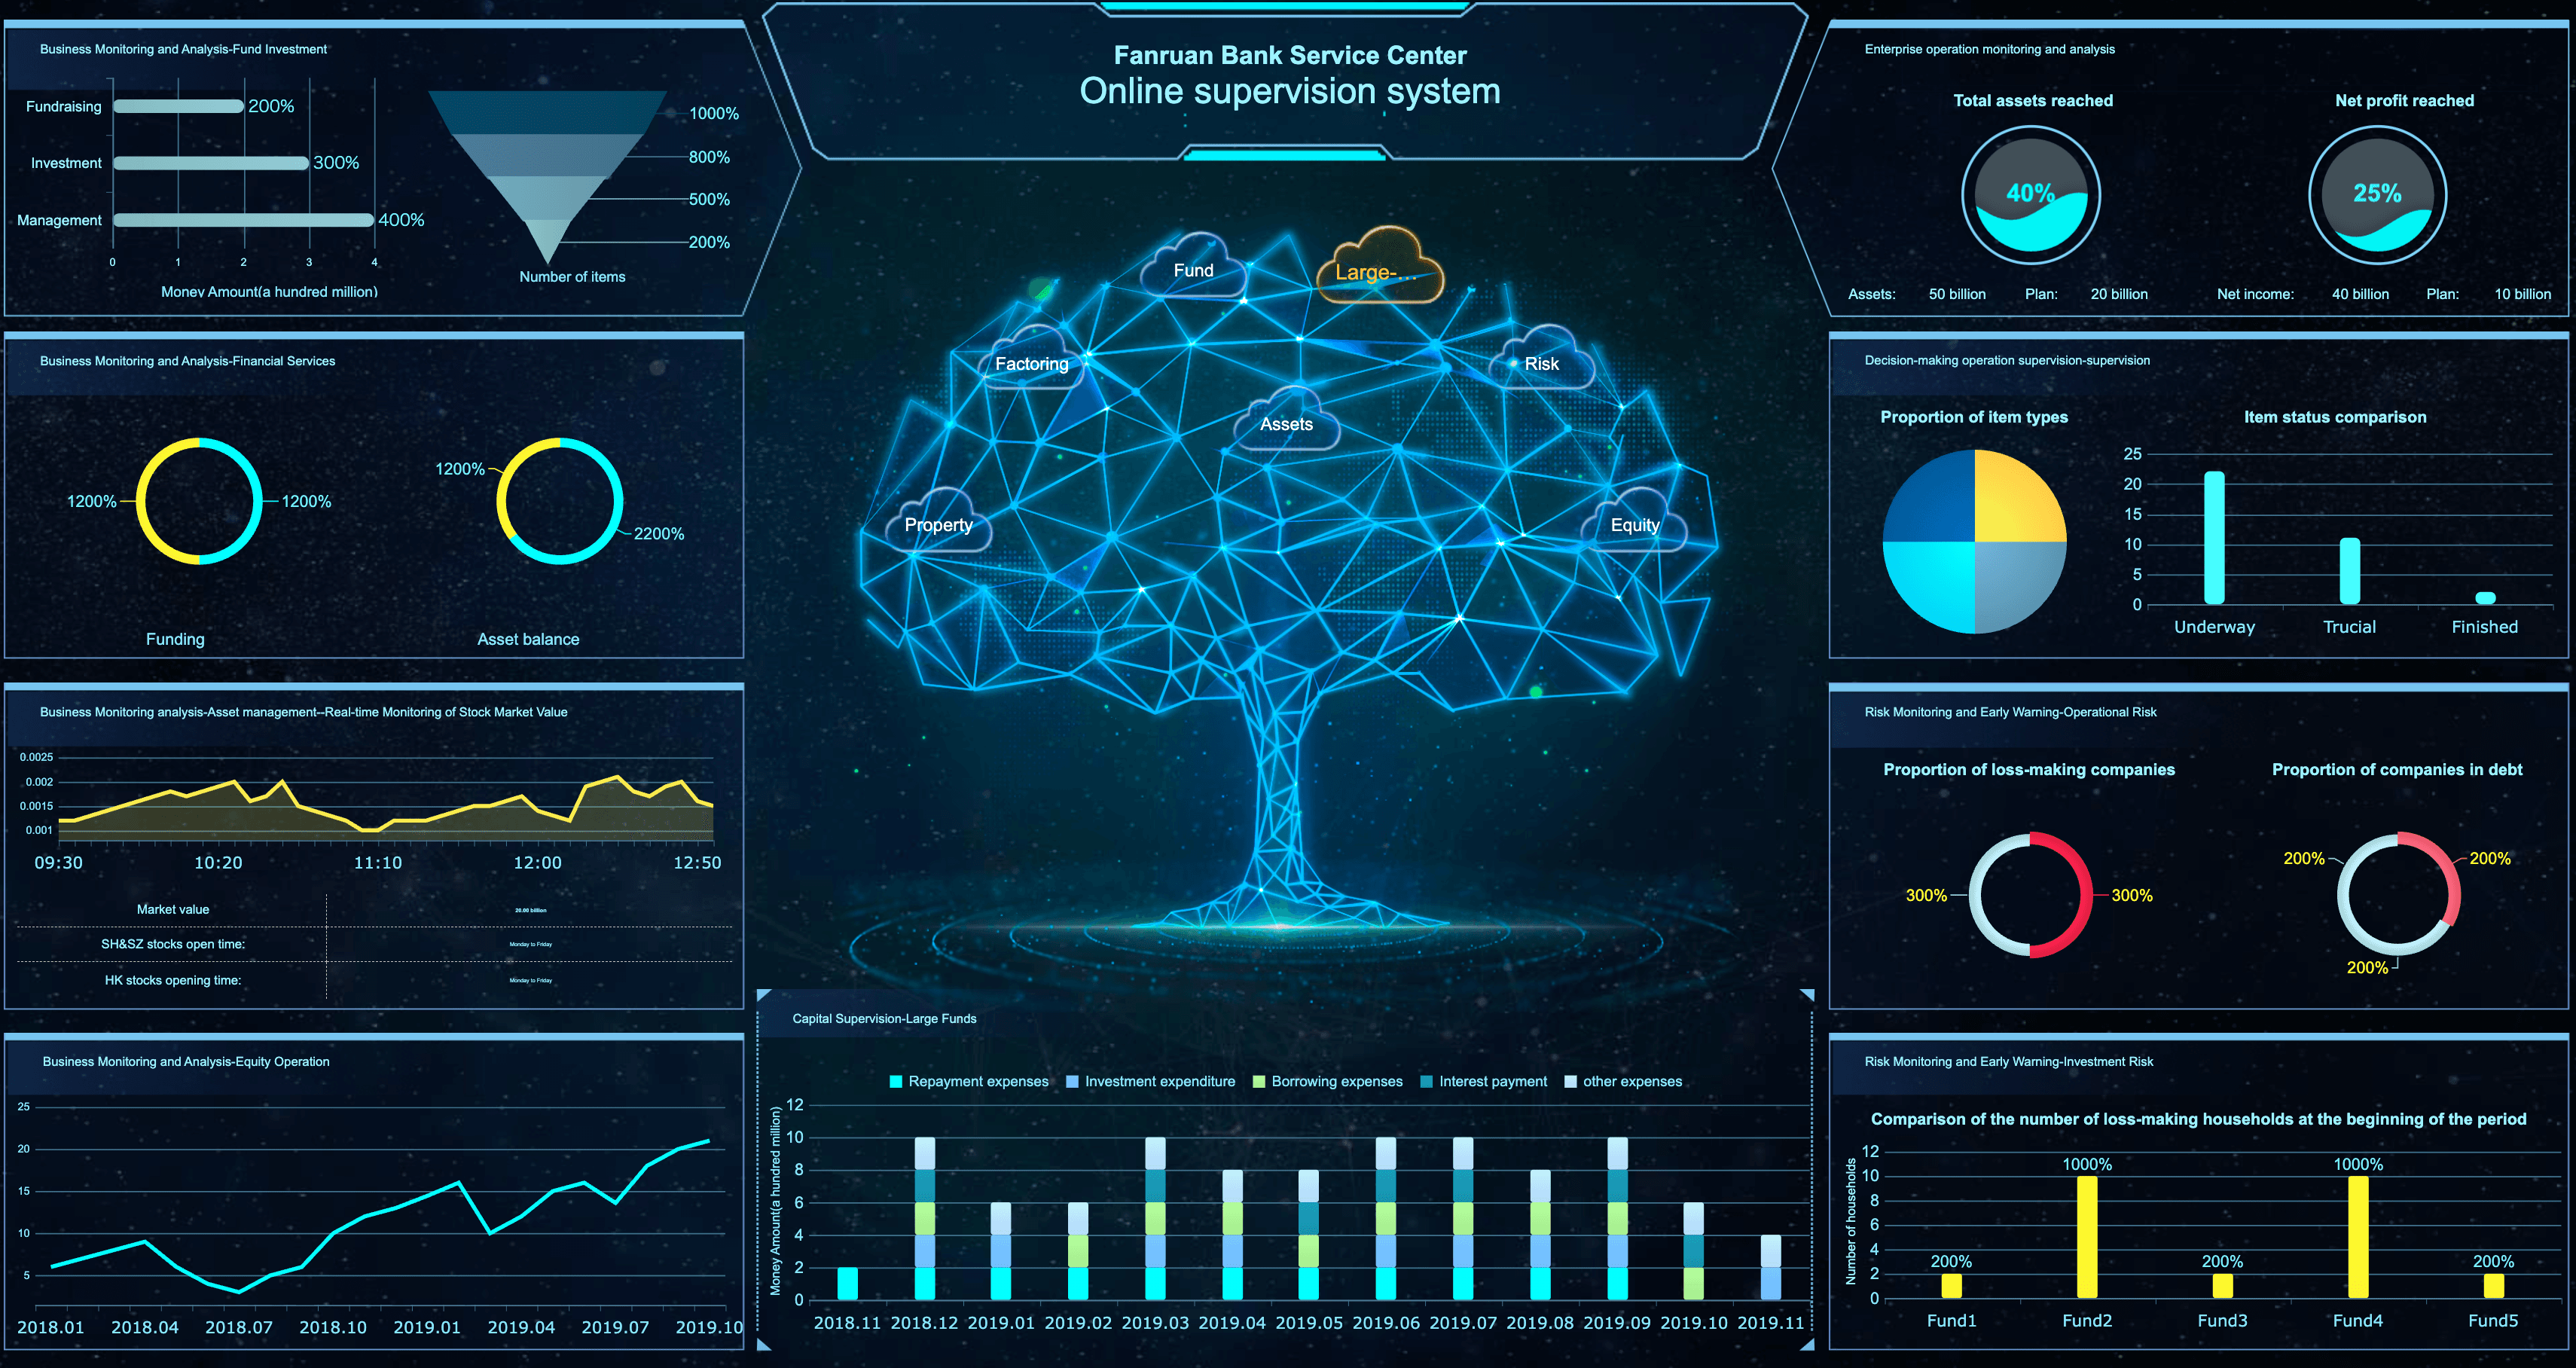
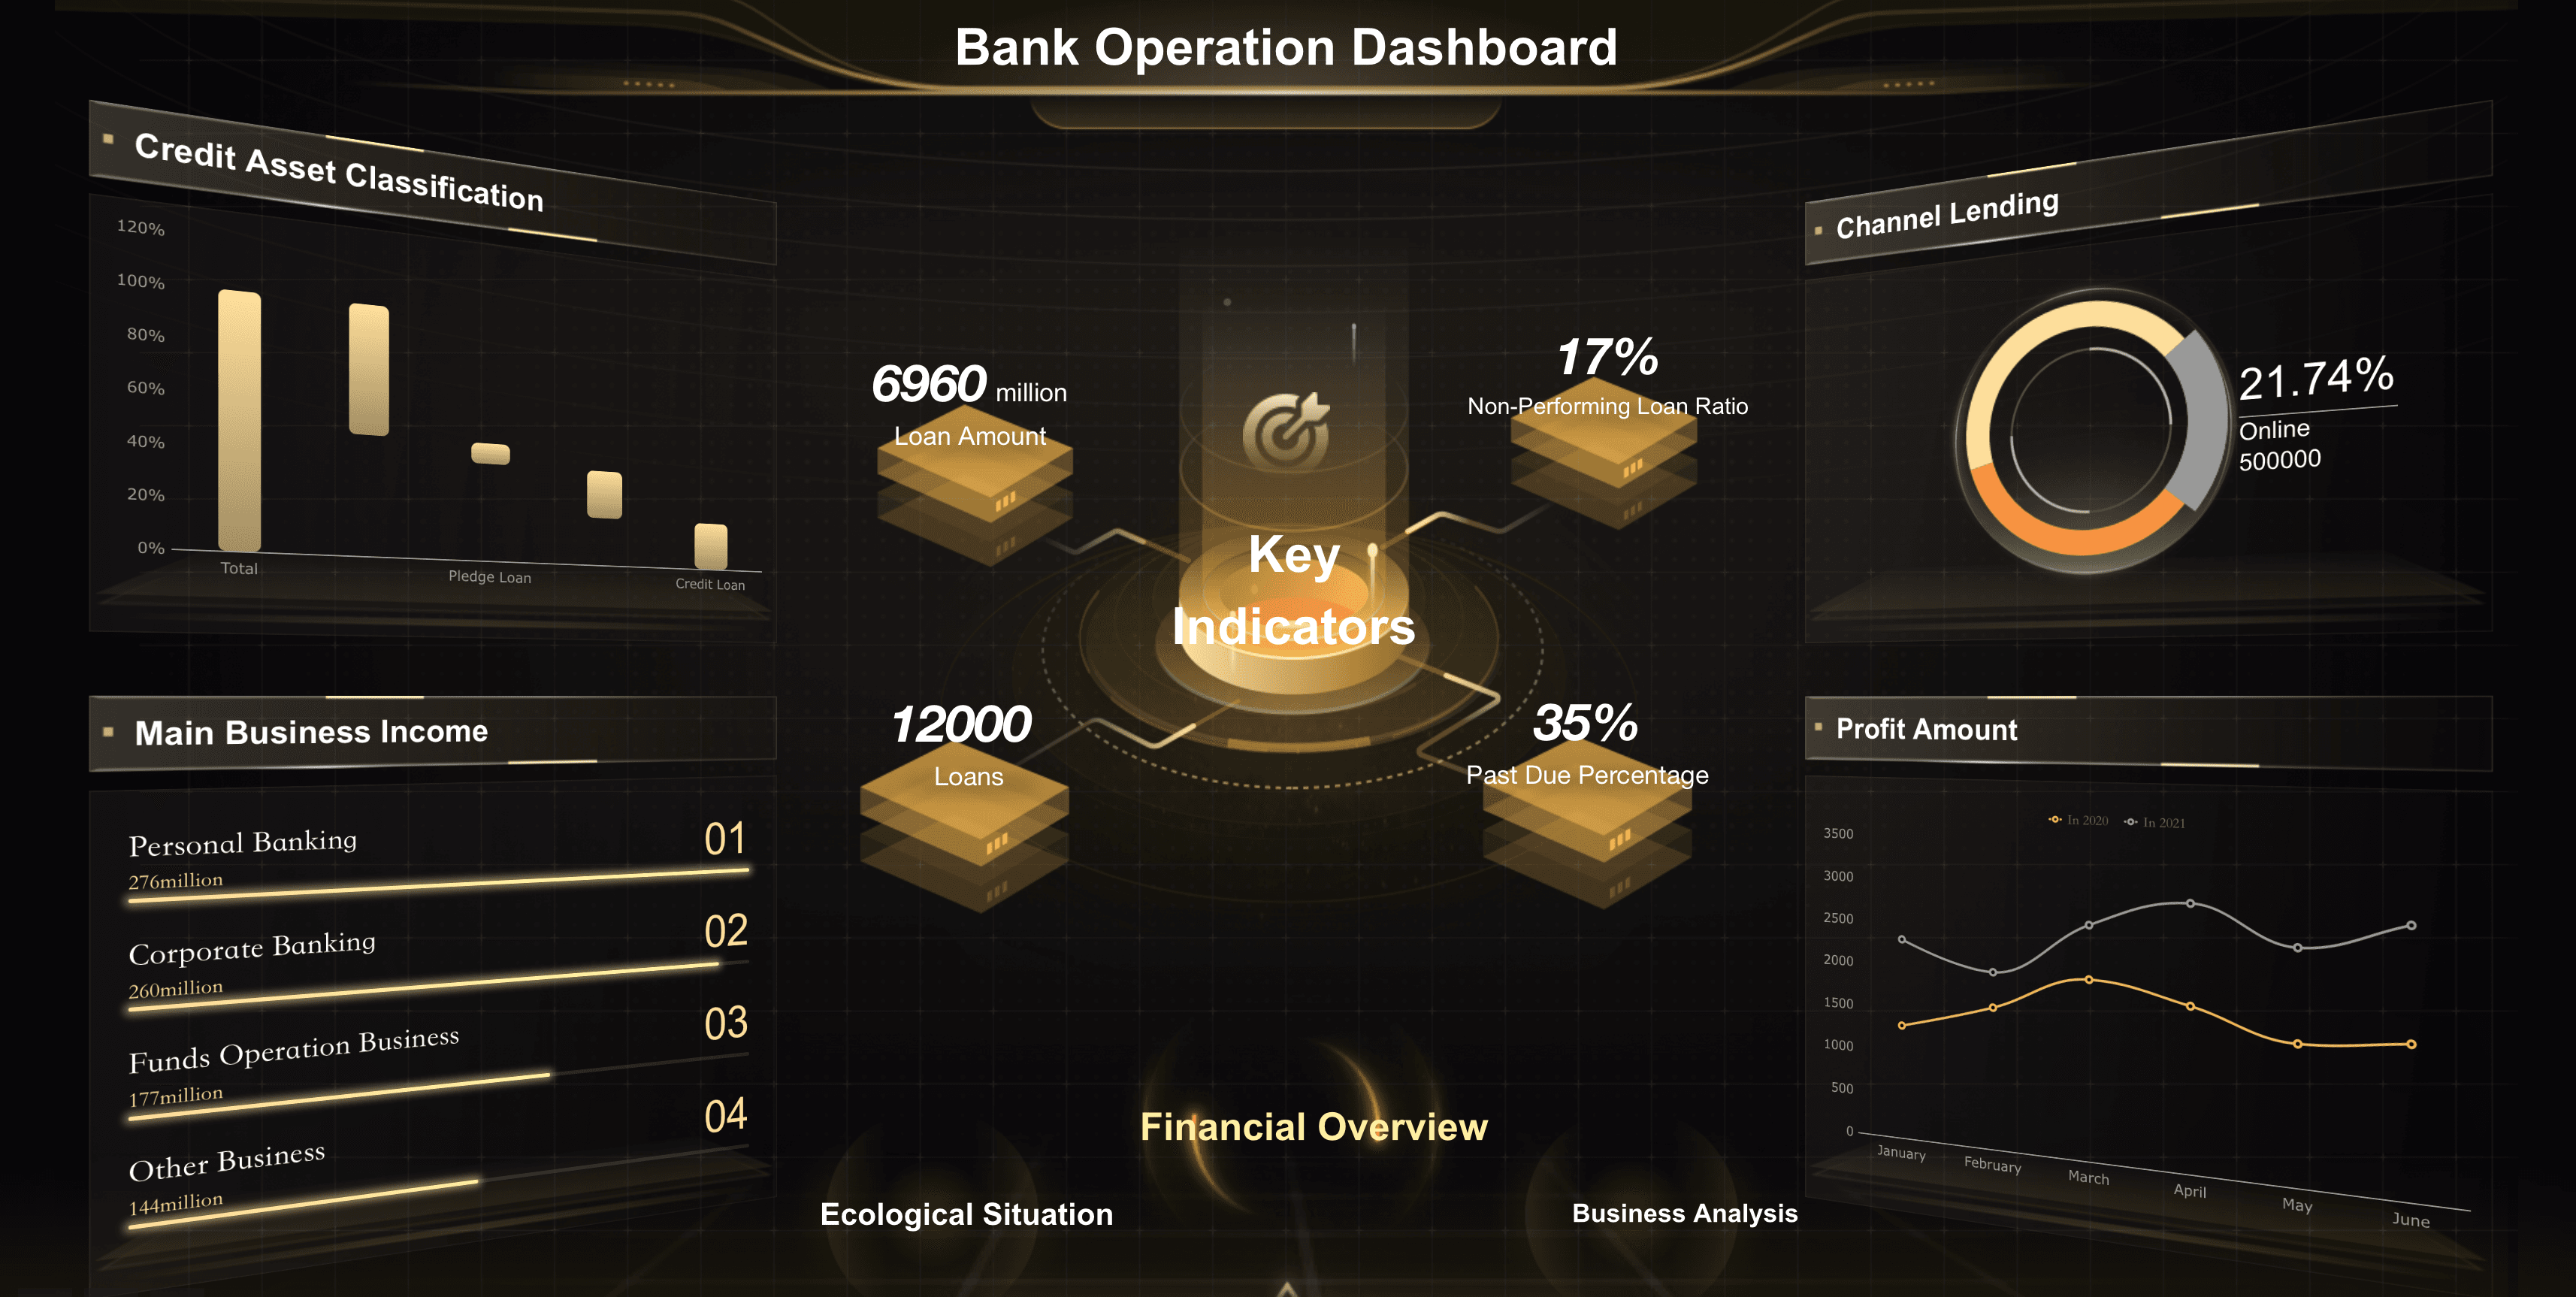
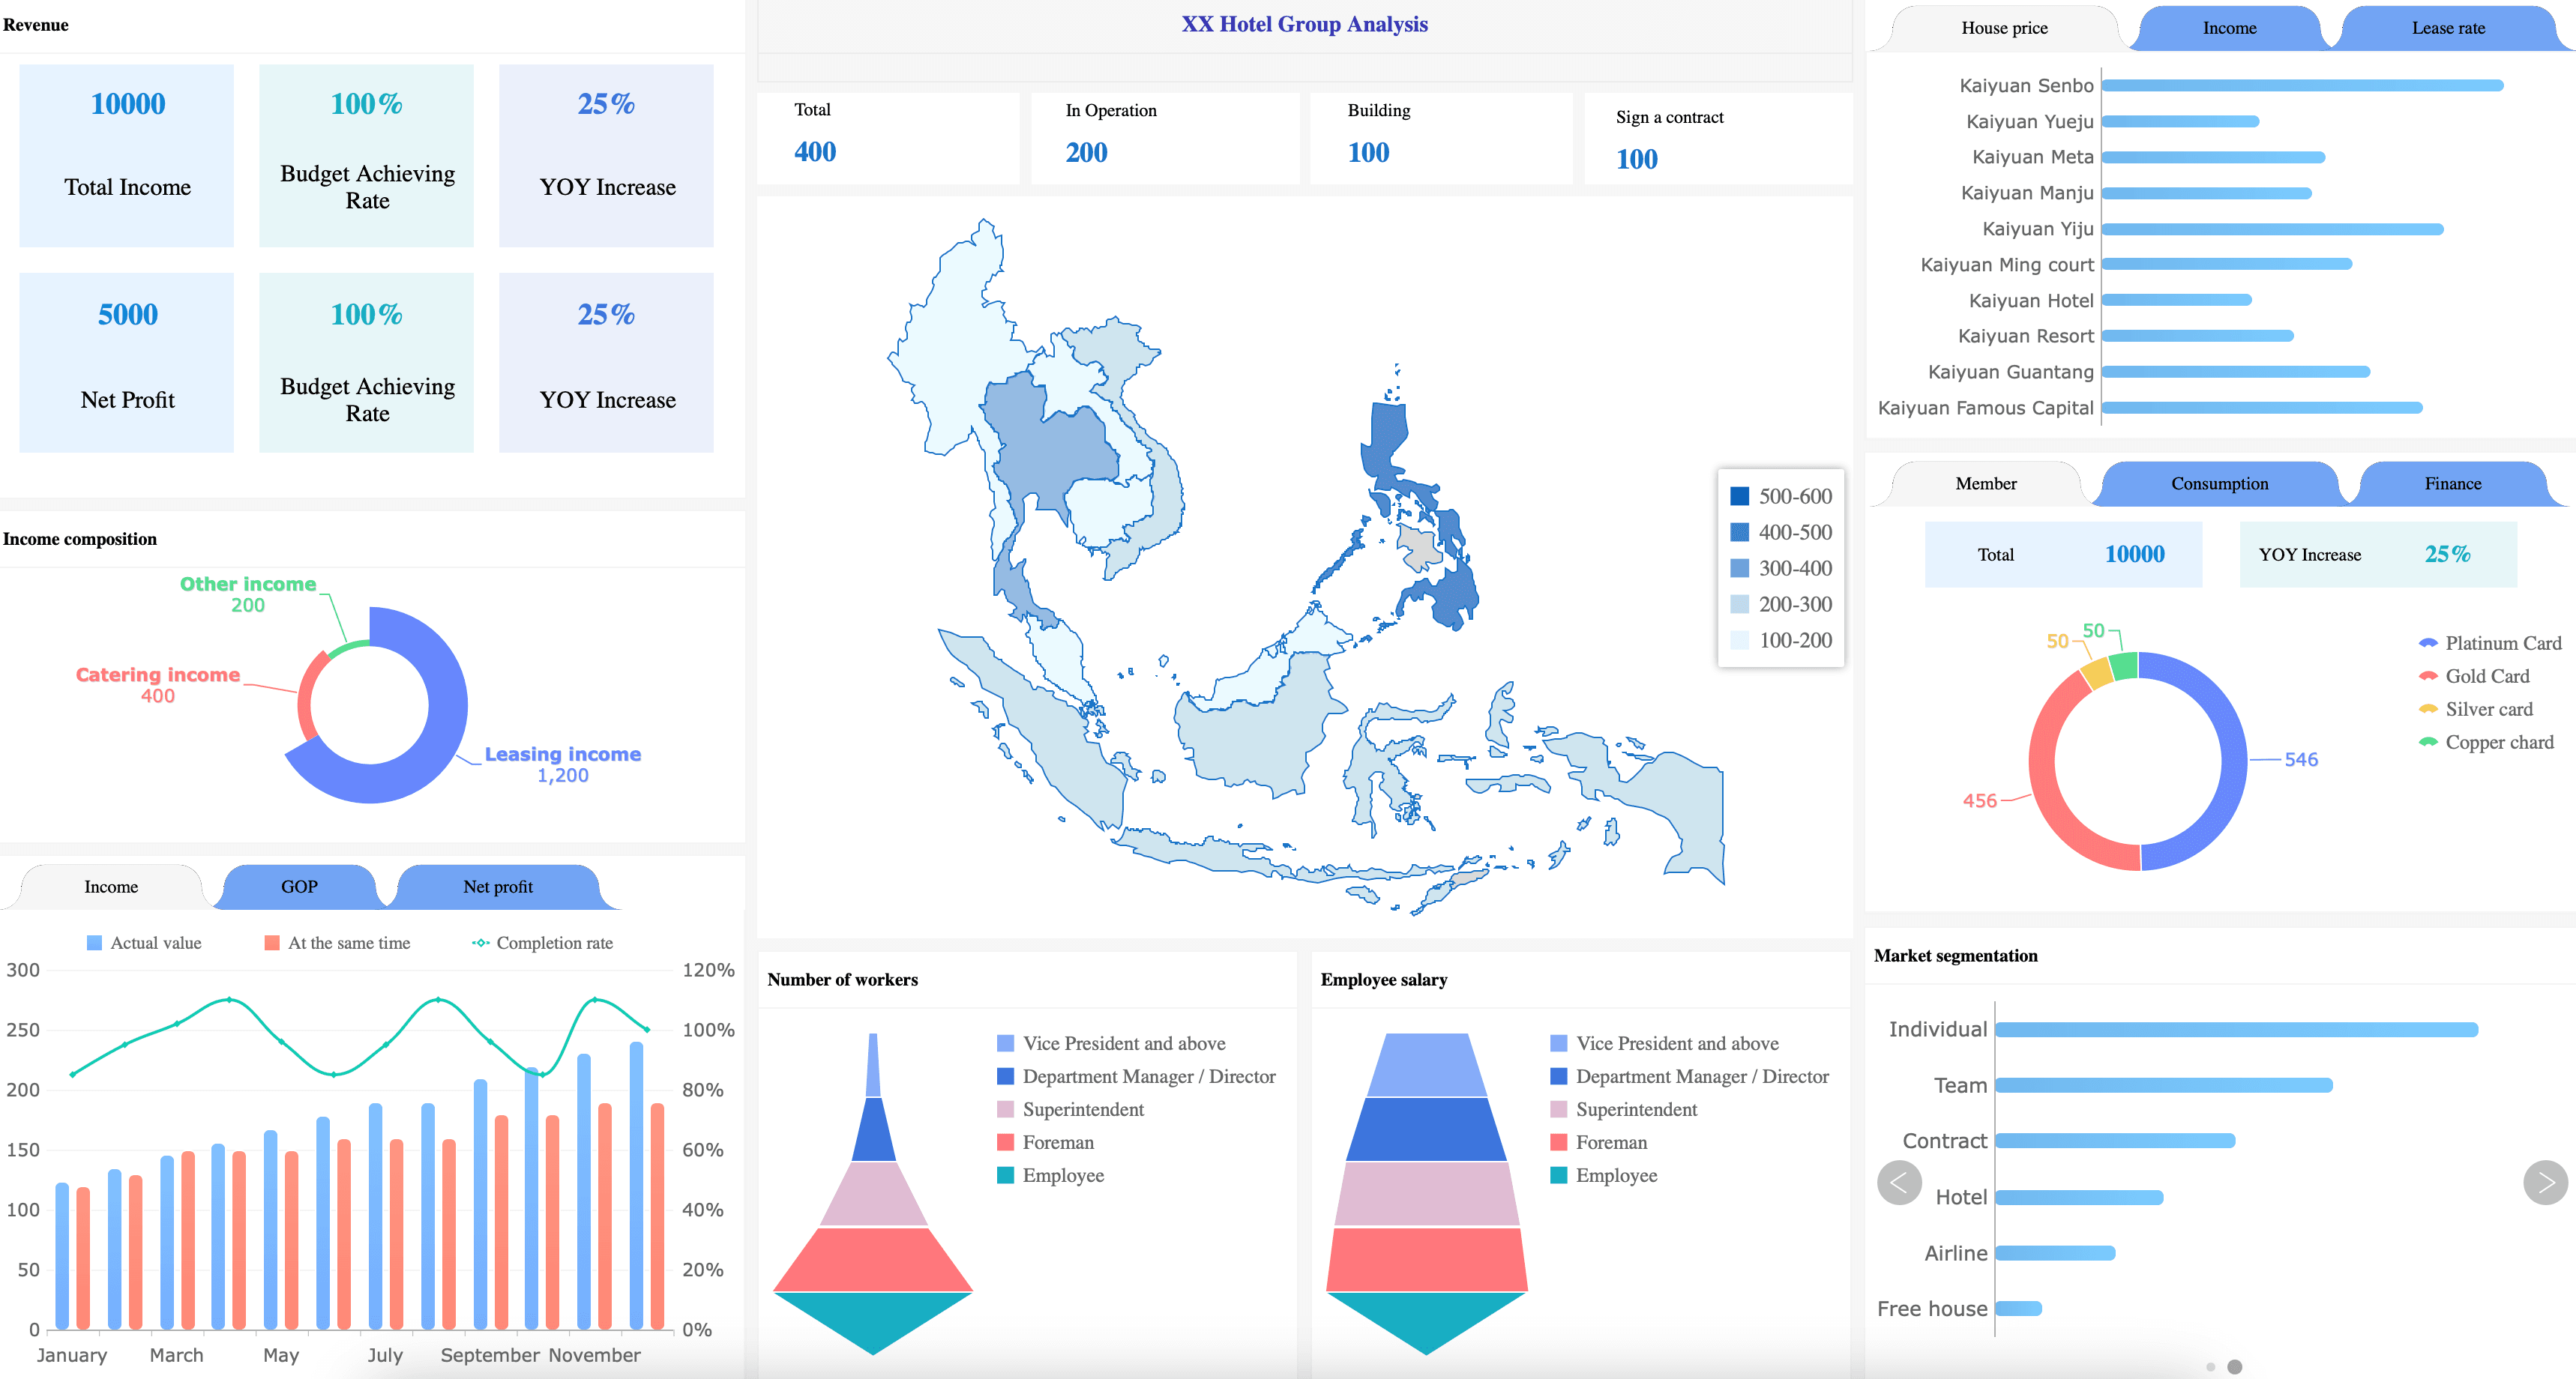
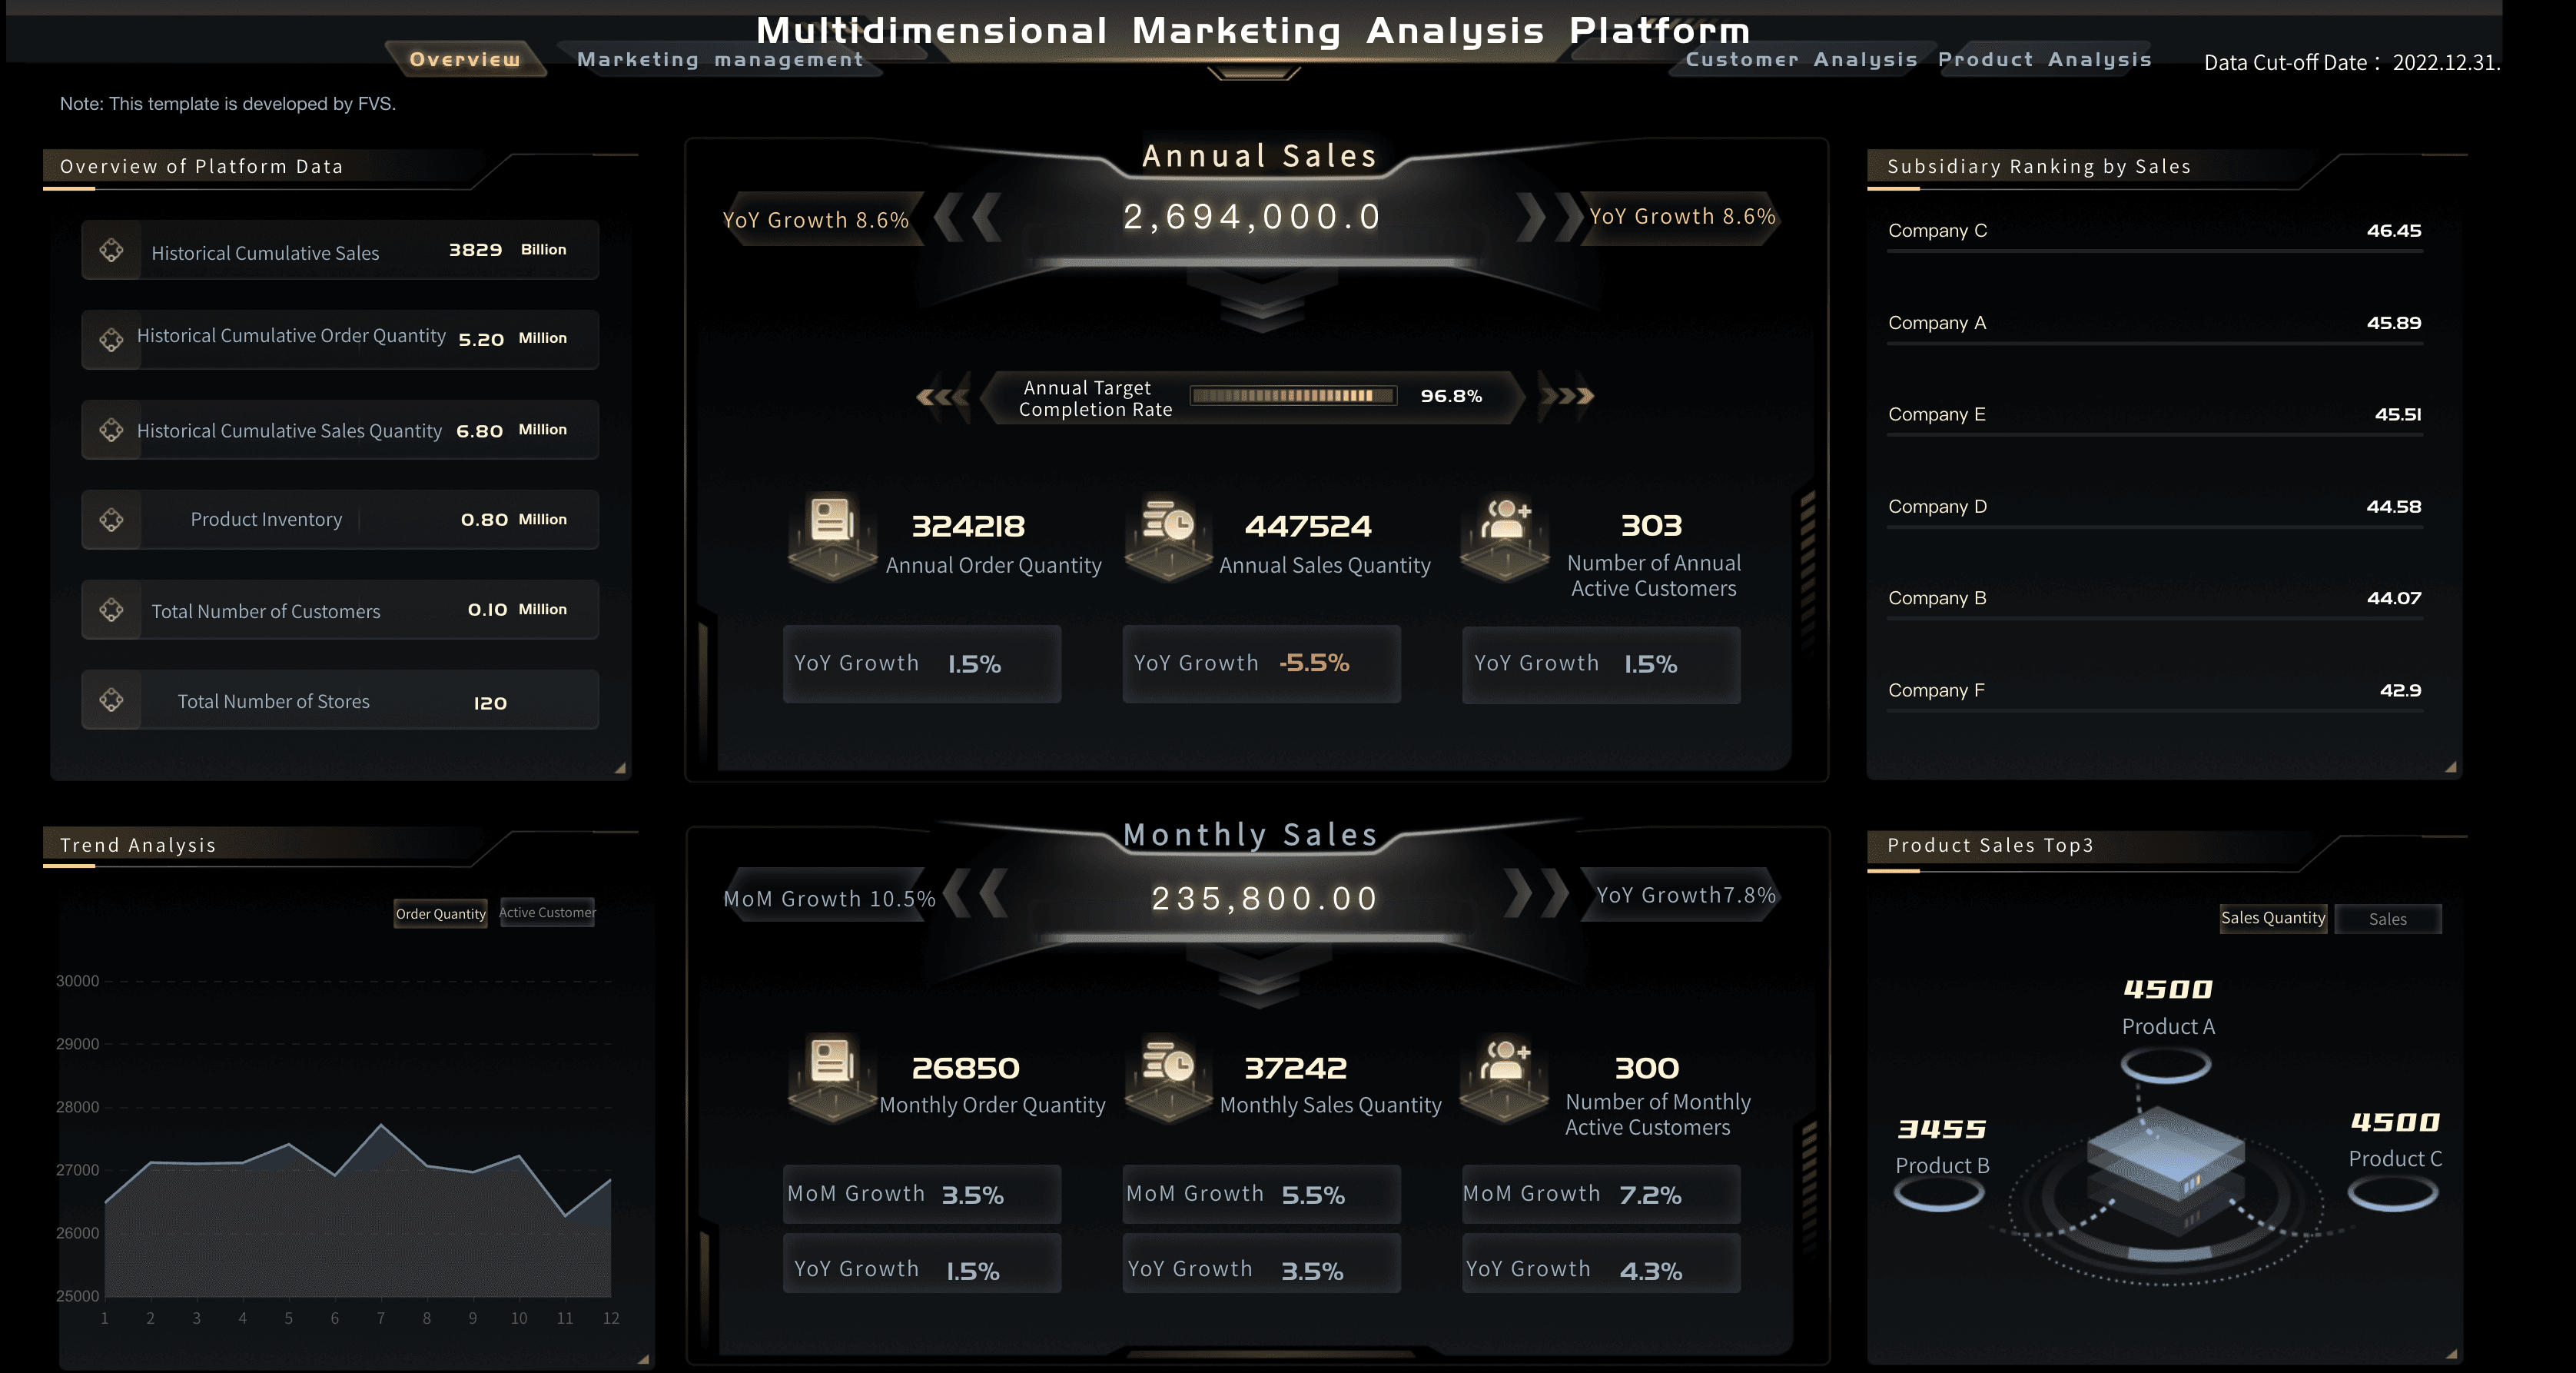
Financial Services Dashboard Examples
Banking and wealth management leaders need to track the financial indicators that help them drive institutional profitability and manage risk. Below are essential metrics for a financial kpi dashboard:
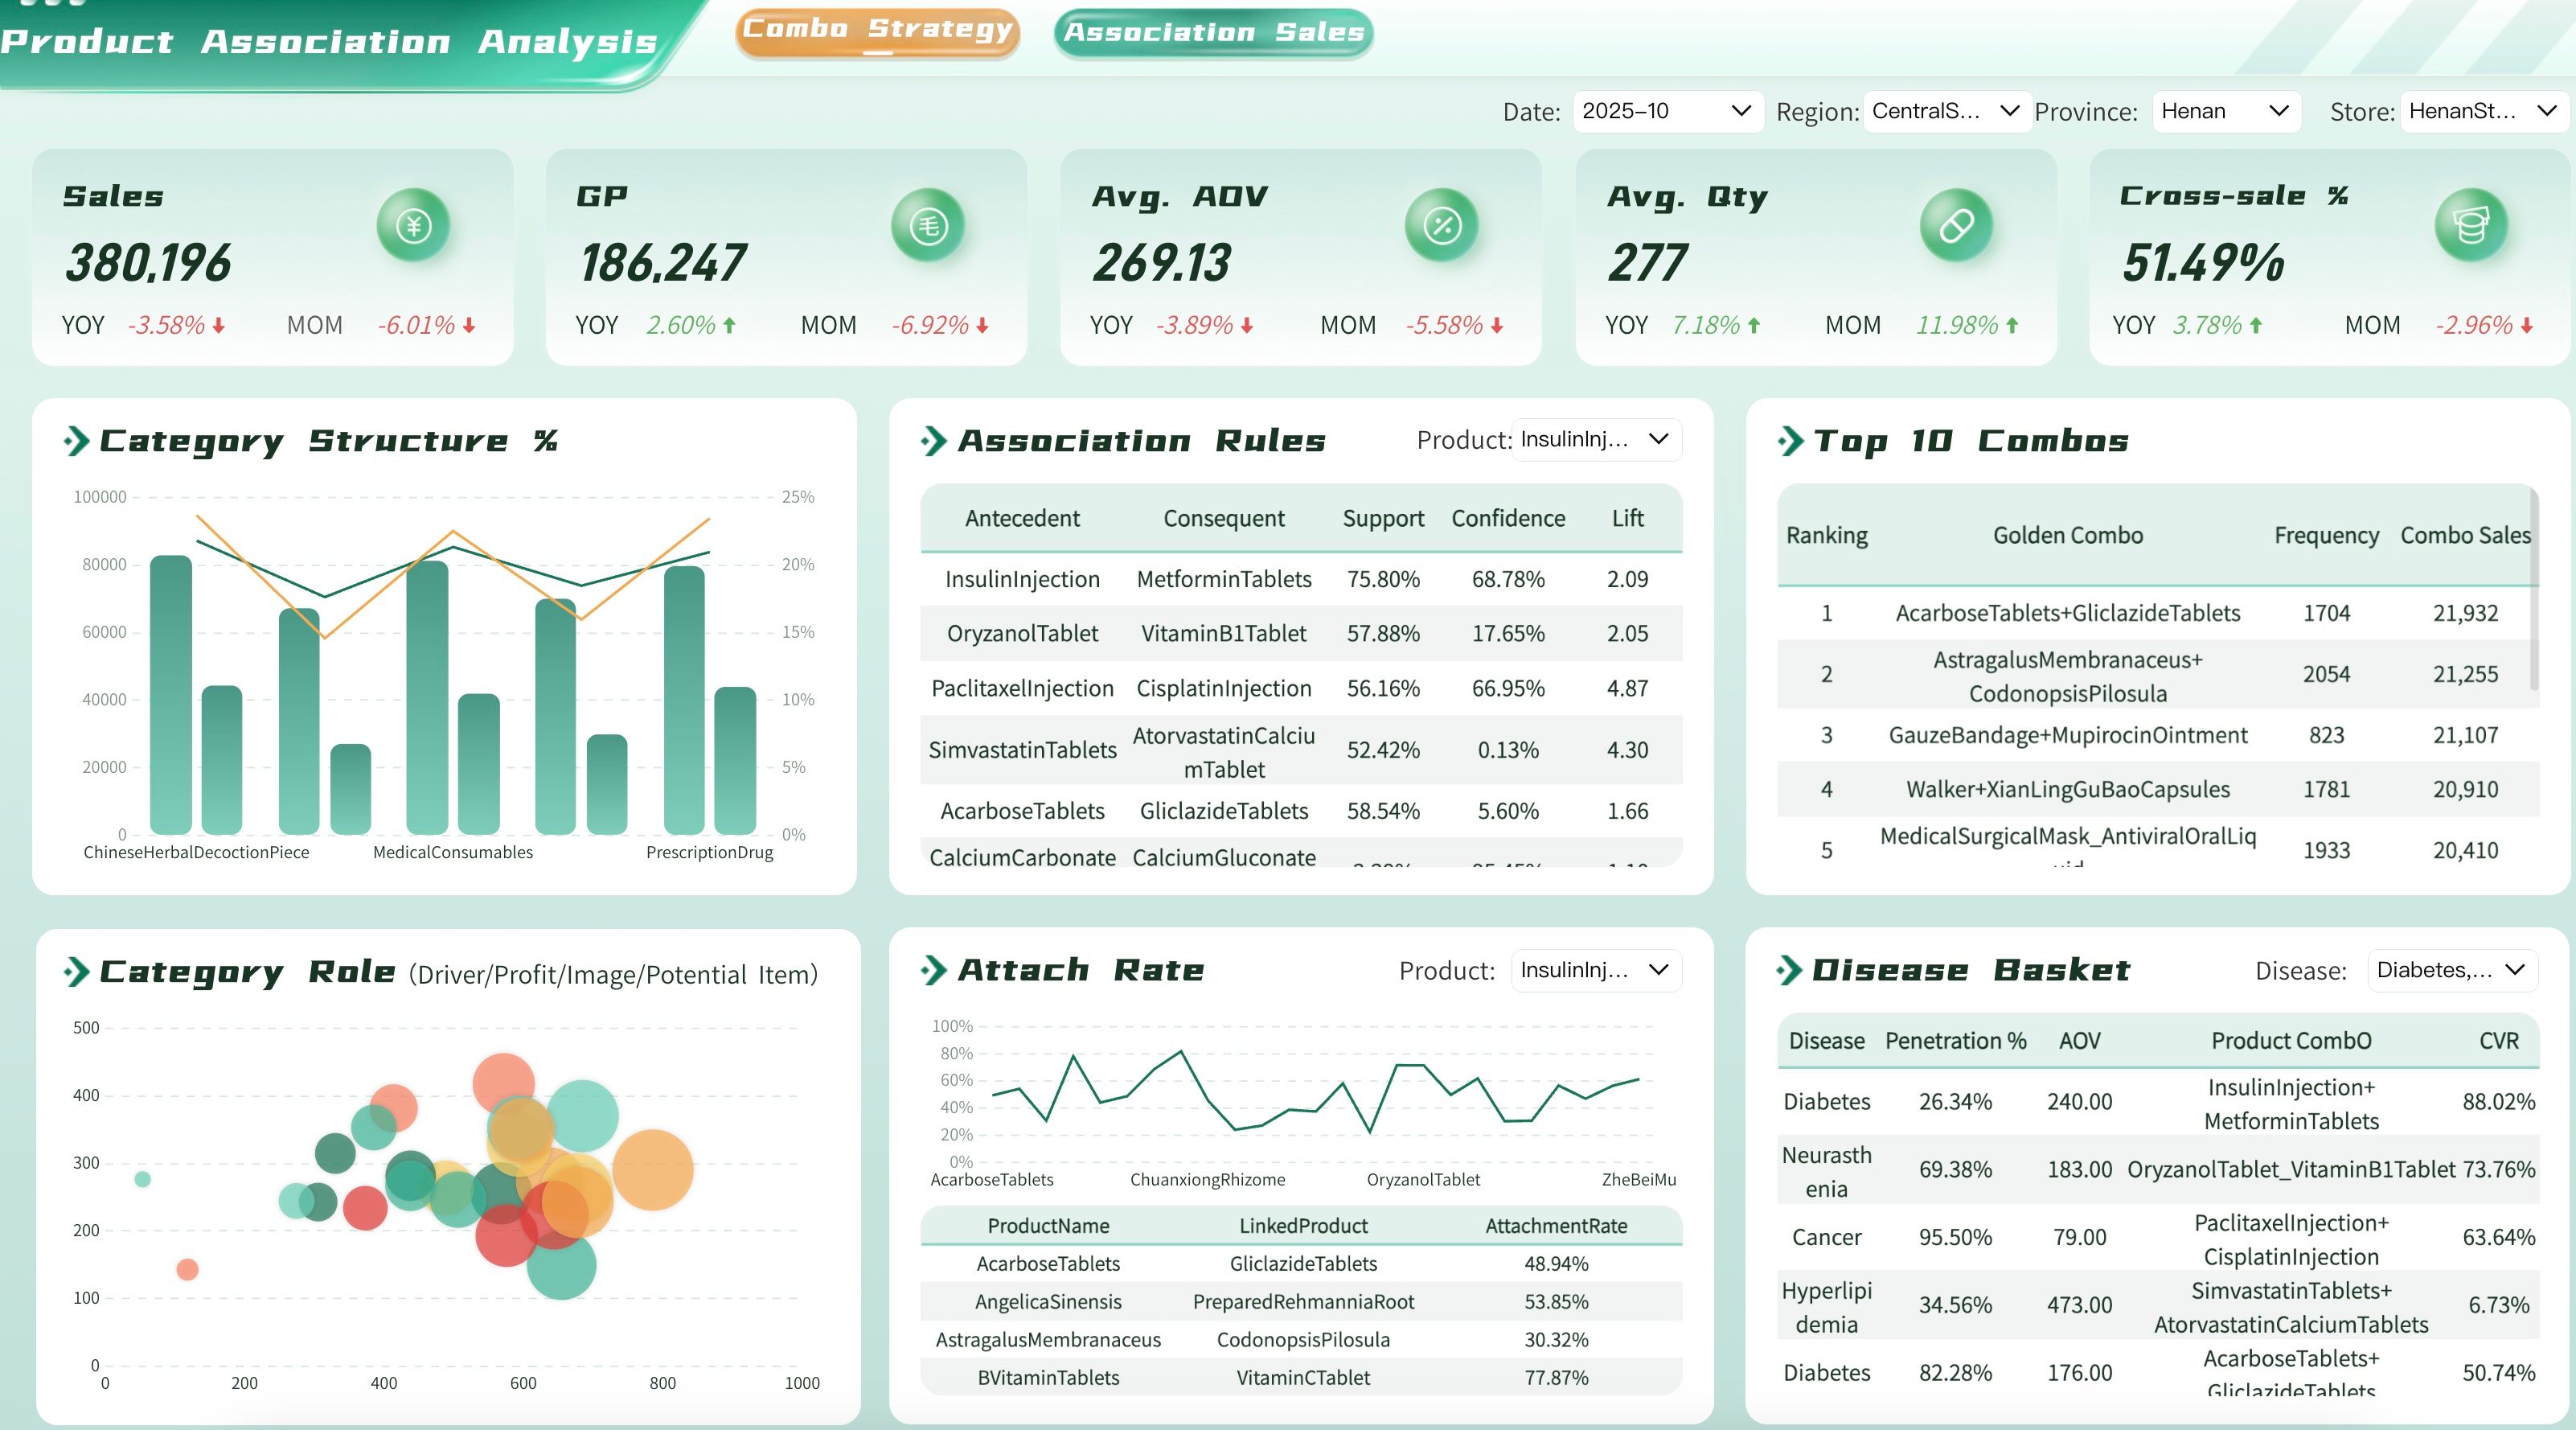
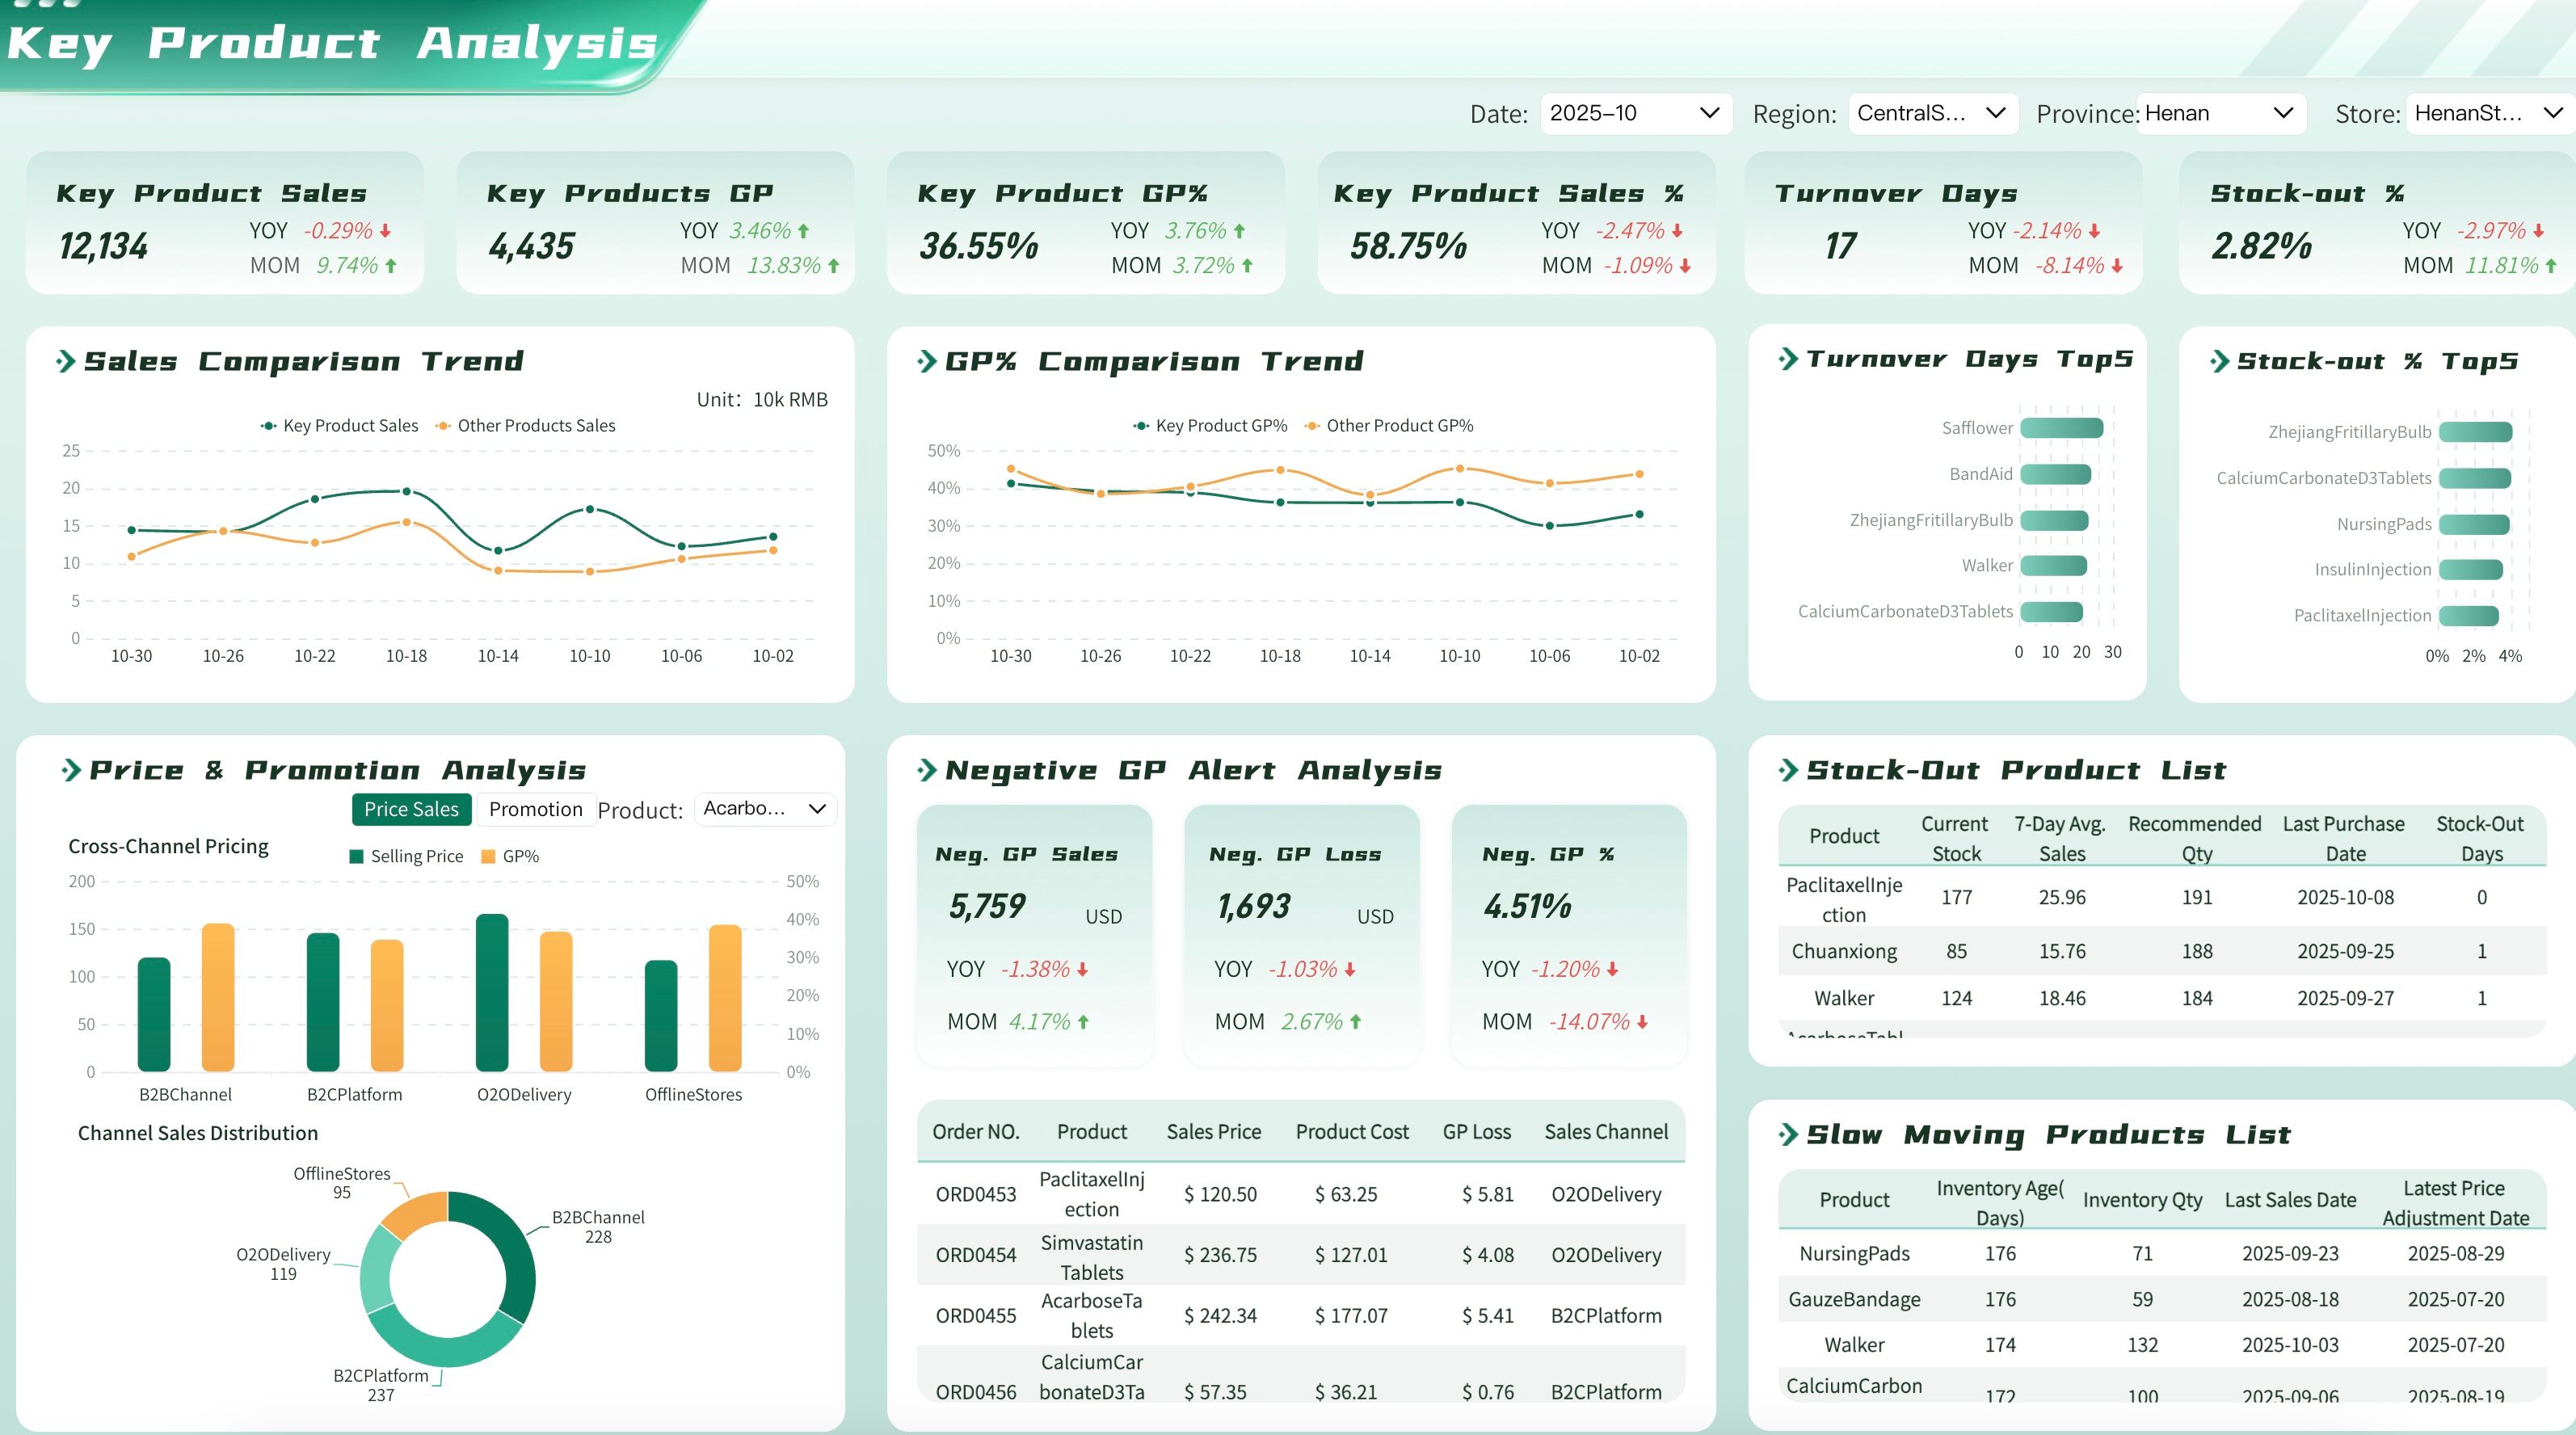
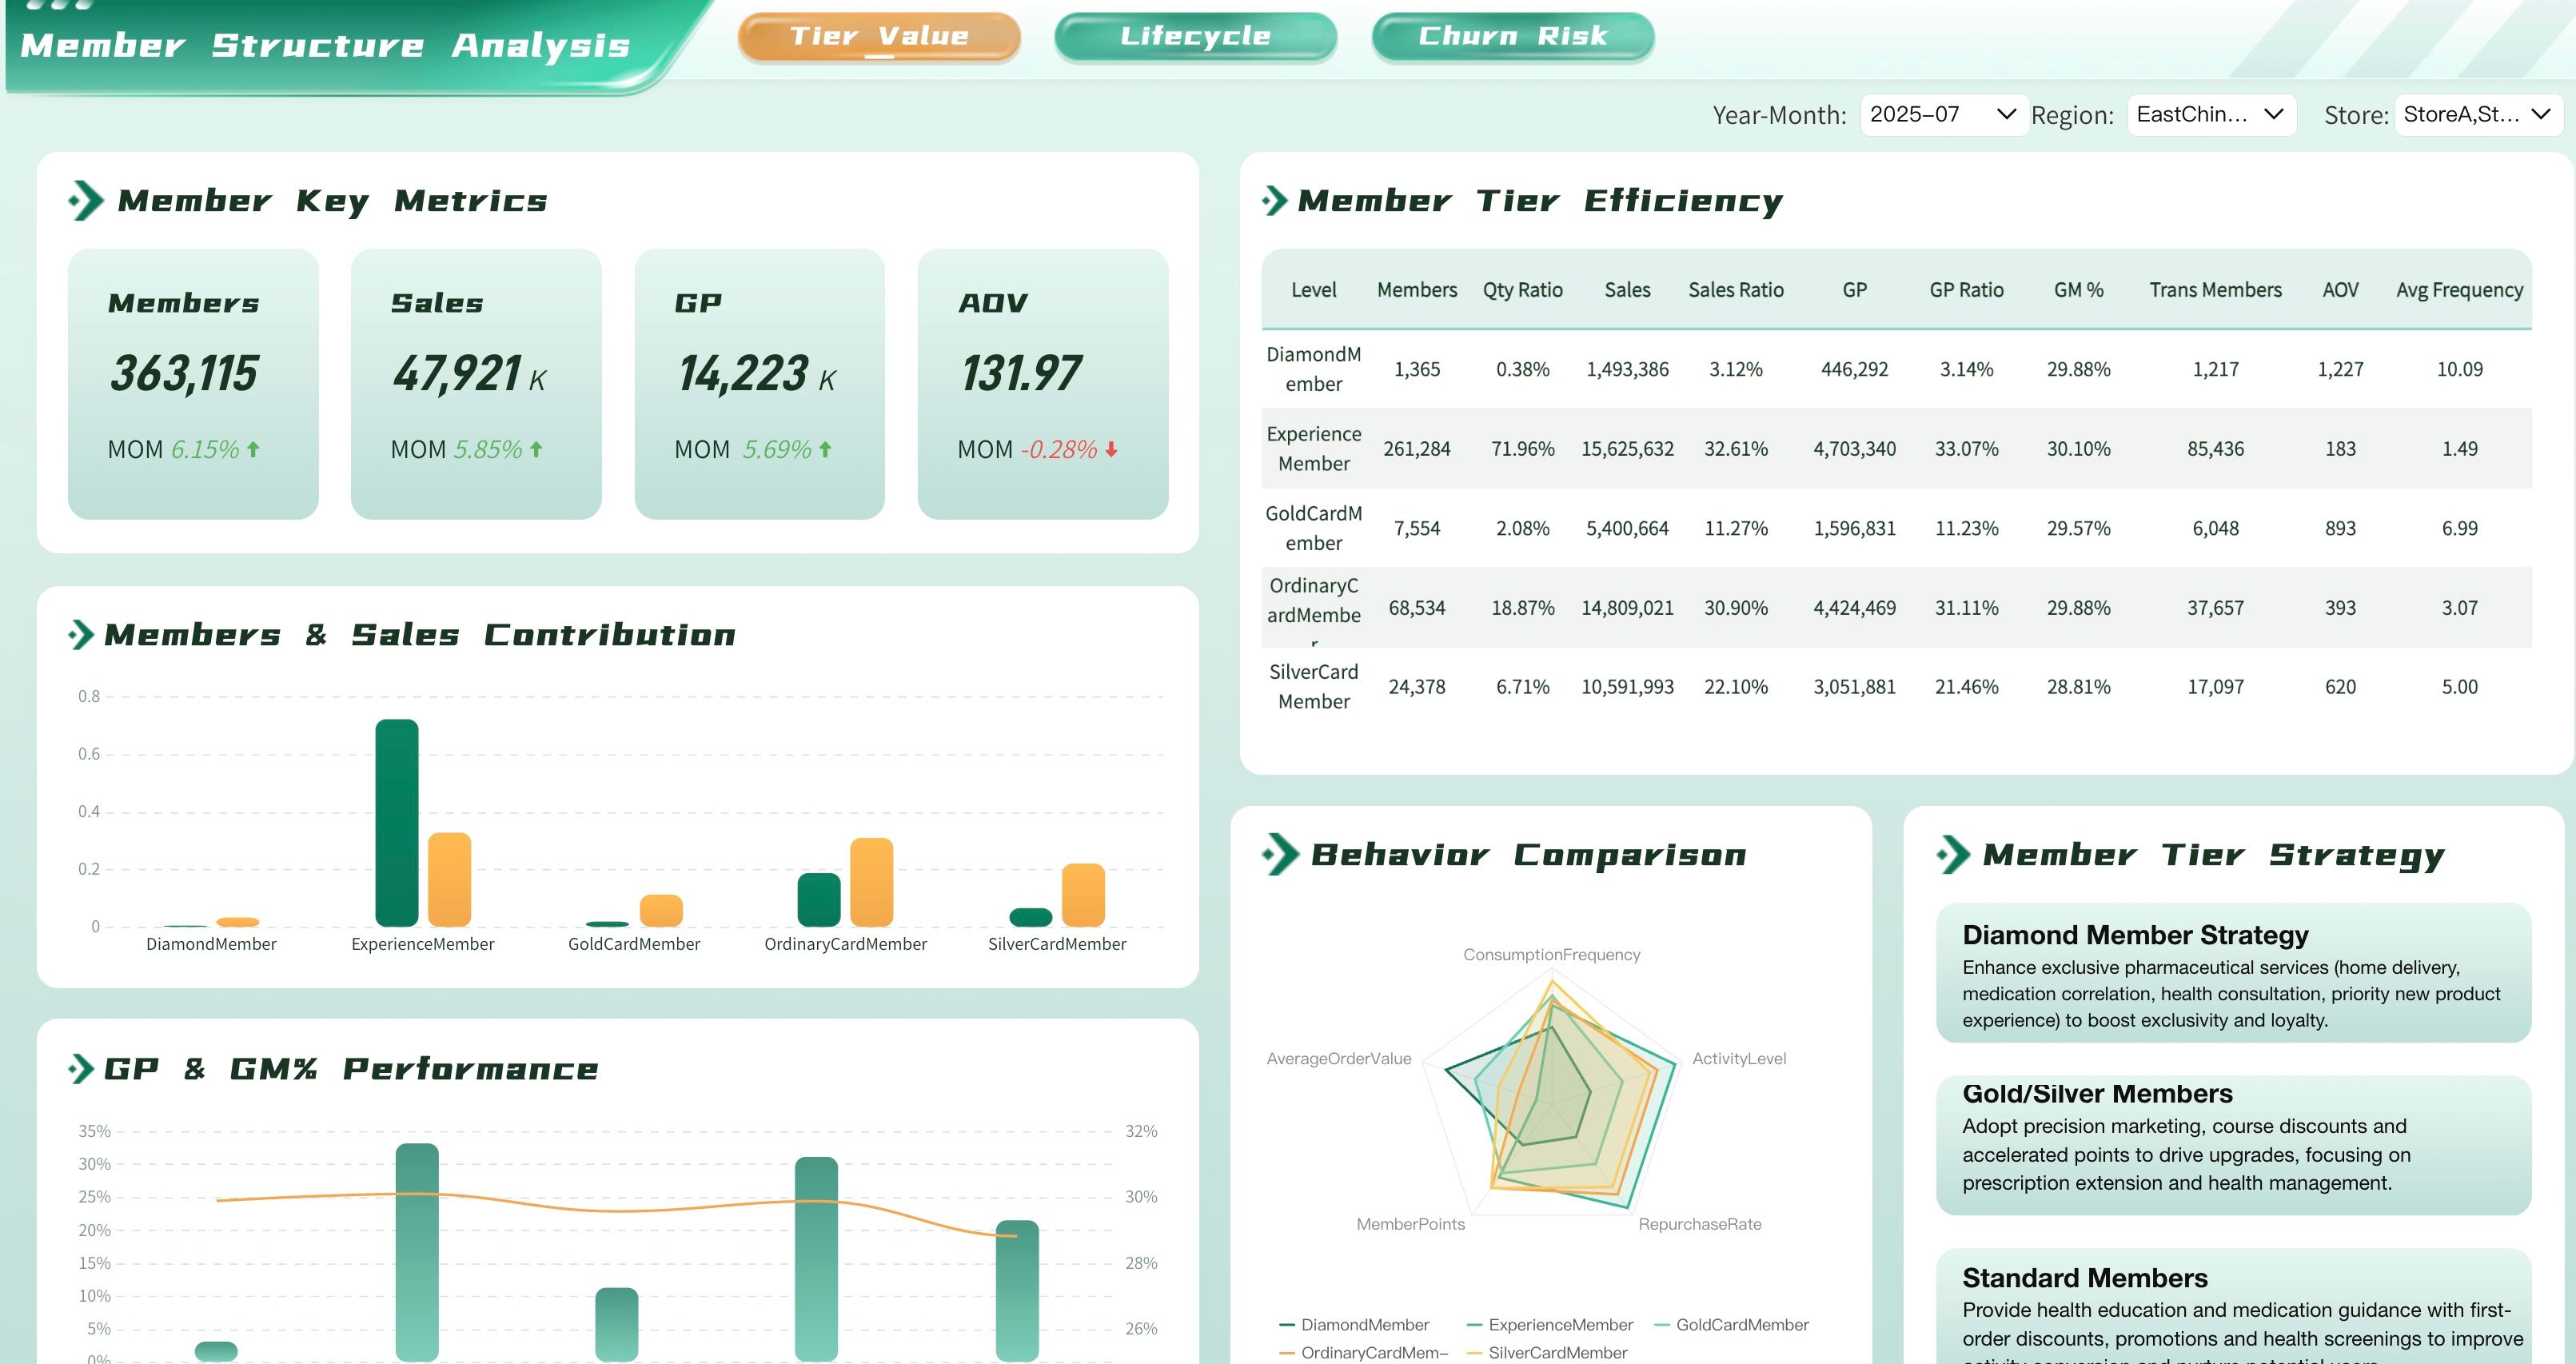
Retail Dashboard Examples
Store managers and retail executives need to track the key performance indicators that help them maximize sales and manage inventory effectively. Below are essential metrics for a retail business dashboard:
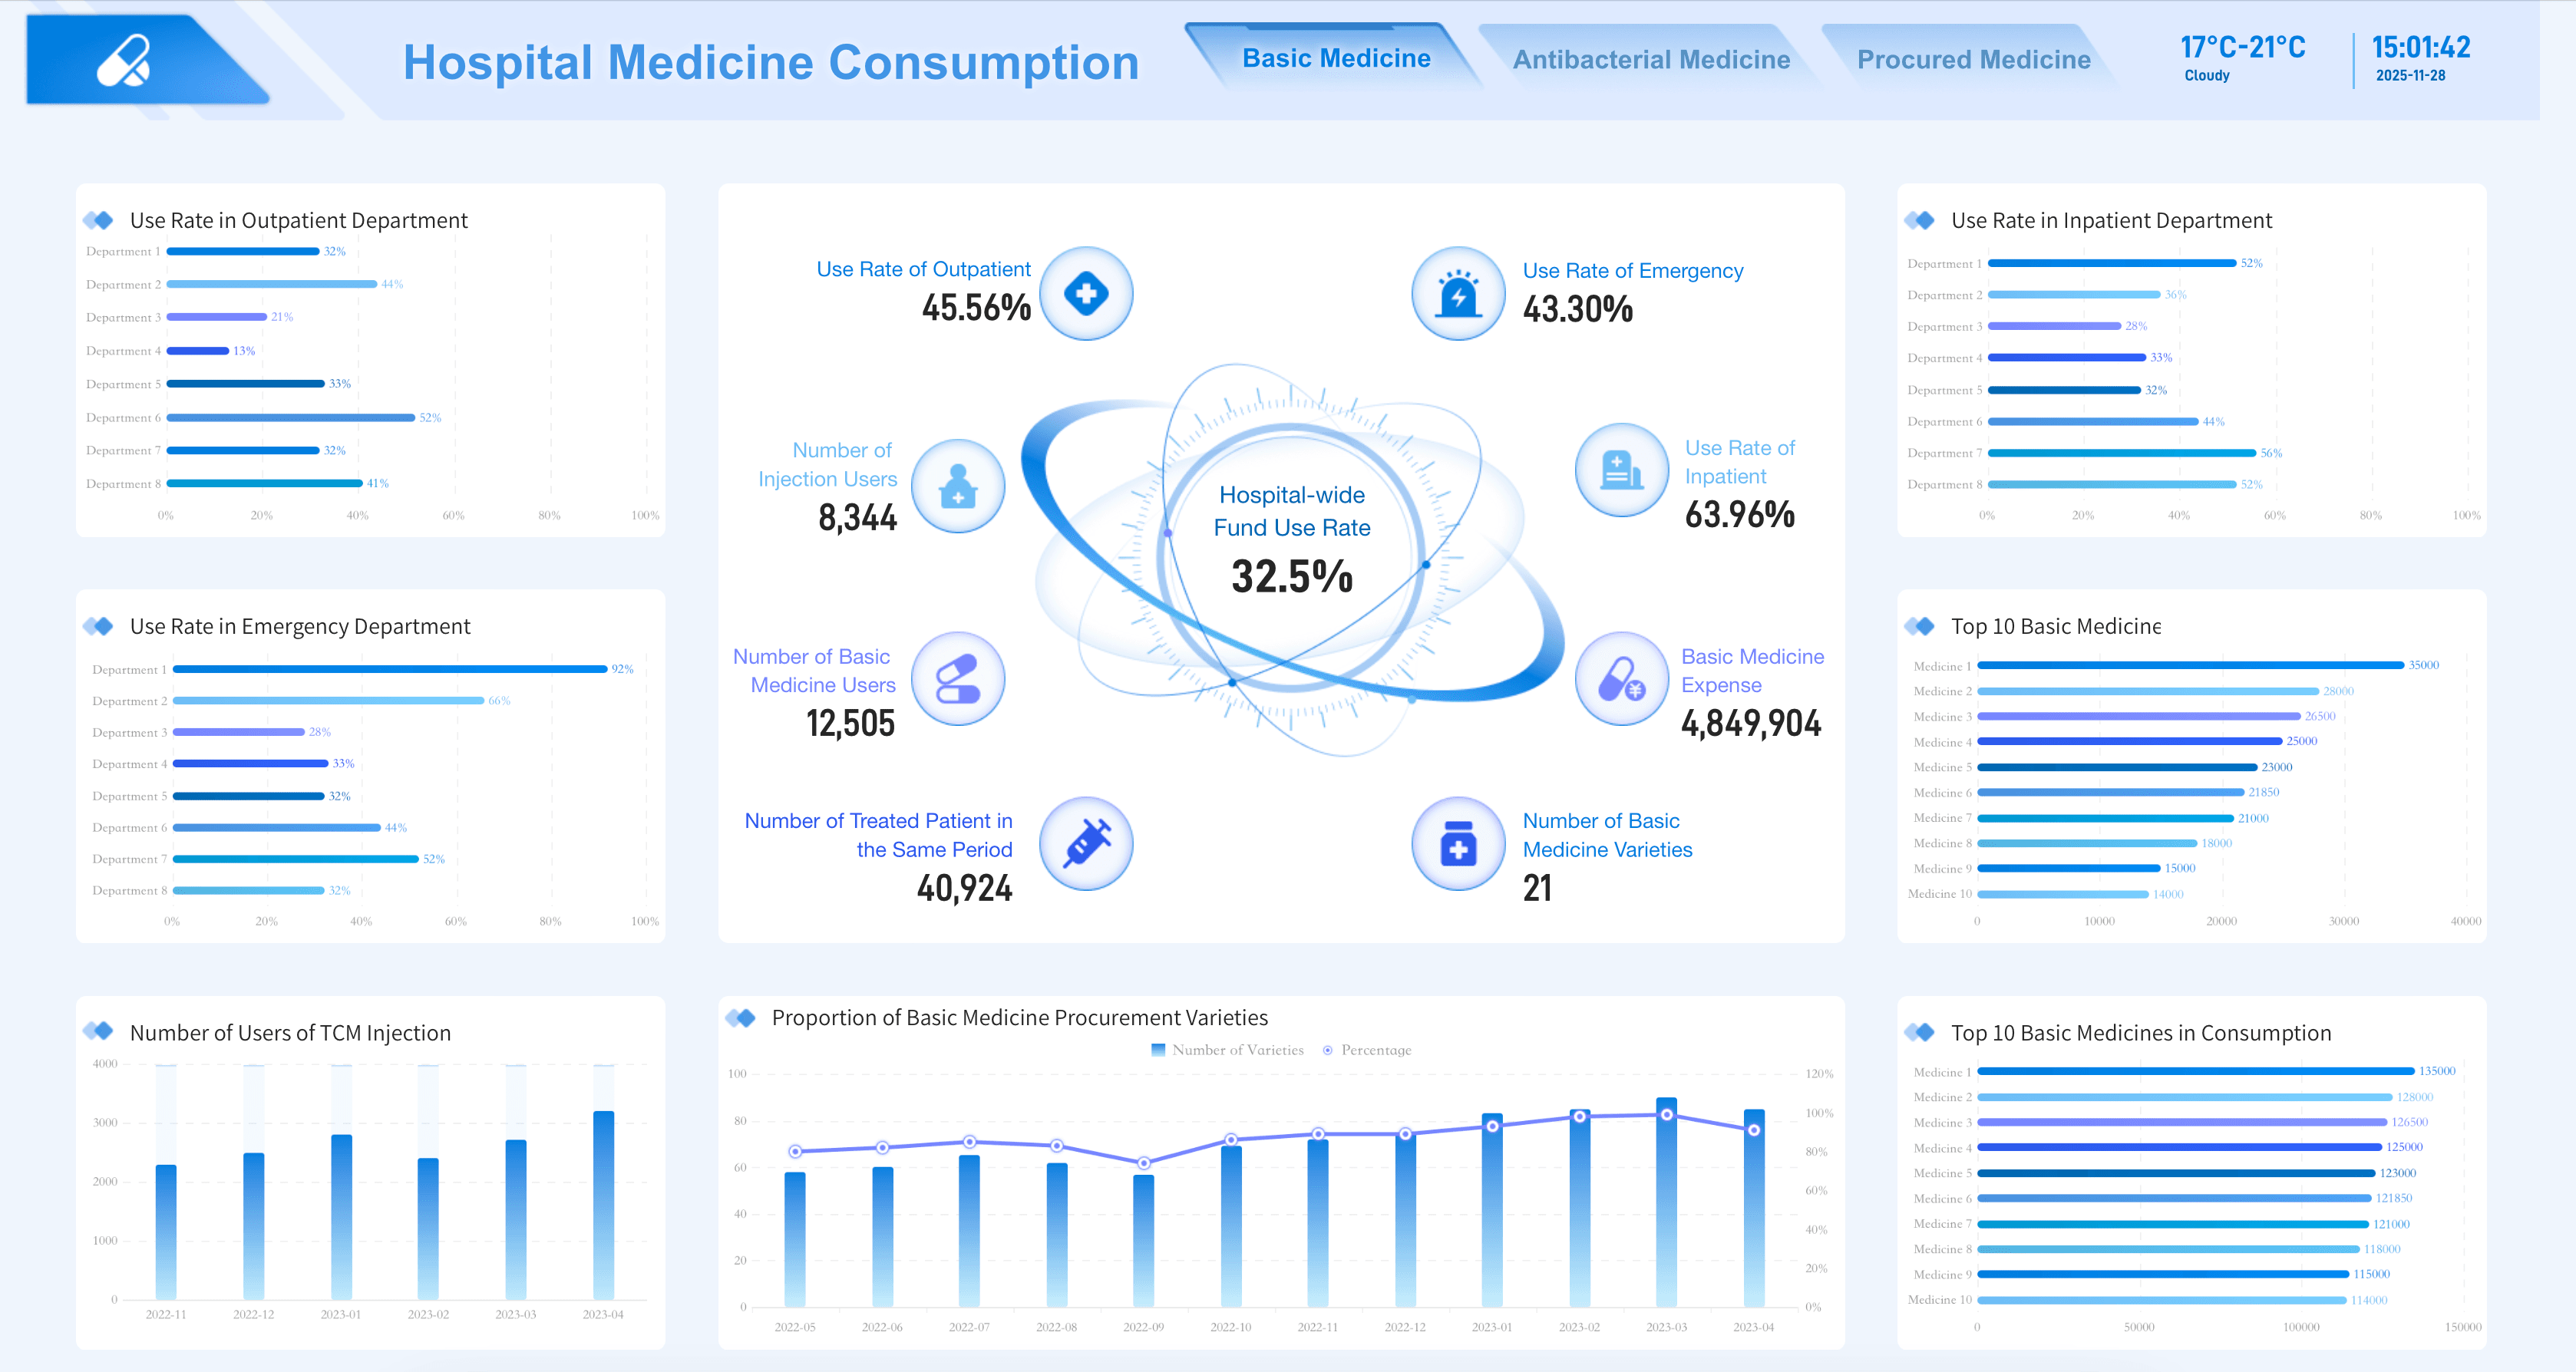
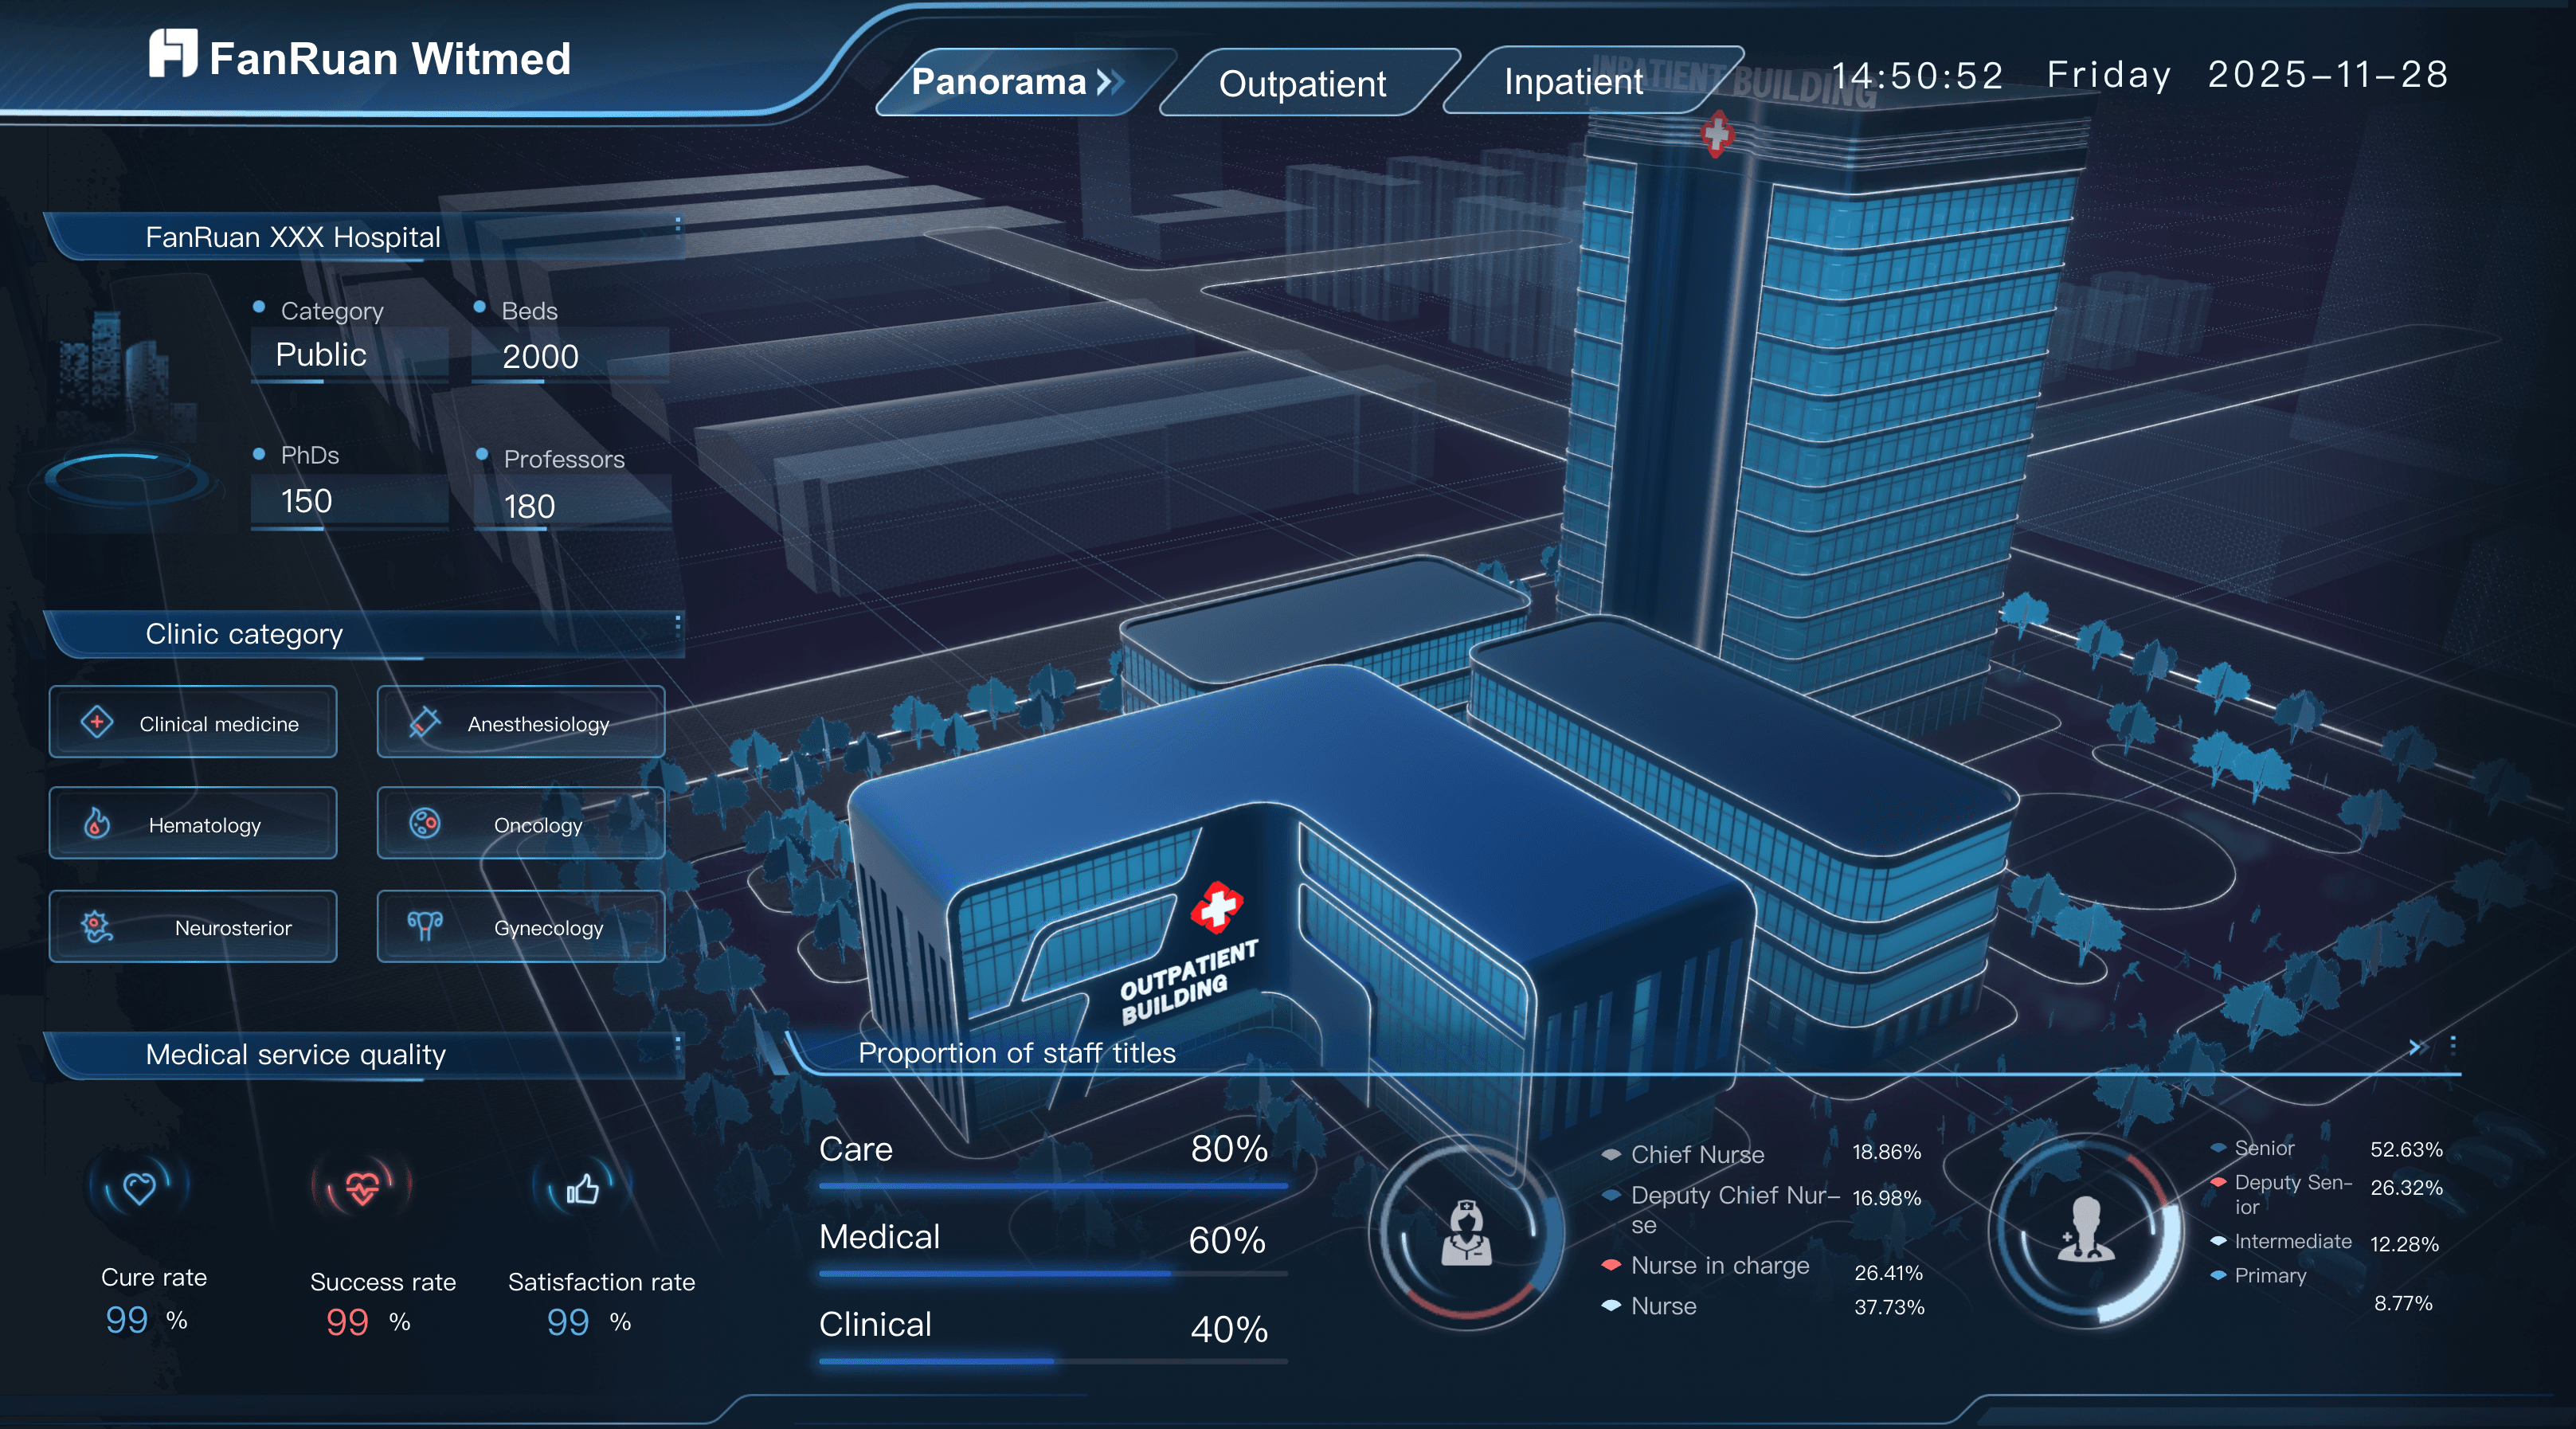
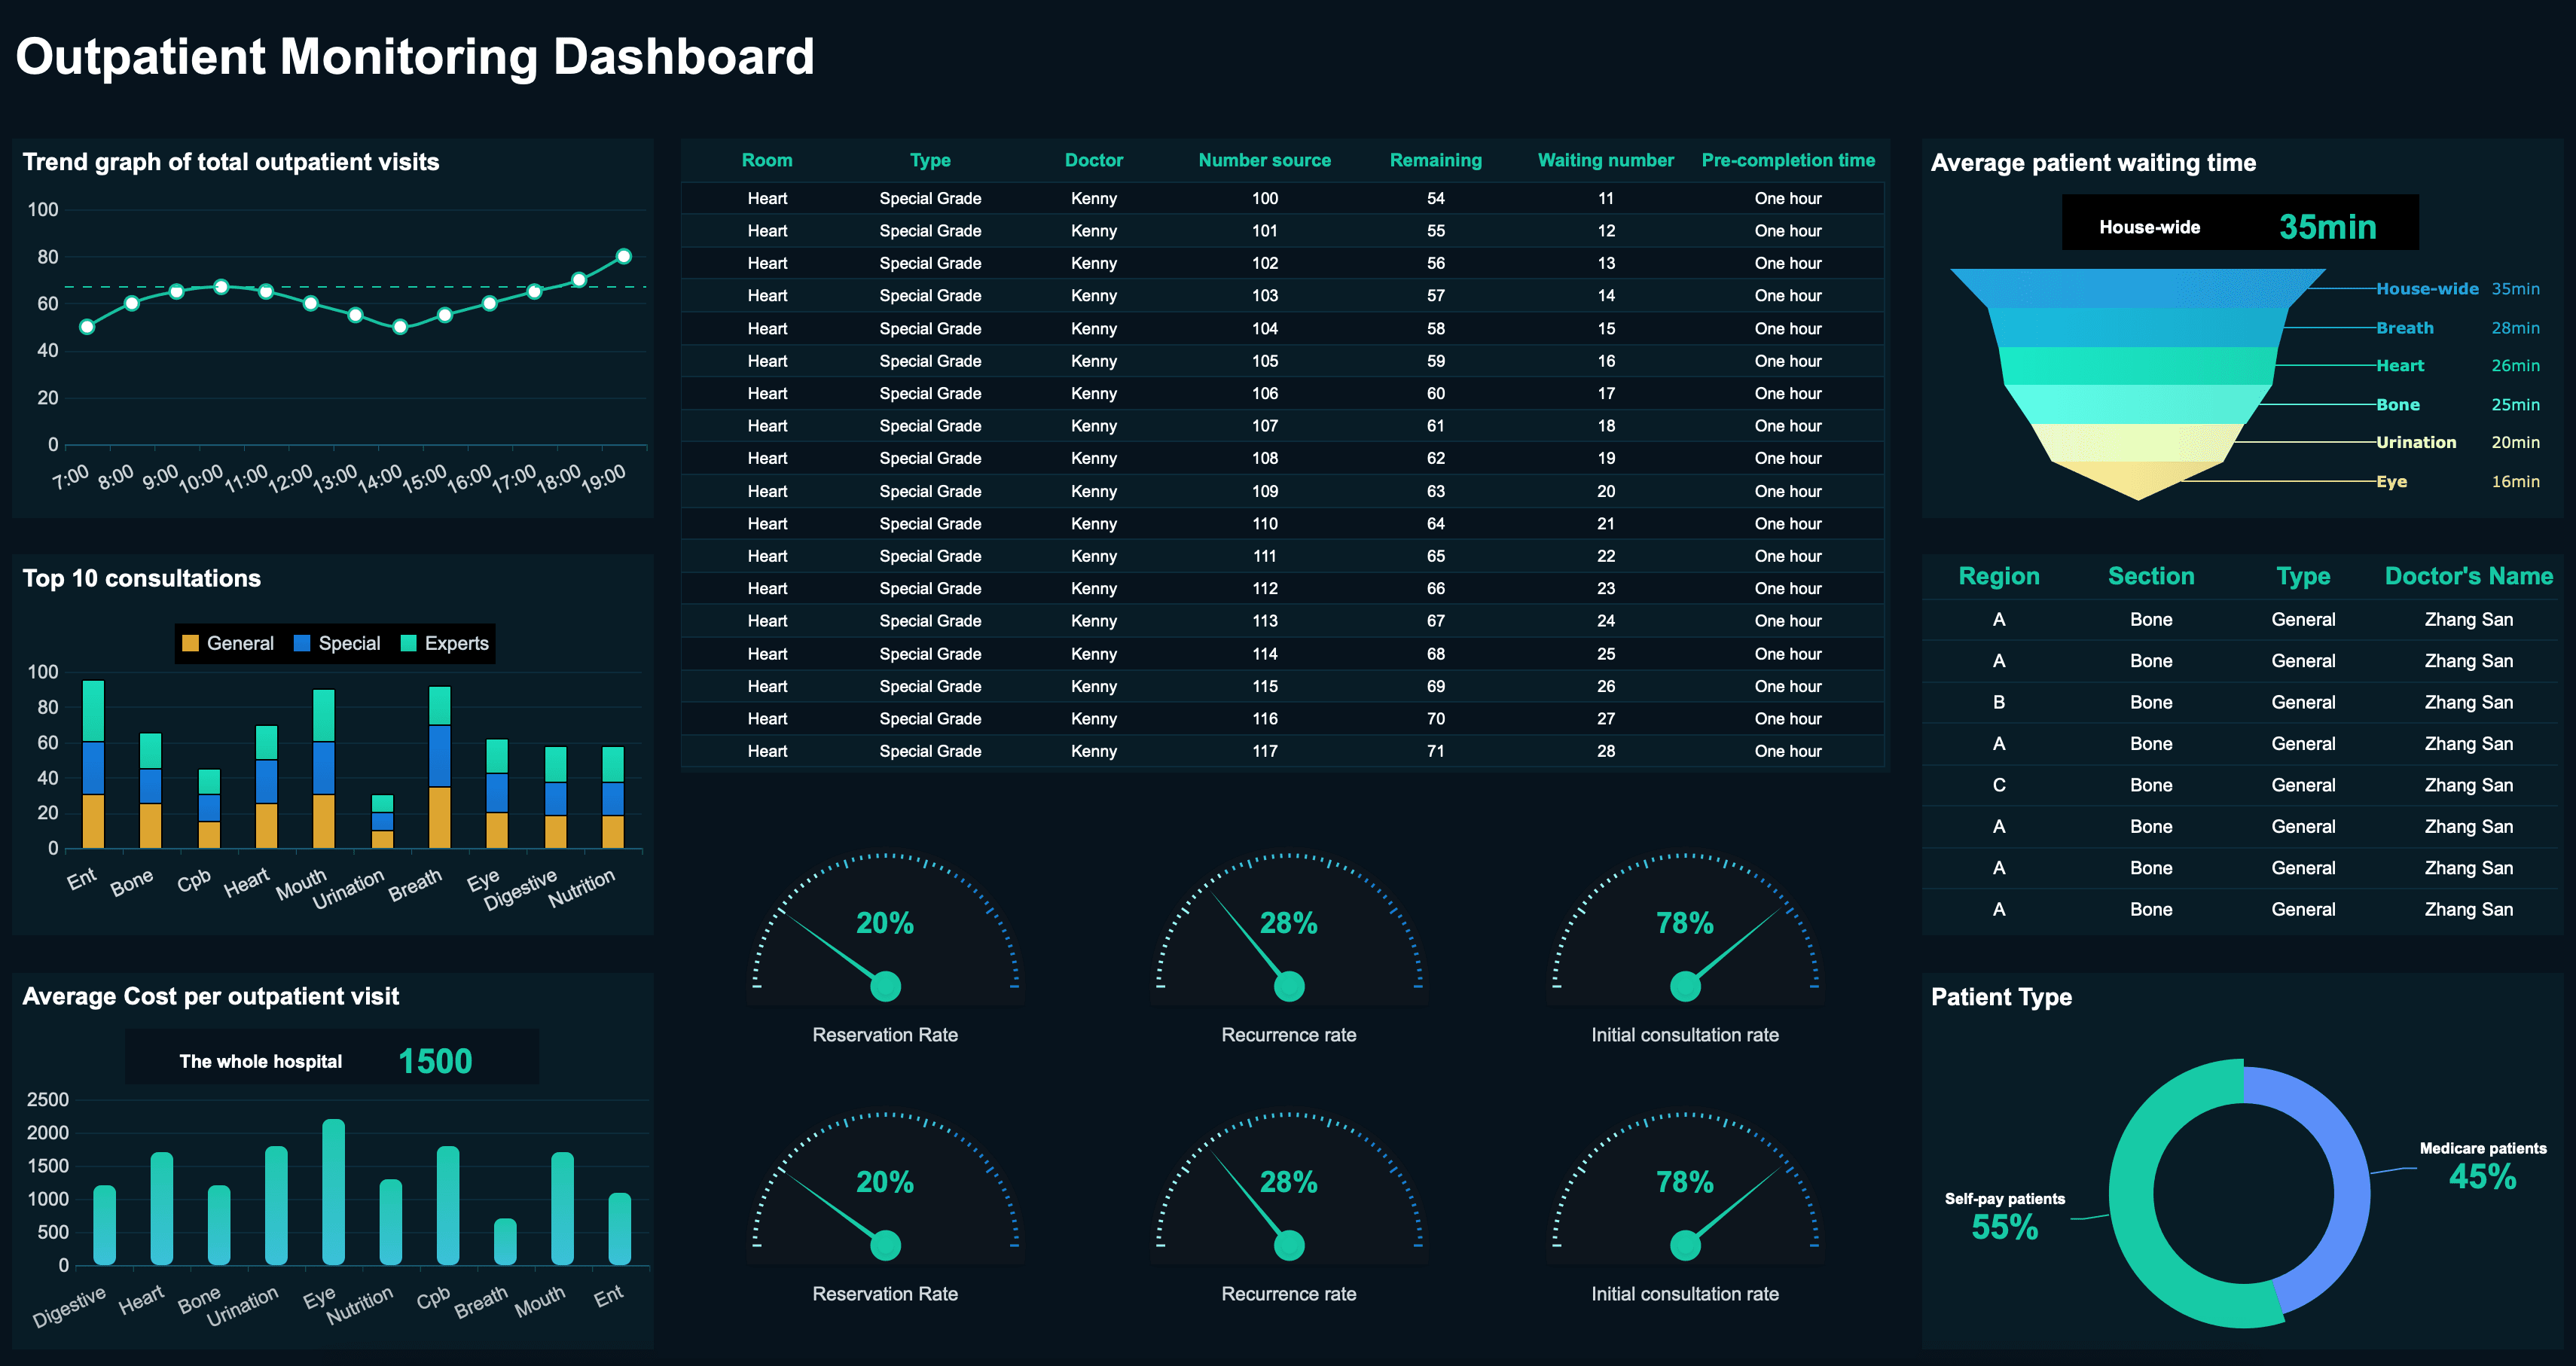
Healthcare Dashboard Examples
Hospital administrators and clinical leaders need to track the key performance indicators that help them improve patient care and facility efficiency. Below are essential metrics for a healthcare analytics dashboard:
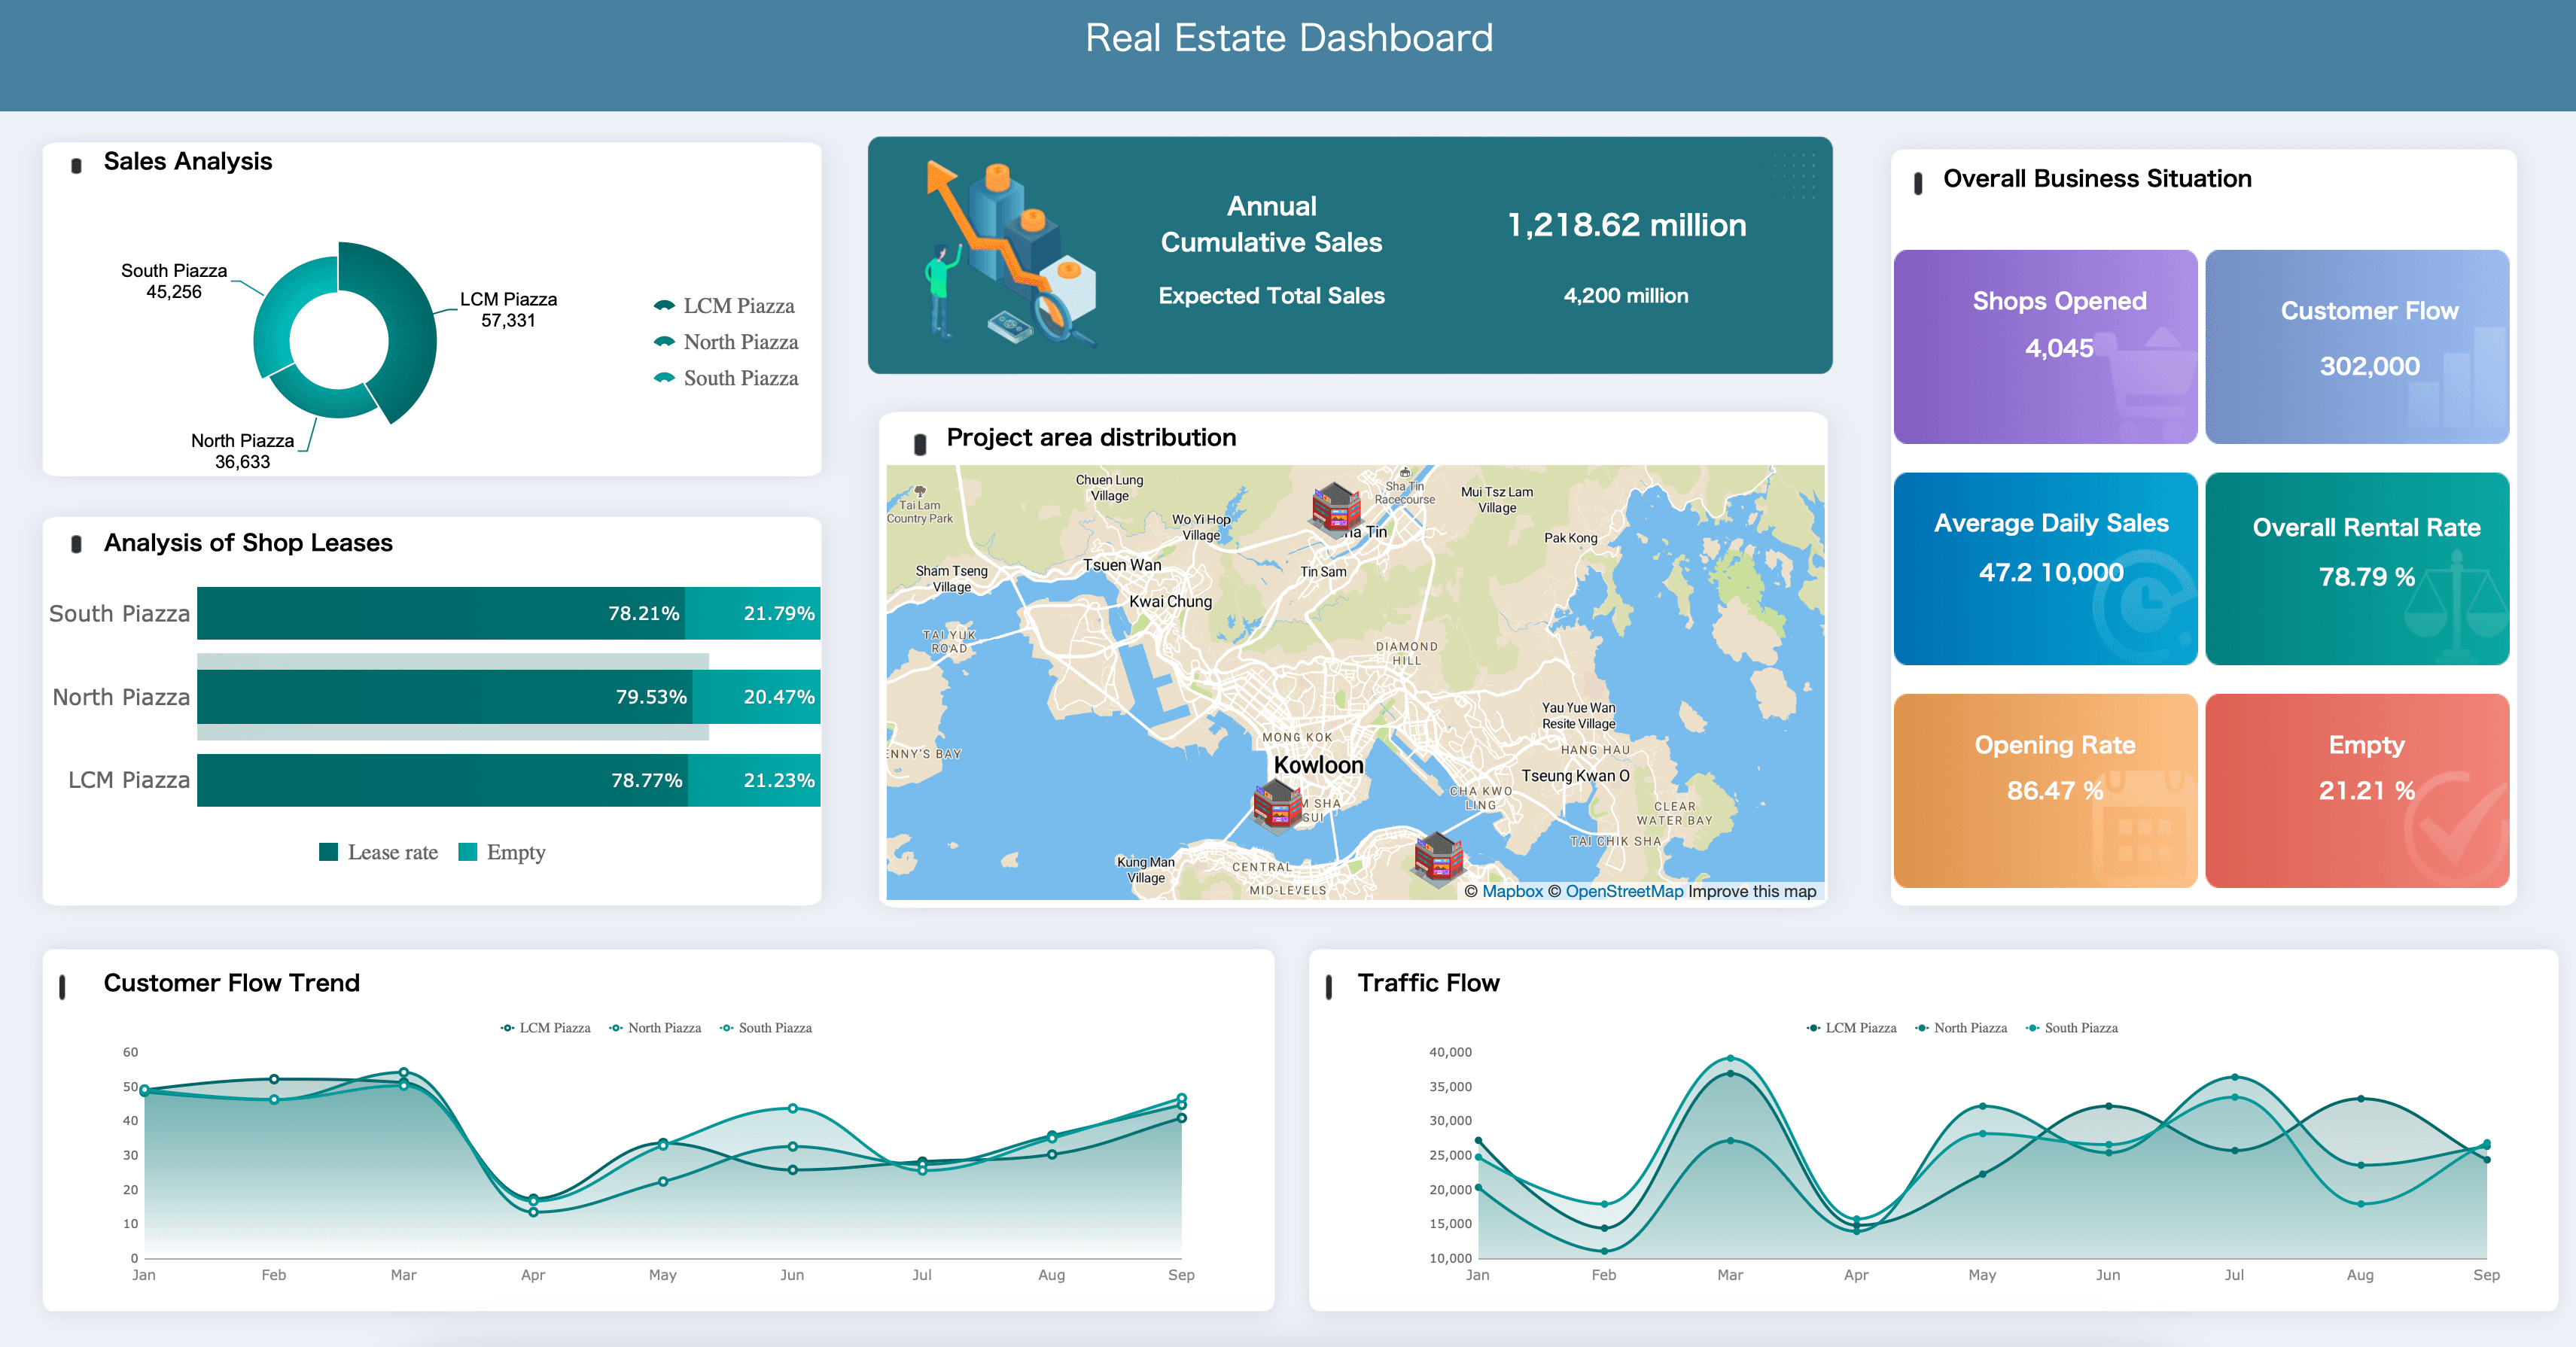
Real Estate Dashboard Examples
Property managers and real estate agents need to track the metrics that help them maximize portfolio value and tenant satisfaction. Below are essential examples for your real estate dashboard:
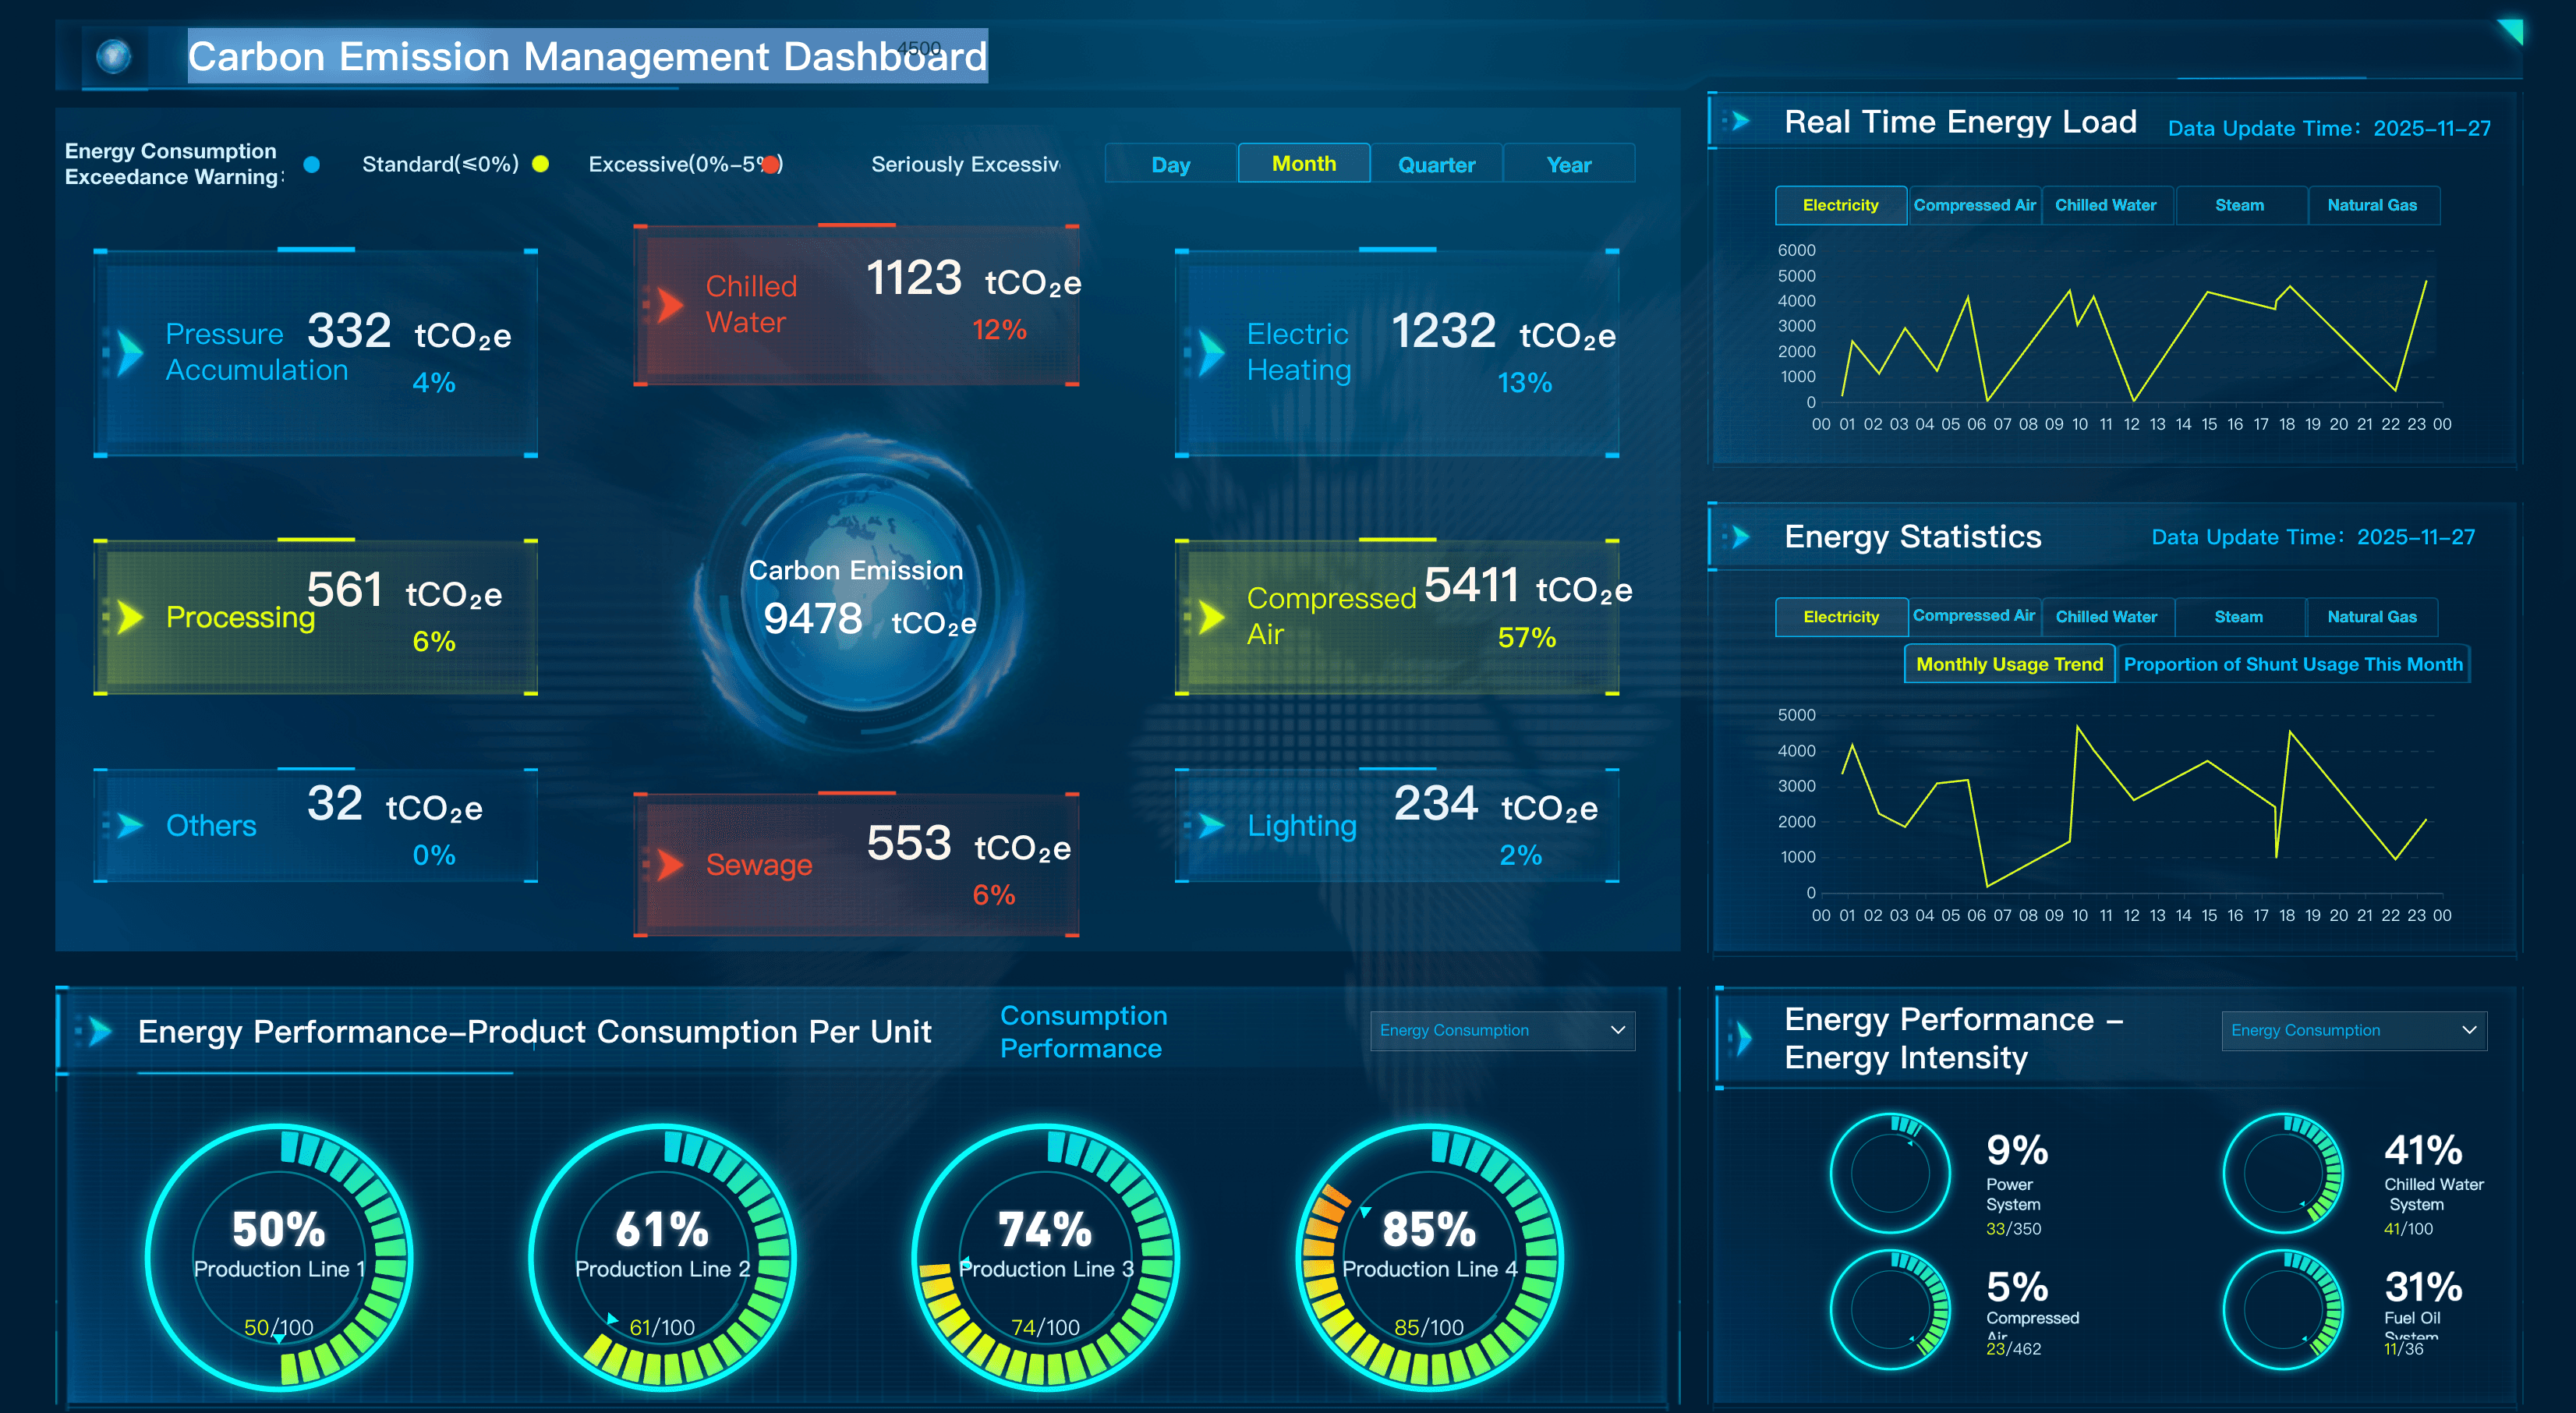
Energy & Utilities Dashboard Examples
Plant operators and grid managers need to track the metrics that help them optimize energy distribution and asset reliability. Below are essential examples for an energy dashboard:

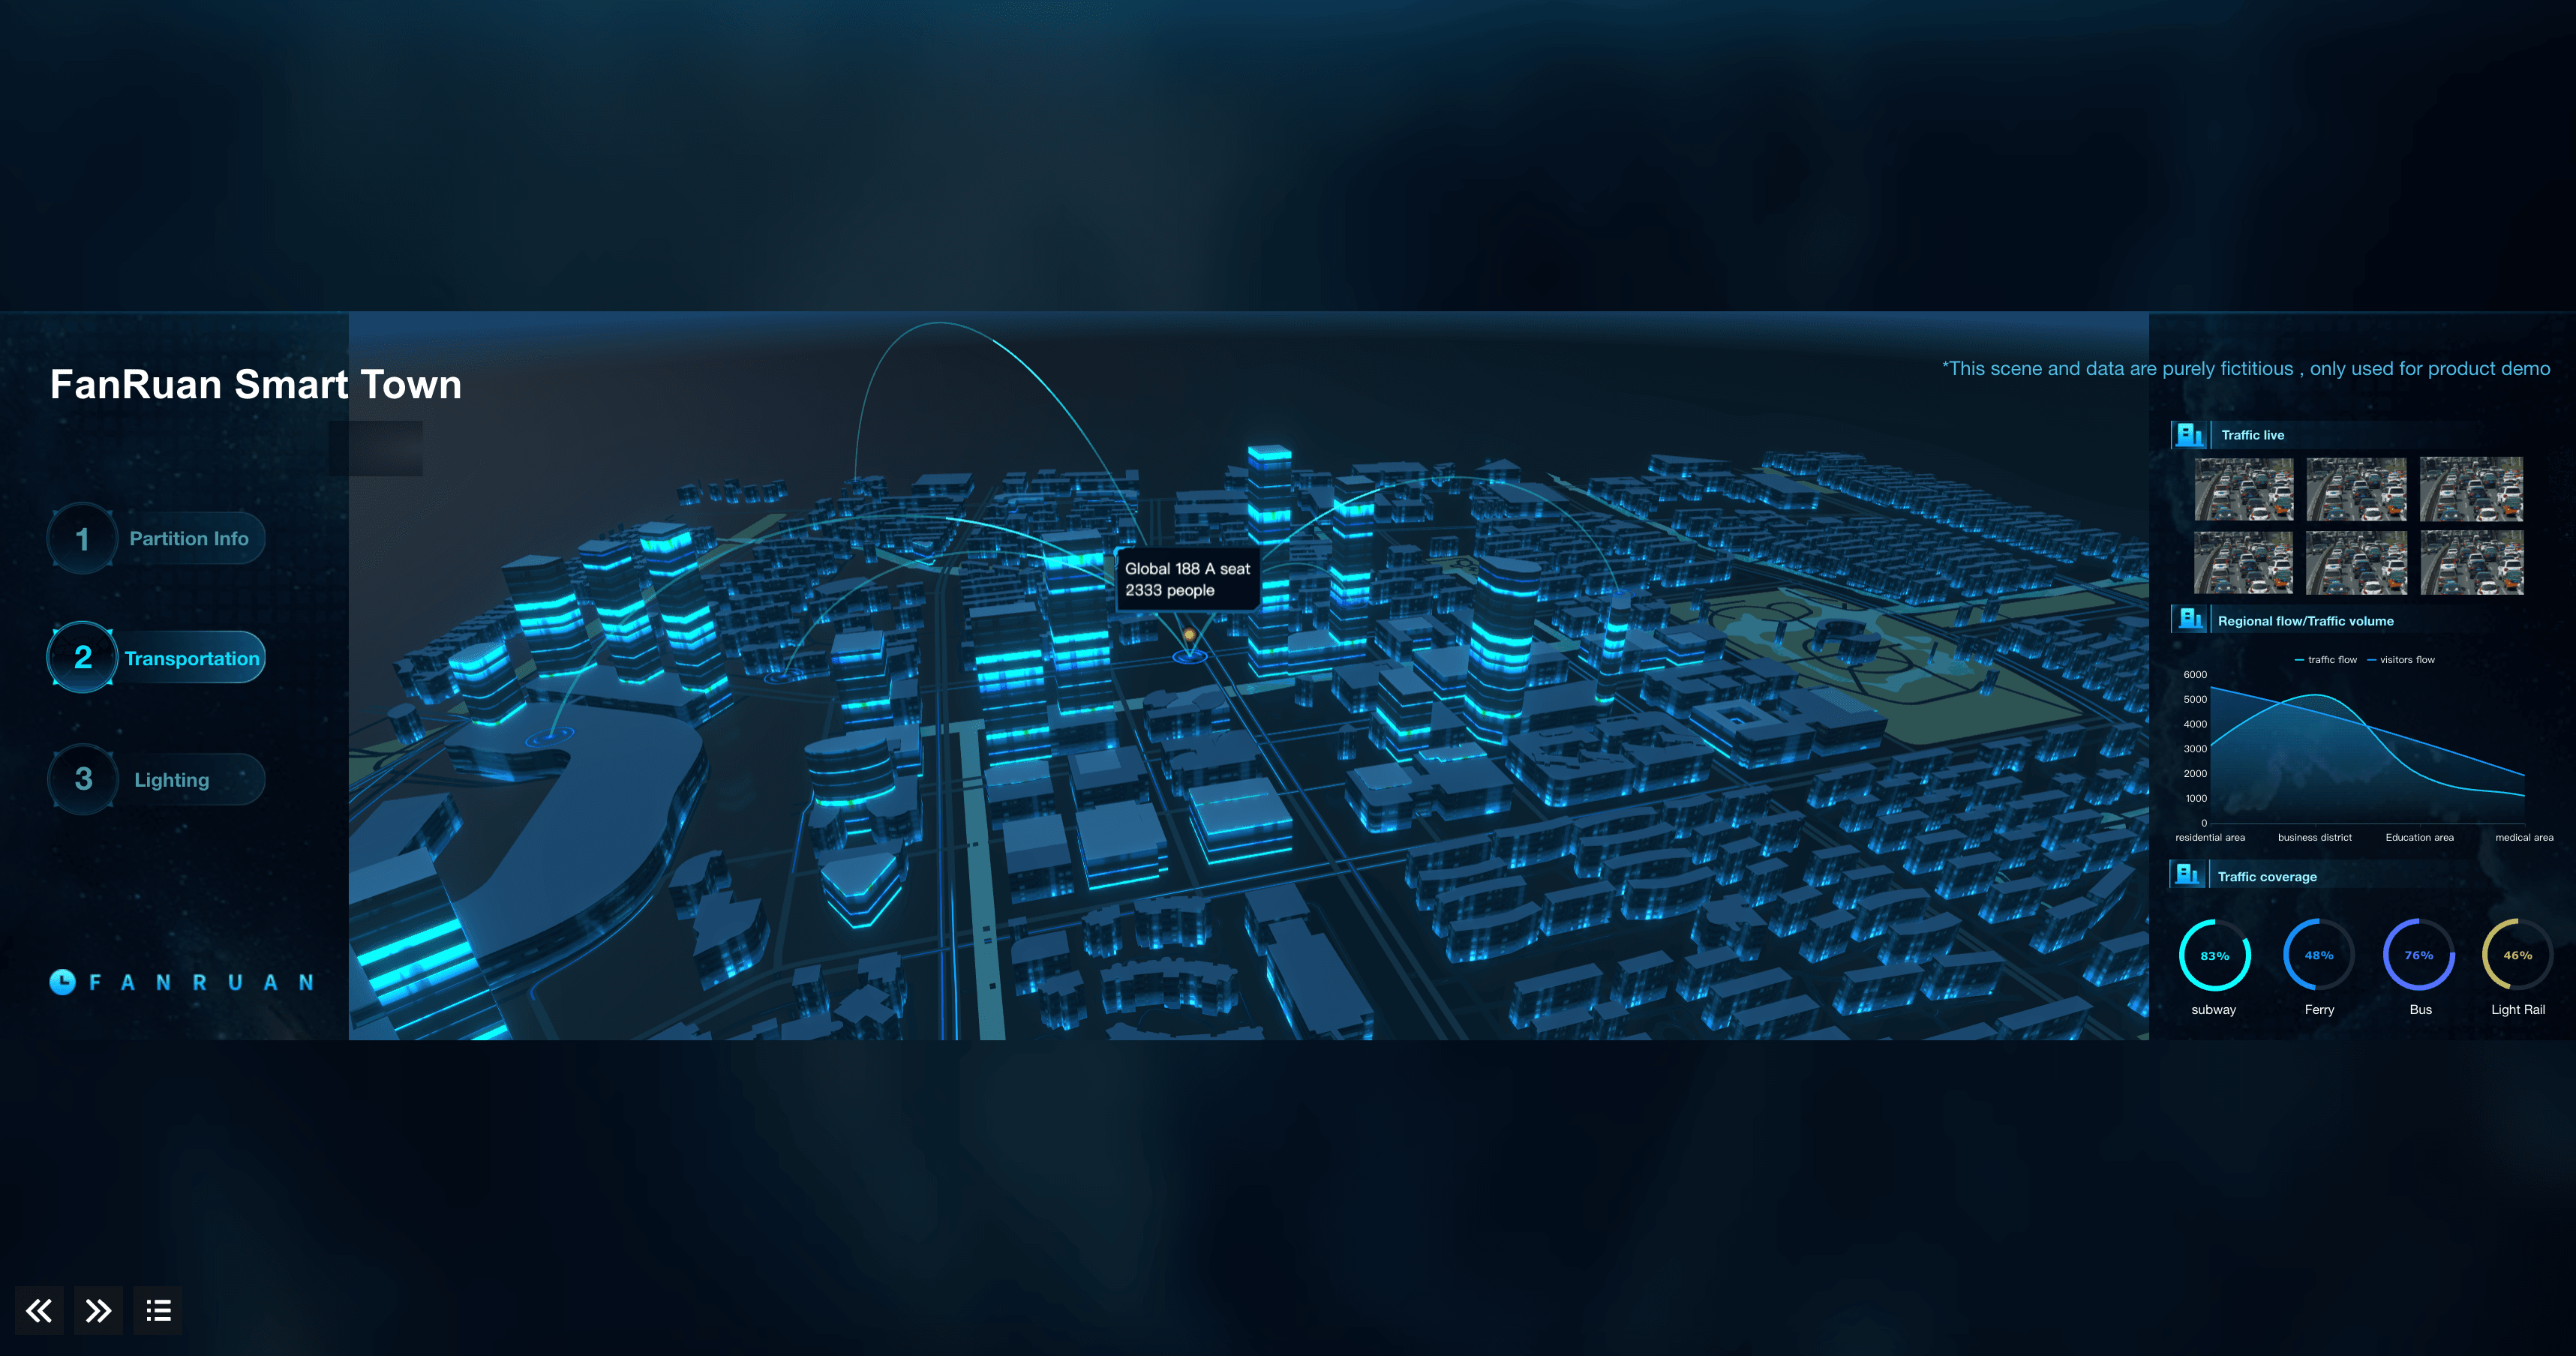
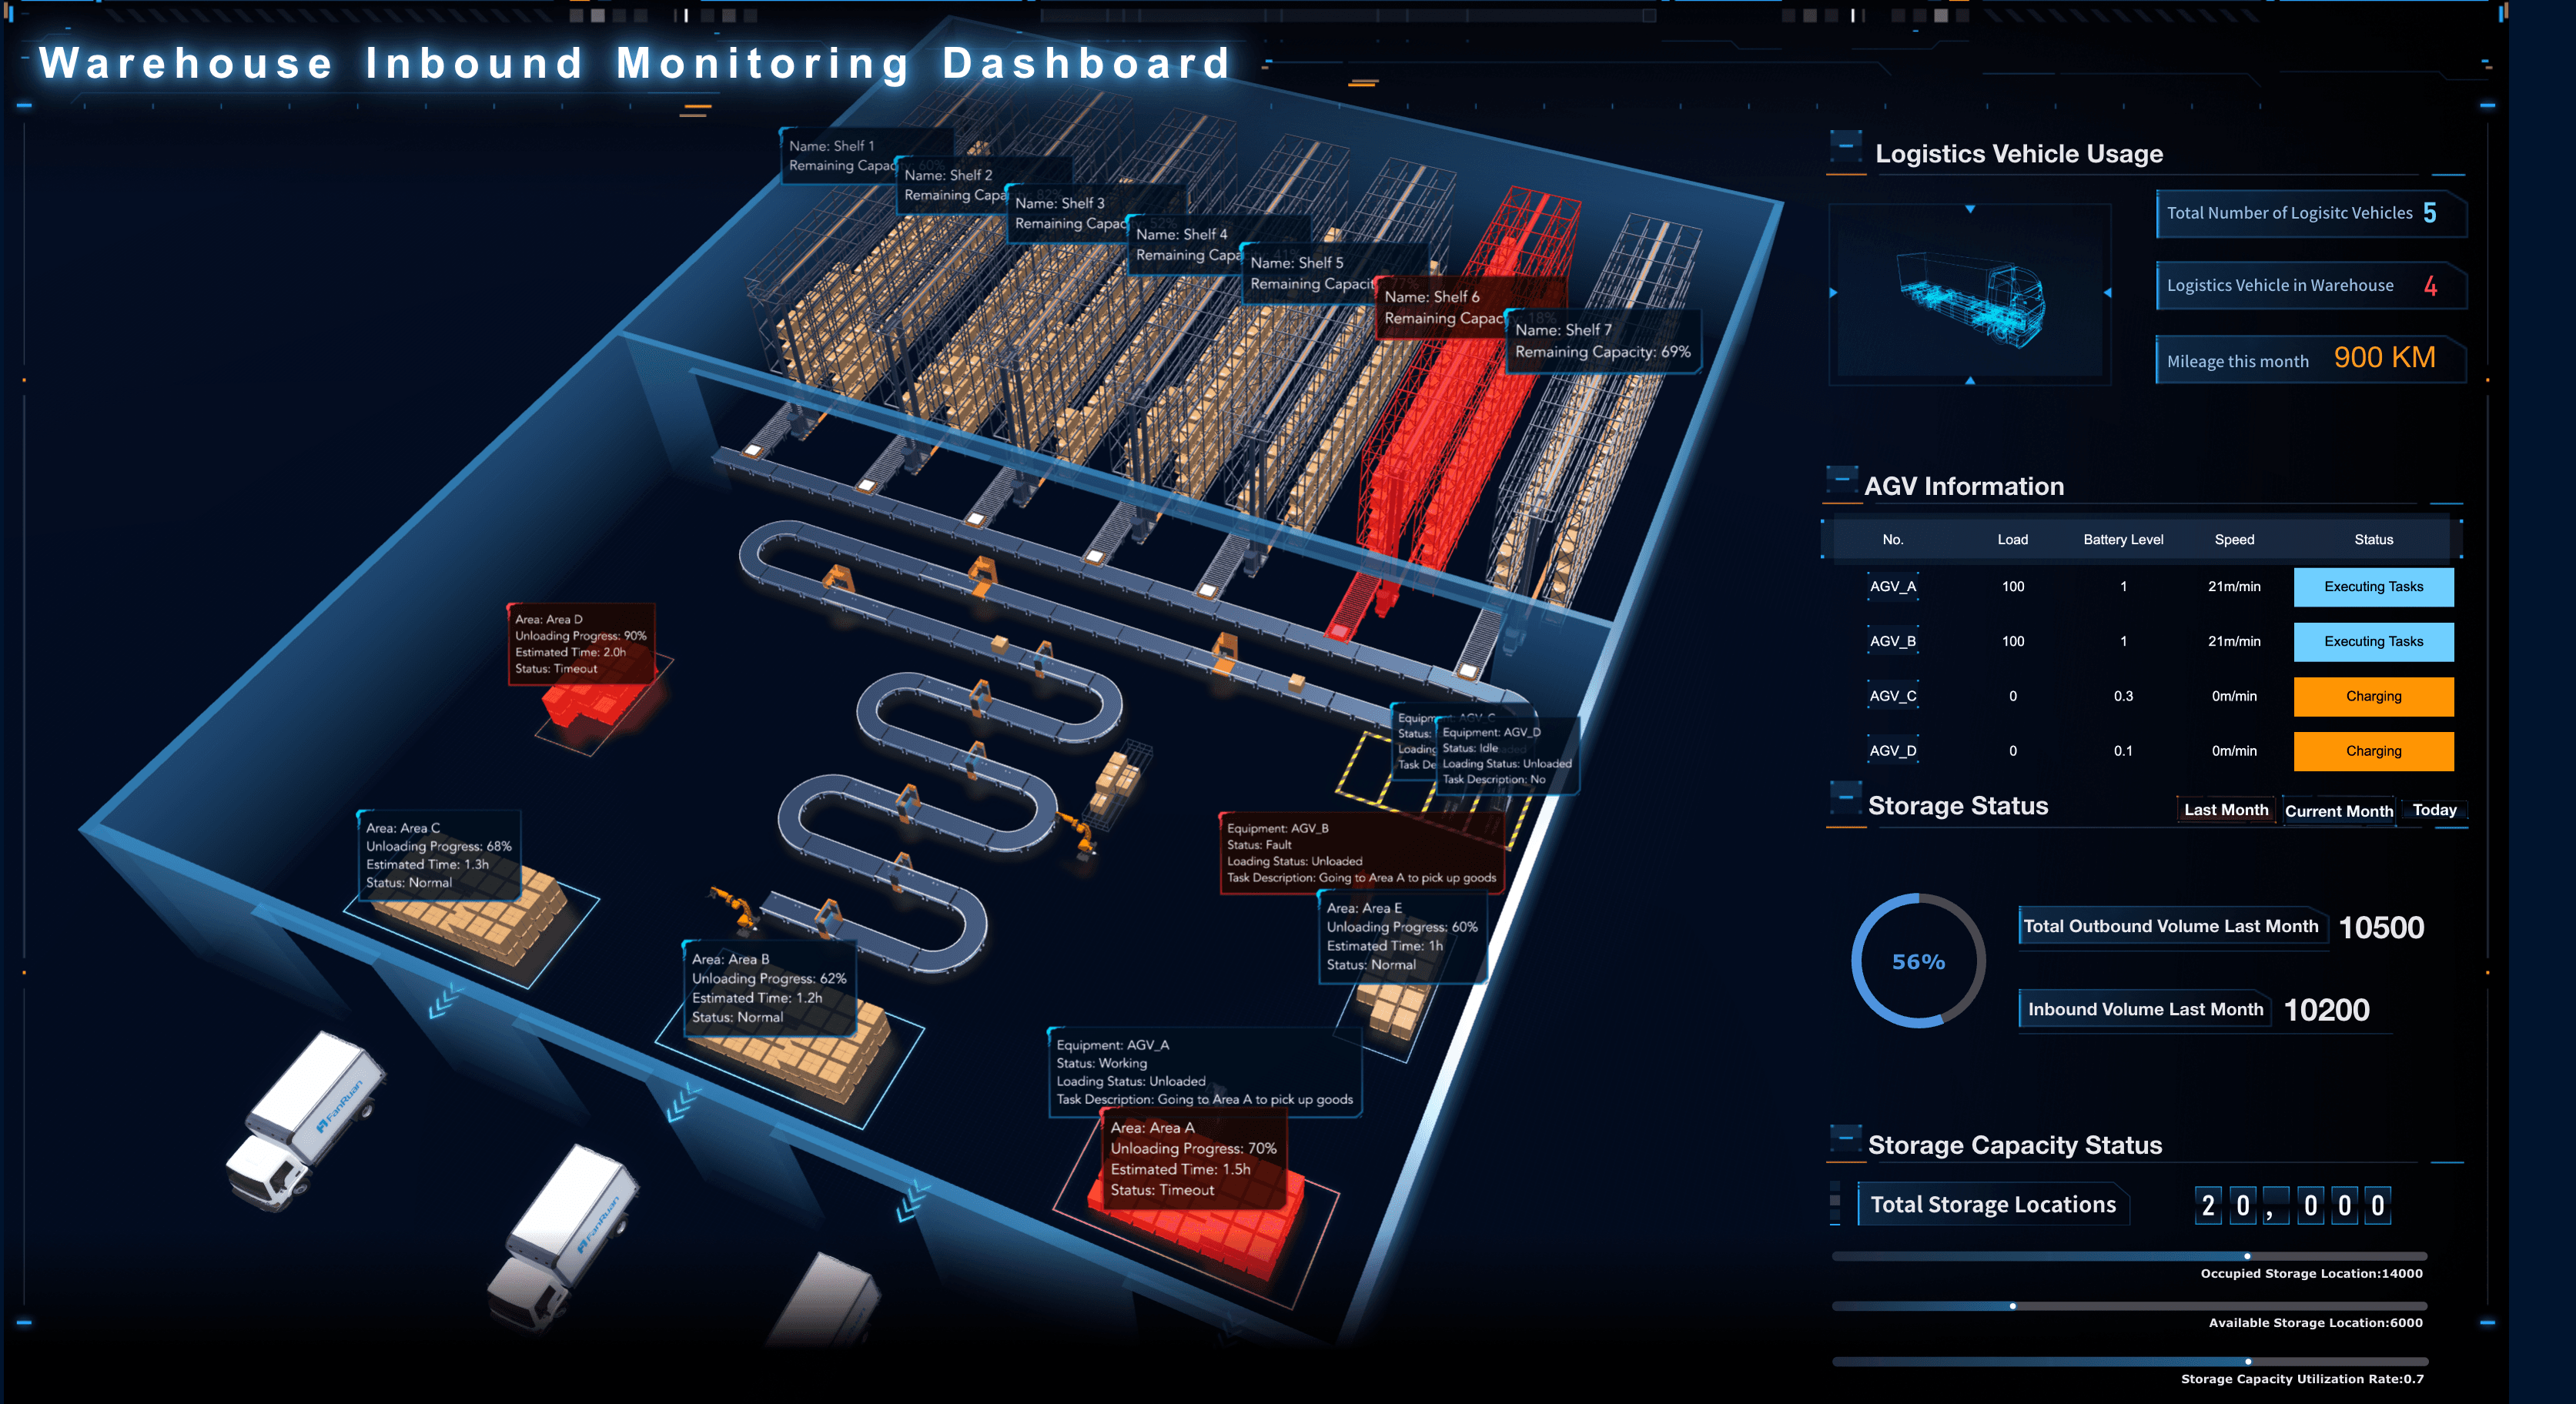
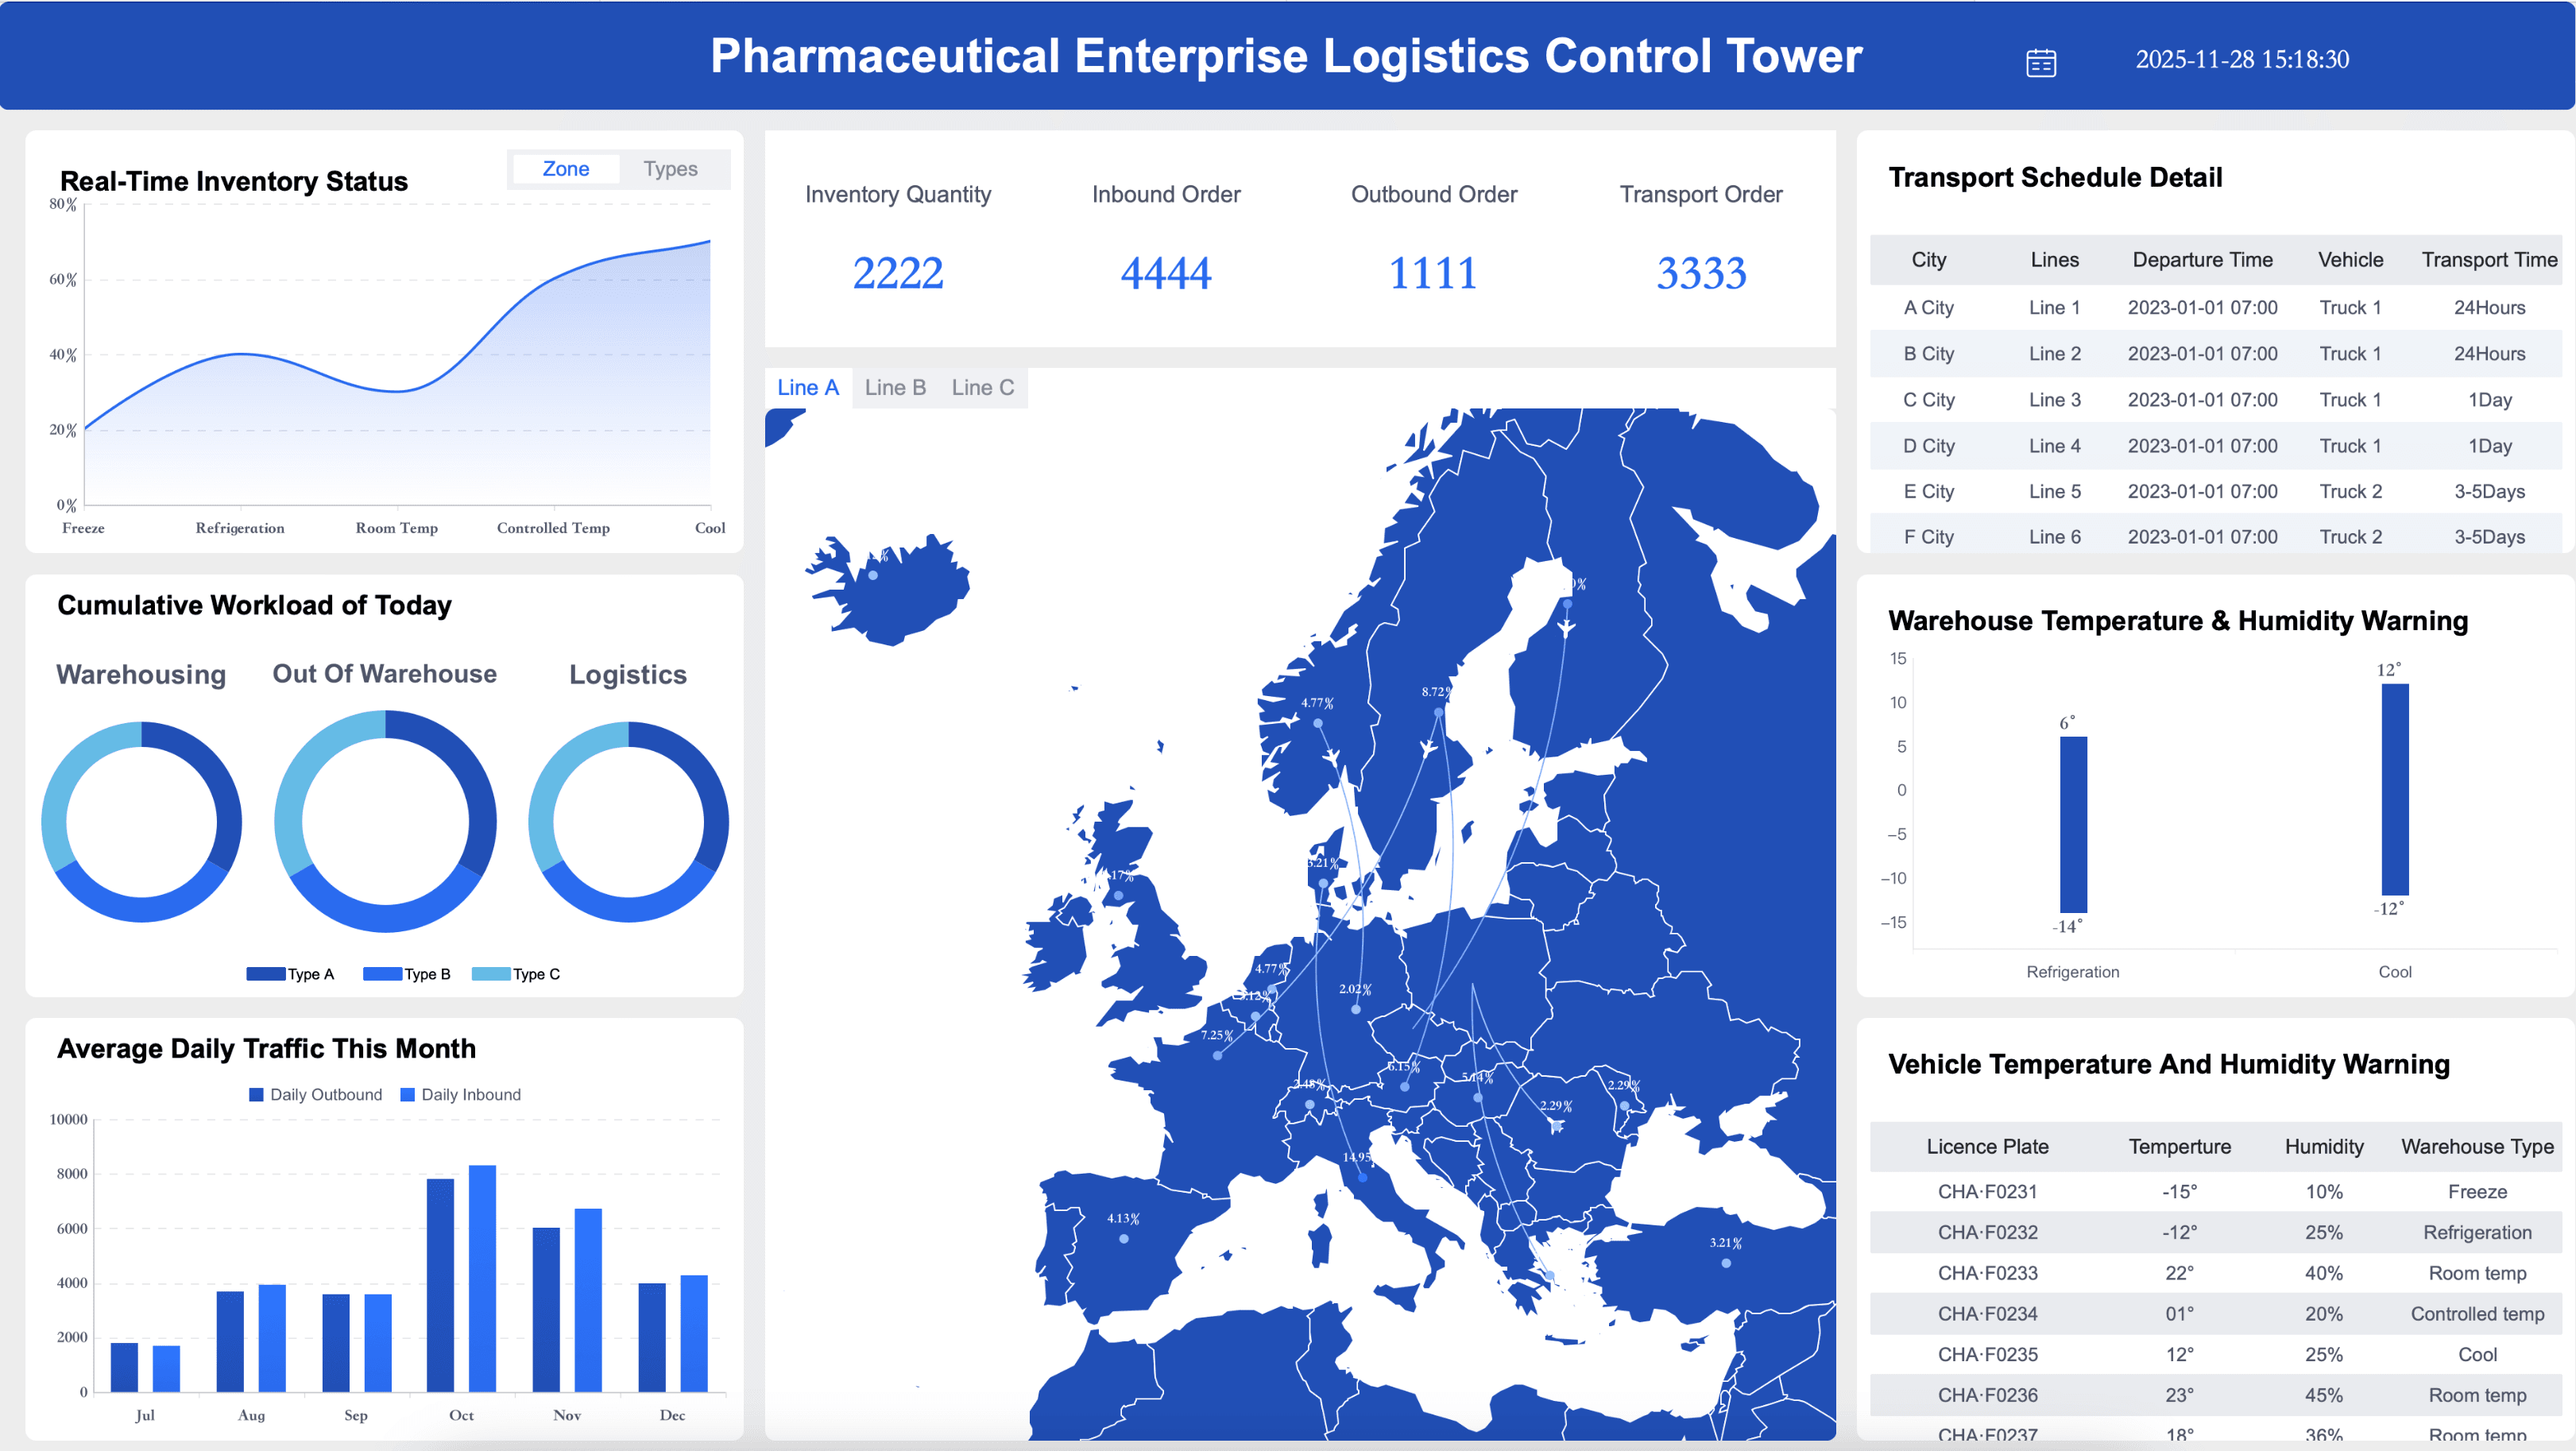
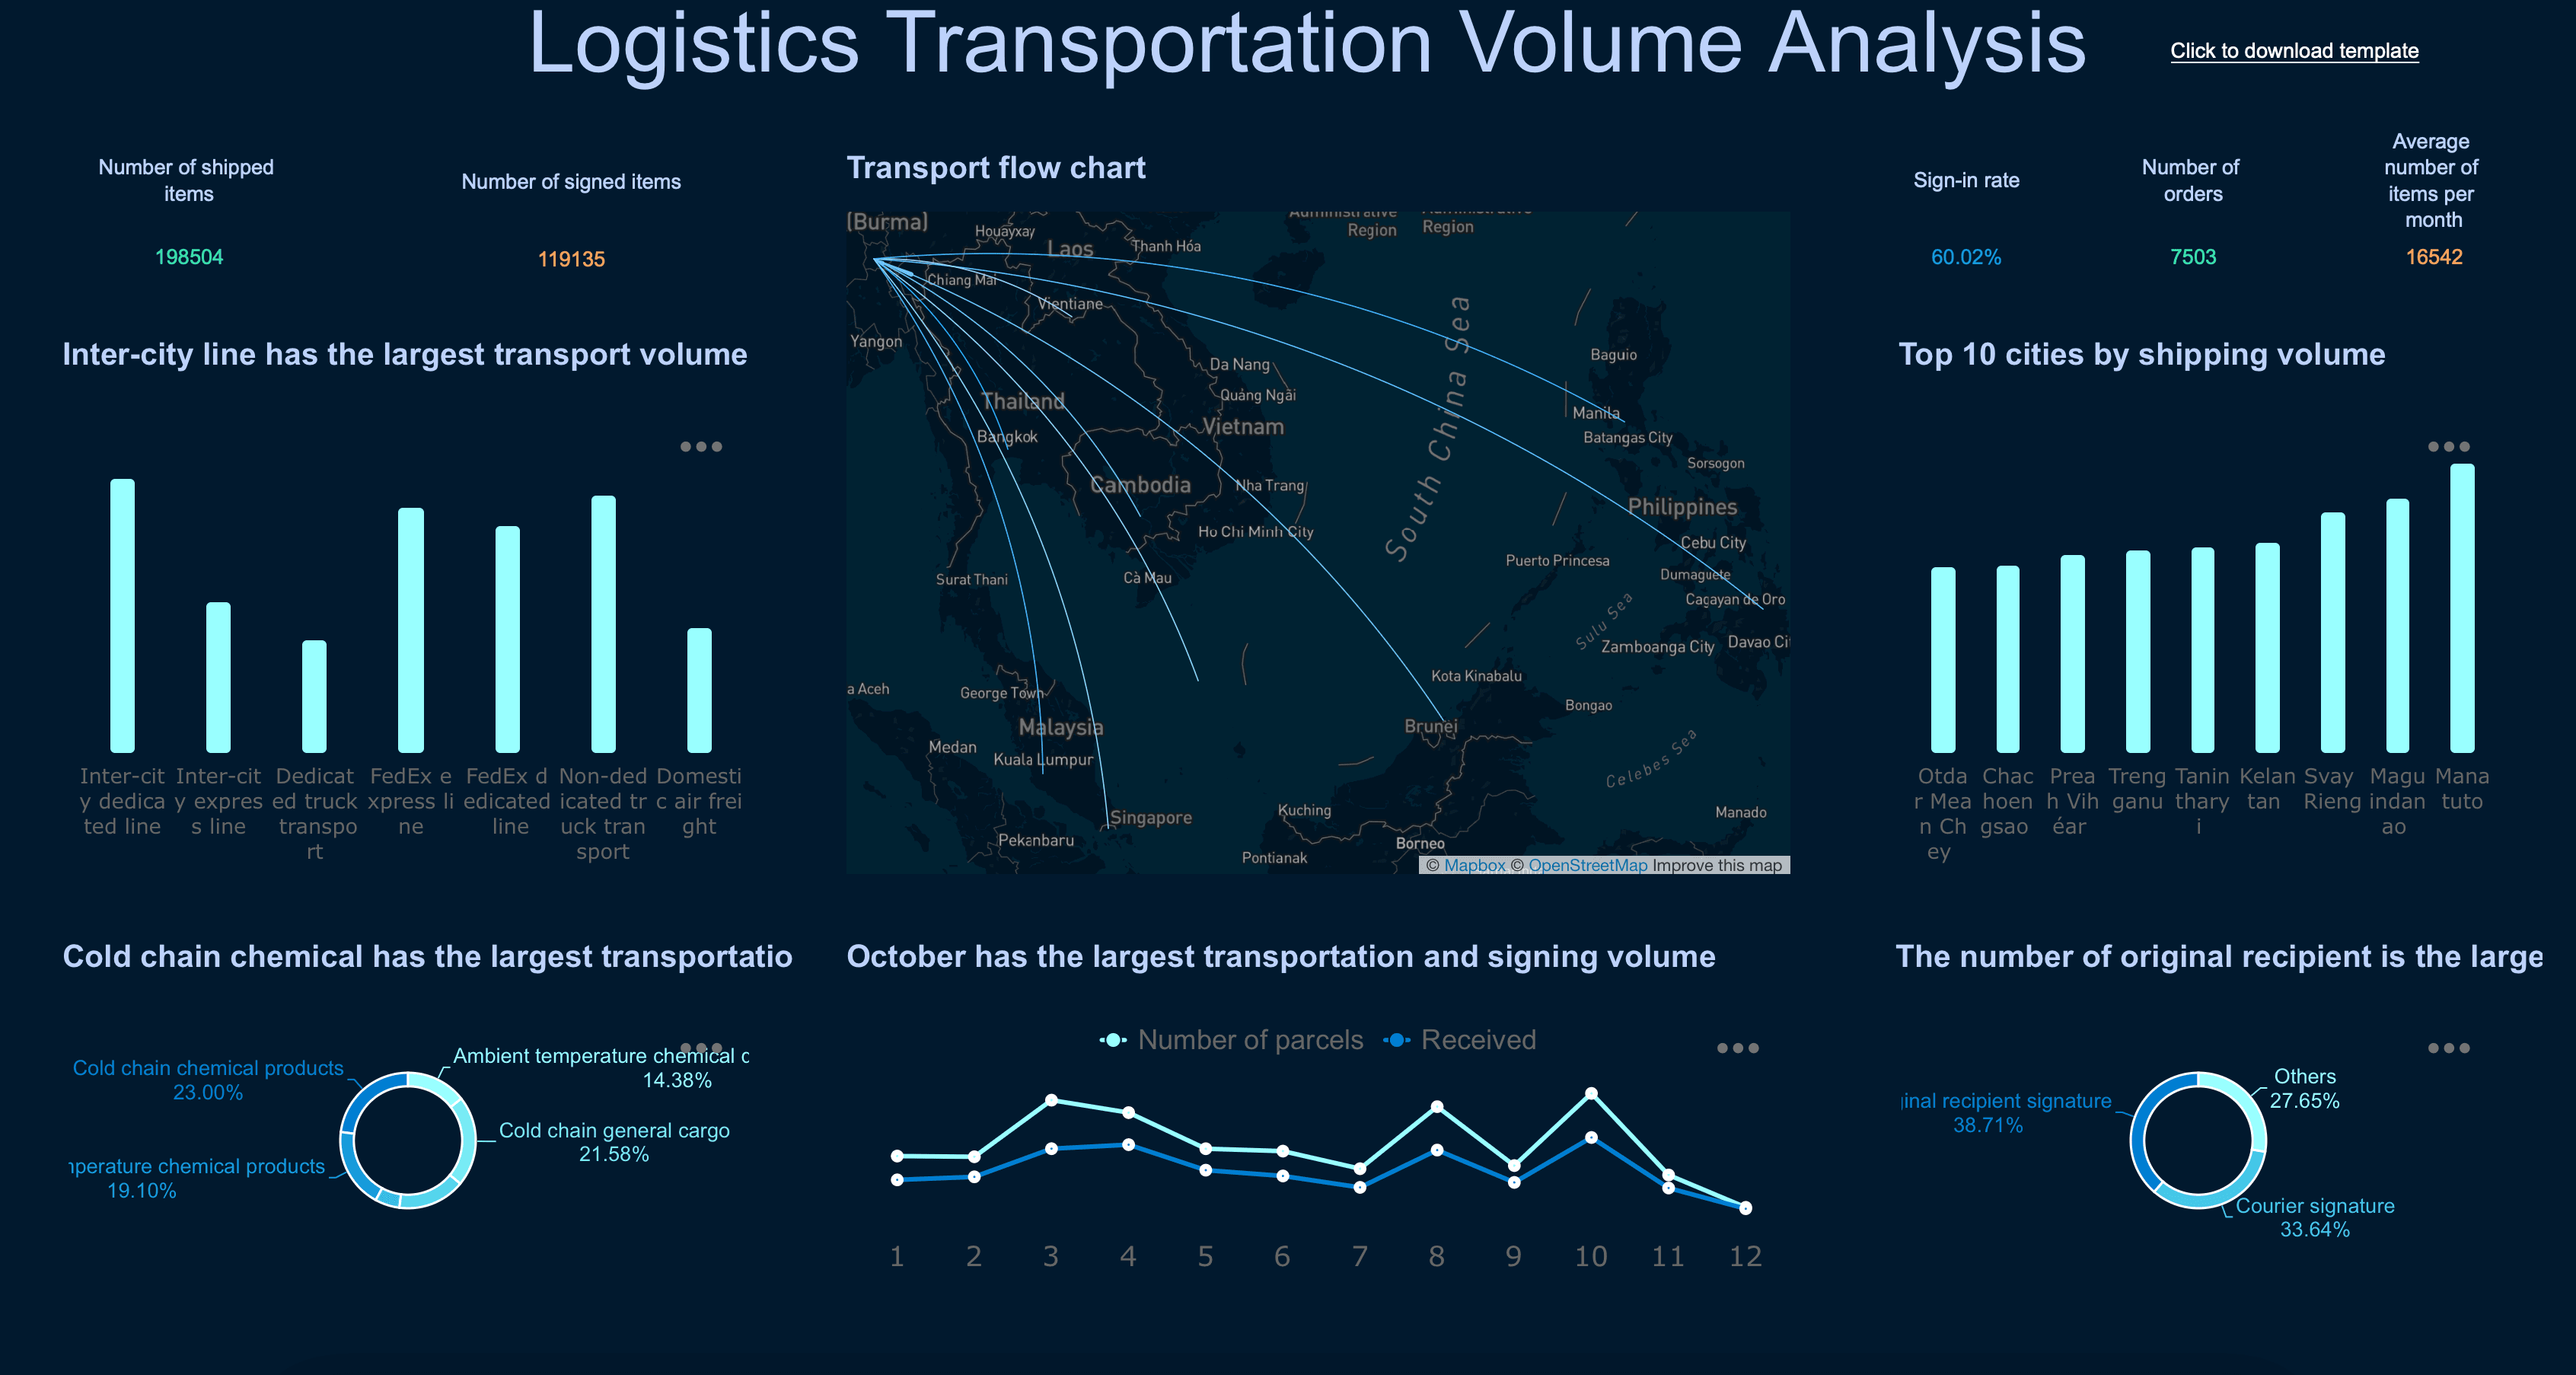
Transportation & Logistics Dashboard Examples
Fleet managers and supply chain teams need to track the key performance indicators that help them ensure on-time delivery and reduce freight costs. Below are essential elements for a logistics dashboard:

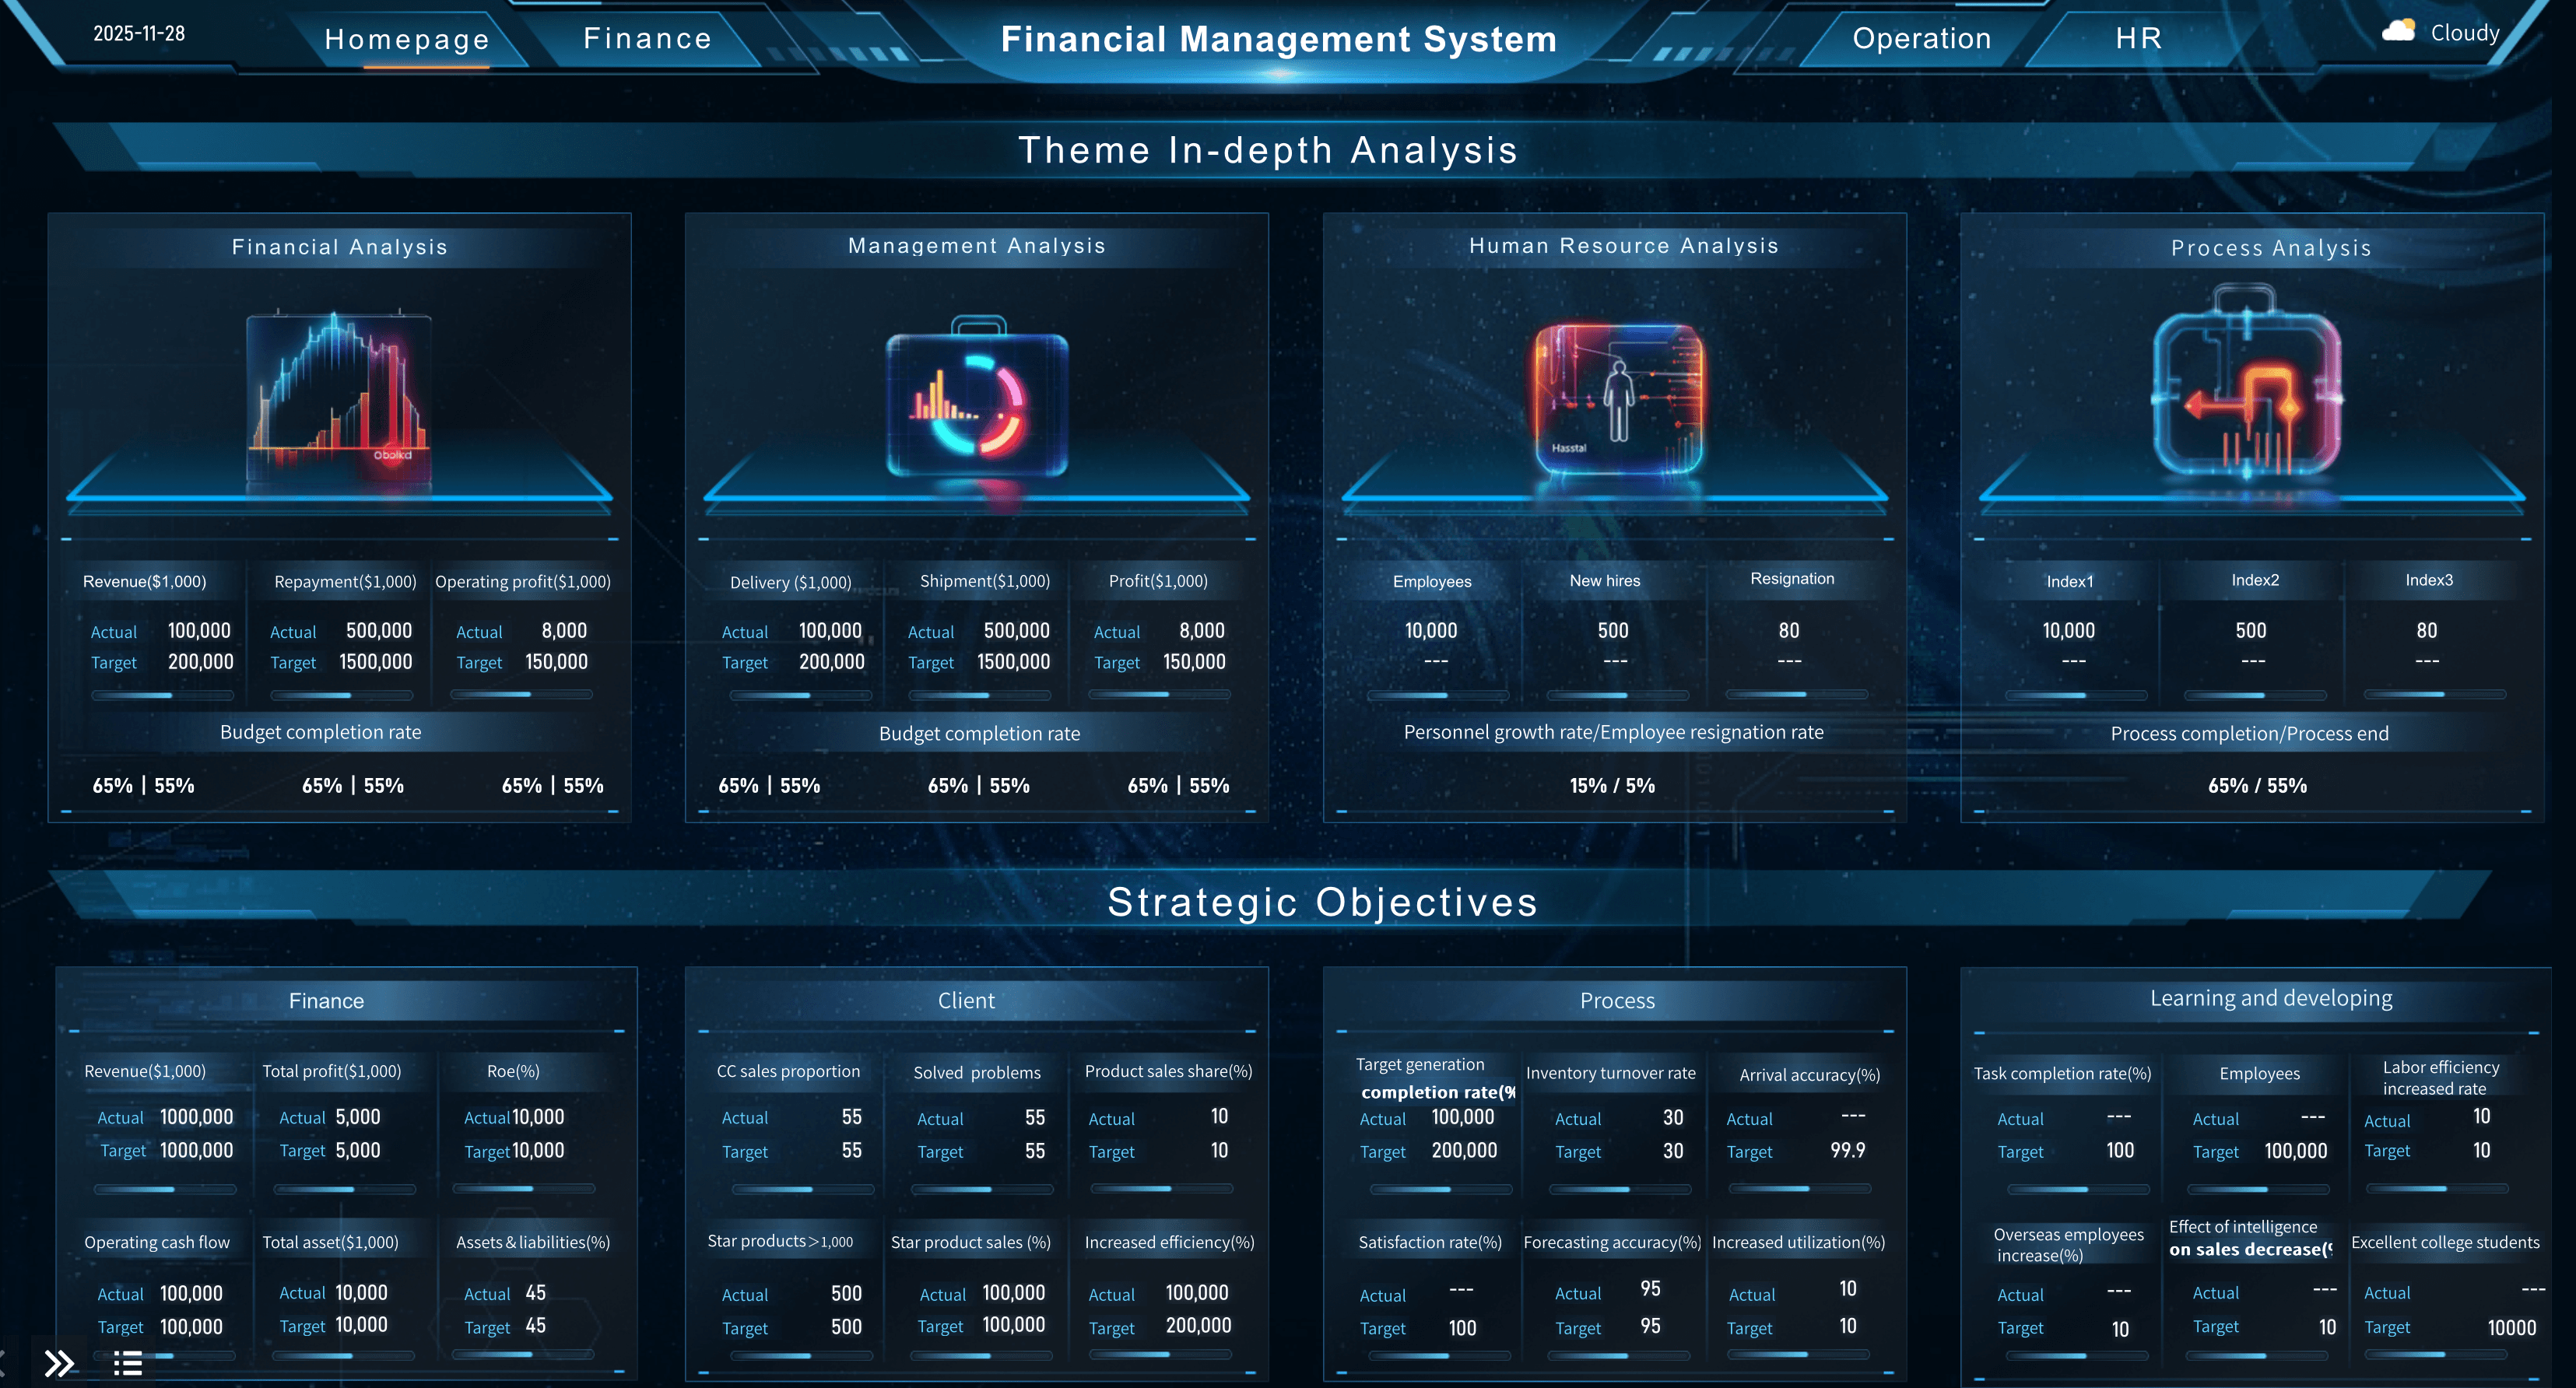
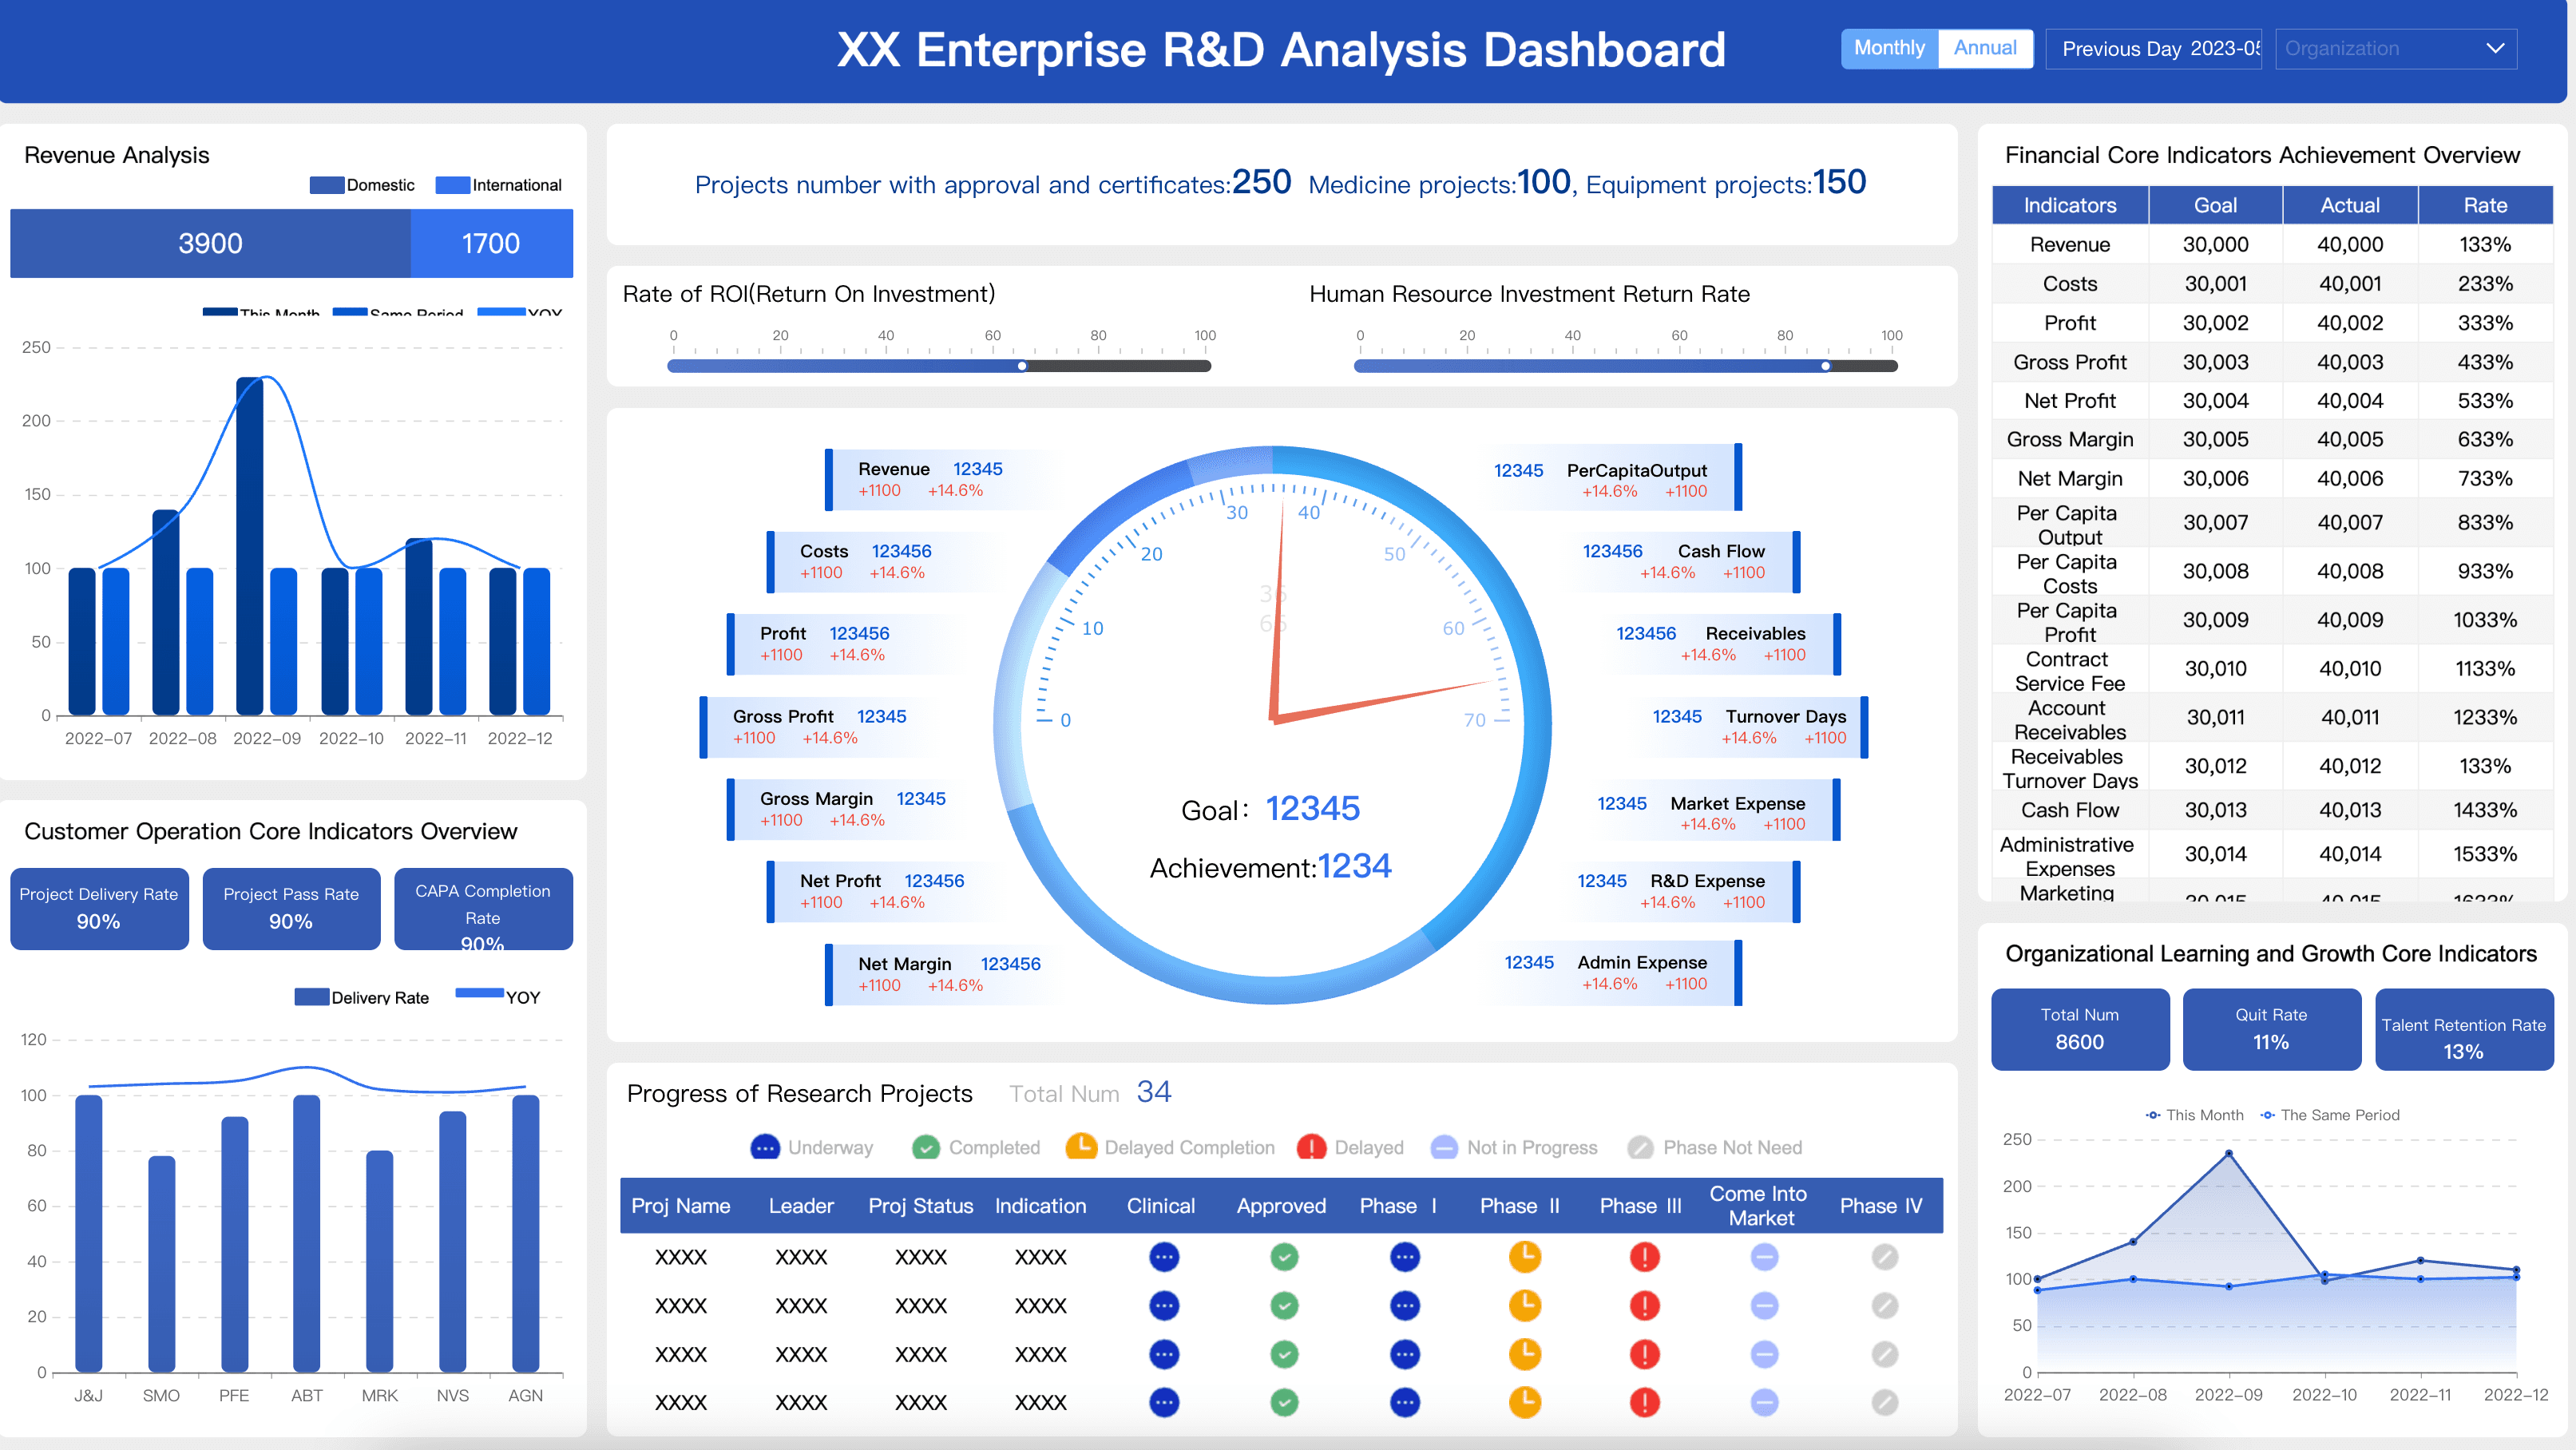
General Business Dashboard Examples
Executive leaders and department heads need to track the cross-functional metrics that help them drive sustainable, organization-wide growth. Below are essential metrics for an executive dashboard:

How to Design the Right Dashboard Examples
- Who, what, how. Be clear about who the audience is, what they want, and how they’re going to use the dashboards. This means working with your stakeholders to identify the core visualizations that map directly to their goals and strategy.
- Be SMART. This popular acronym stands for Specific, Measurable, Attainable, Realistic, and Time-bound. This is a useful touchstone whenever you’re considering whether a metric should be included on your screen. SMART dashboard examples display metrics such as “revenue per region per month” or “new customers per quarter”.
- Iterate and evolve. Over time, see how you or your audience are using the set of visualizations and if you find that certain charts aren’t relevant, remove or replace them.
FAQs
Some of the most widely used business dashboard examples include sales performance dashboards, financial dashboards, marketing analytics dashboards, HR dashboards, and executive overview dashboards. Each is designed to serve a specific audience and business function. A sales dashboard might display pipeline value and quota attainment, while a financial dashboard tracks cash flow, profit margins, and budget variance. The common thread across all these examples is that they surface the most critical data for a given team in a clear, actionable format.
Executive dashboard examples typically include a high-level company scorecard showing overall revenue, net profit margin, customer acquisition cost, and employee headcount. Other common examples are CEO dashboards that combine financial performance with operational health metrics, and board-level dashboards that visualize progress against annual strategic goals. These dashboards prioritize simplicity and context over granular detail, giving leadership a fast read on whether the business is on track without requiring them to drill into the underlying data.
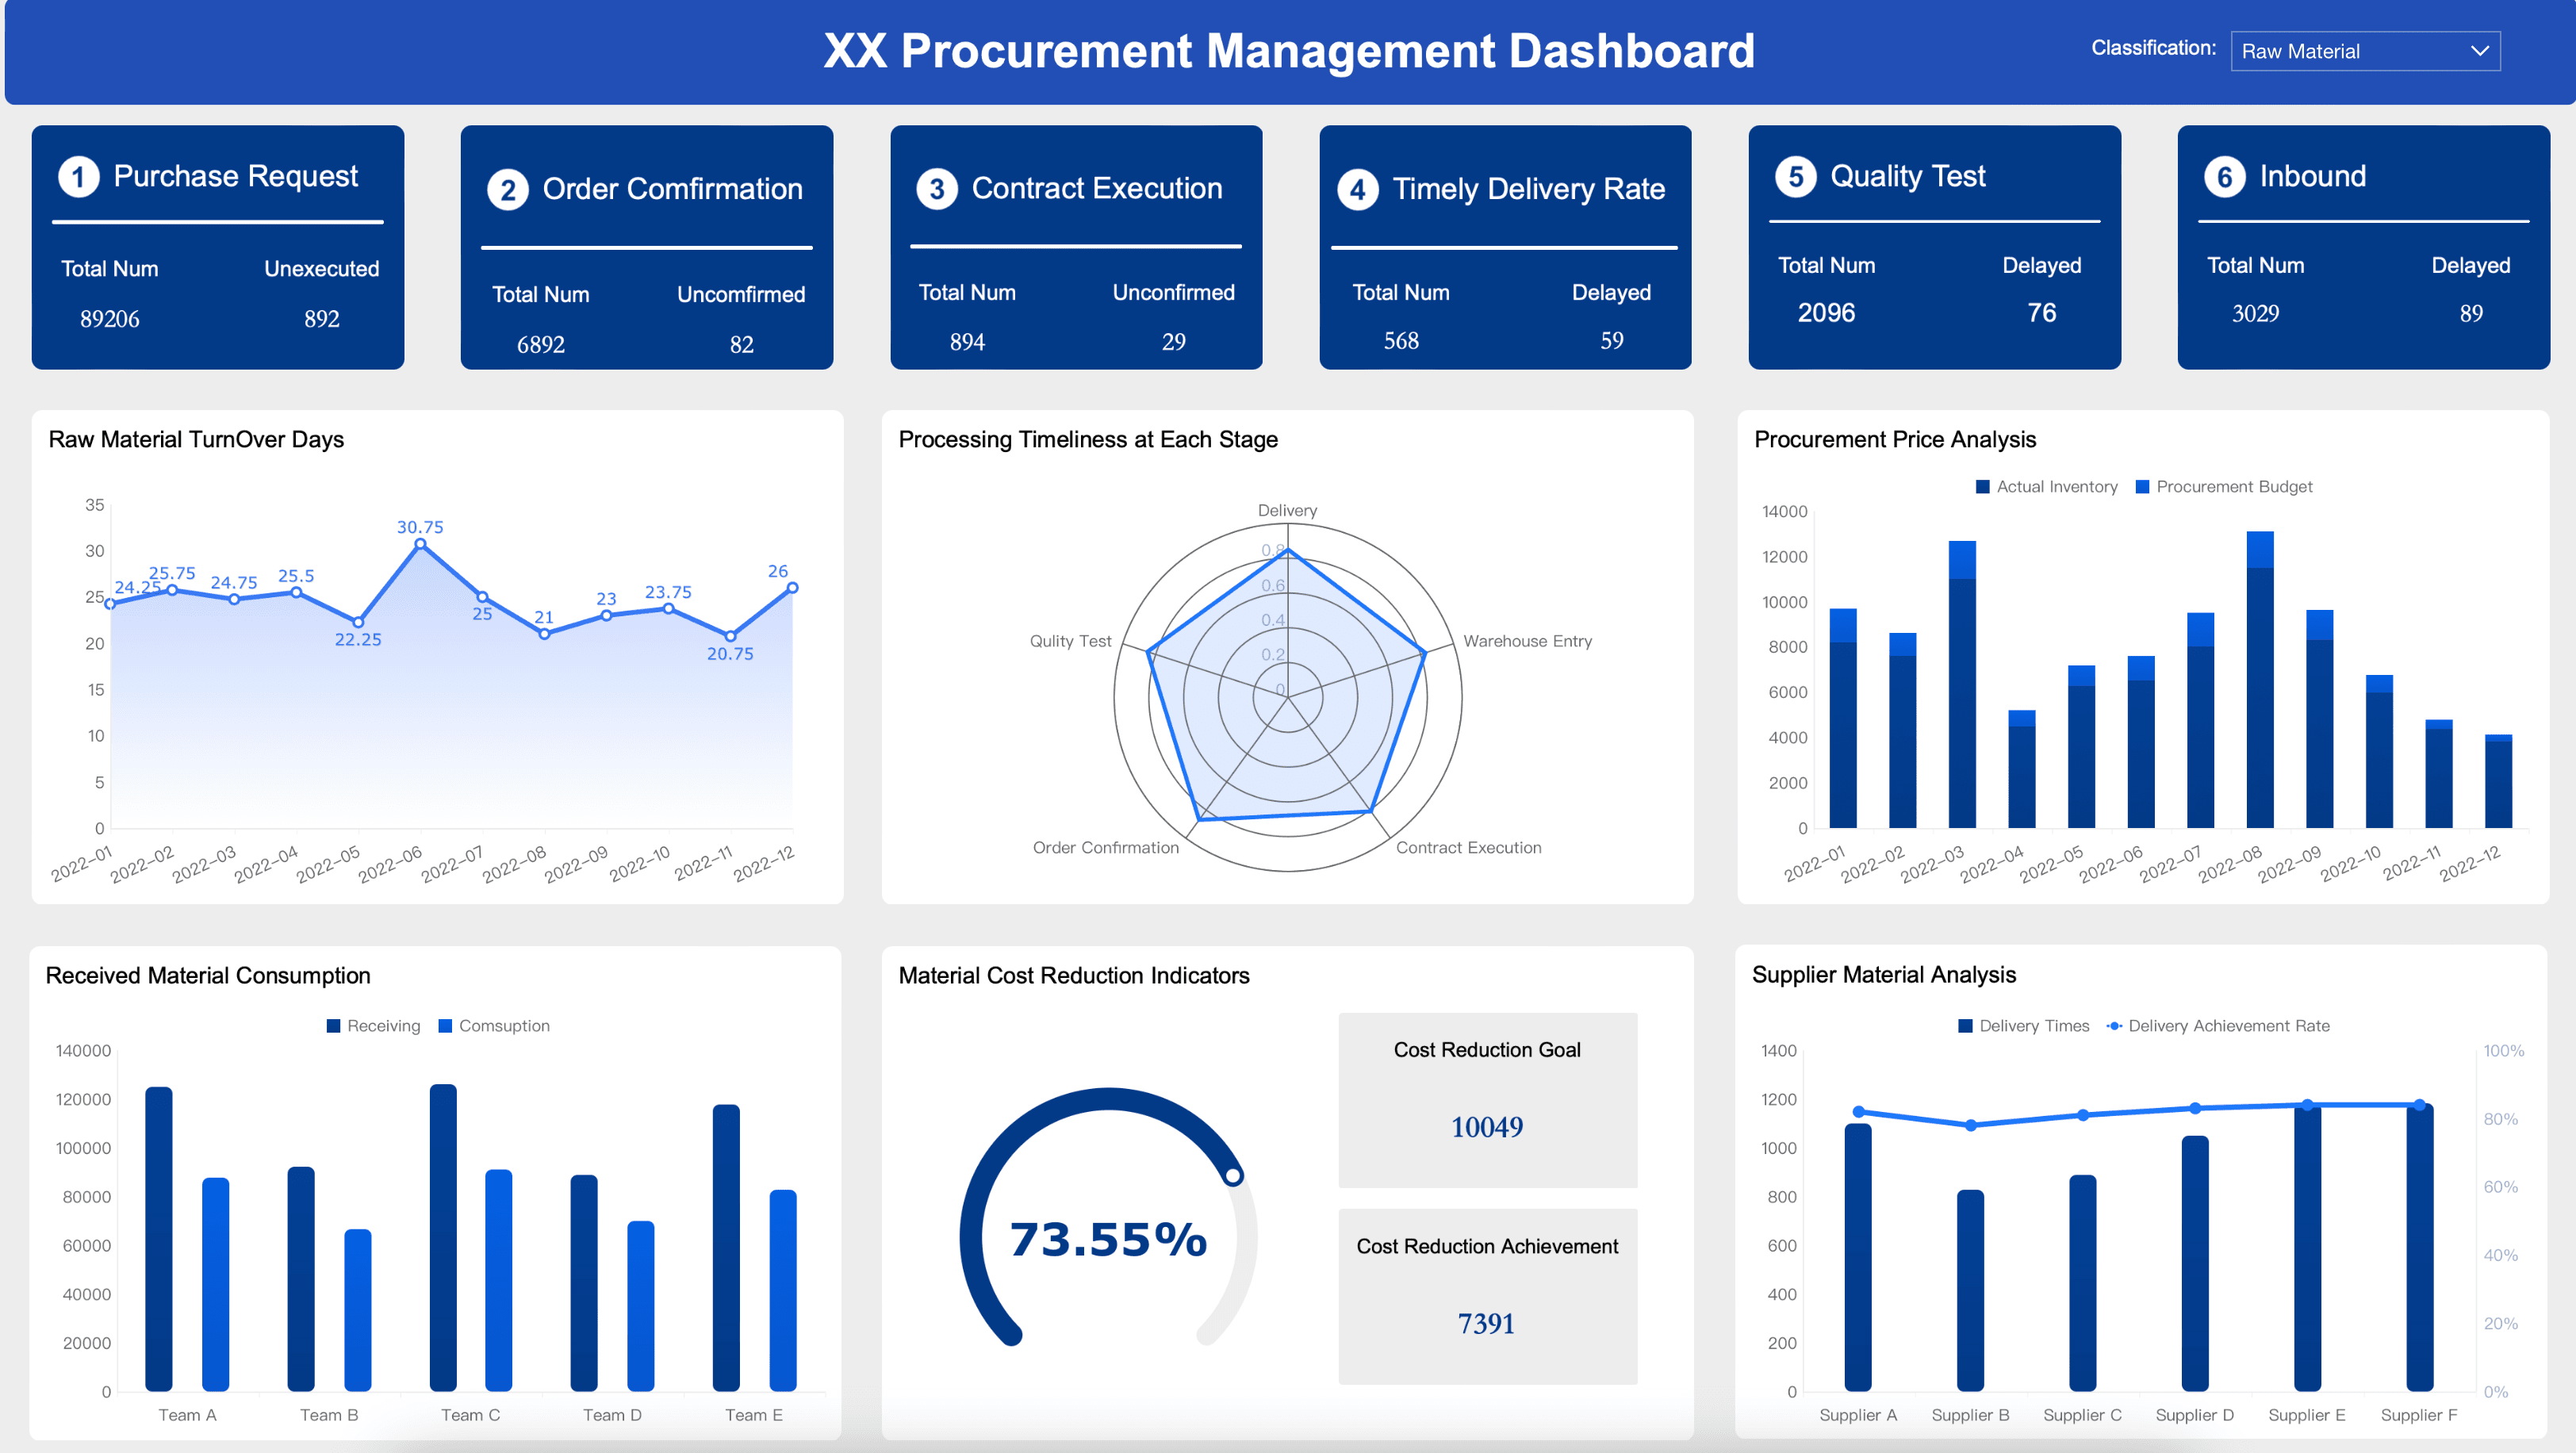
Operational dashboard examples are built for real-time monitoring of day-to-day business processes. Common examples include a customer support dashboard showing live ticket volume, average response time, and resolution rate; a supply chain dashboard tracking inventory levels, order fulfillment rates, and supplier lead times; and a manufacturing dashboard displaying production output, equipment downtime, and defect rates. Unlike strategic dashboards, operational examples typically refresh continuously and are designed to help frontline teams respond immediately to issues as they arise.
Marketing dashboard examples vary depending on the channel and campaign type. A digital marketing dashboard might display website traffic, bounce rate, conversion rate, and cost per lead pulled from sources like Google Analytics and paid ad platforms. A social media dashboard could track follower growth, engagement rate, and share of voice across channels. Campaign-specific dashboard examples show impressions, click-through rates, and ROI for individual initiatives. These examples all share a focus on connecting marketing activity directly to measurable business outcomes.
The best business performance dashboard examples strike a balance between high-level overviews and the ability to drill down into specific areas. Strong examples include a company-wide KPI dashboard that tracks revenue, customer satisfaction, operational efficiency, and employee performance on a single screen; a department-level dashboard that lets functional leaders monitor their own team's contribution to overall goals; and a comparative dashboard that benchmarks current performance against historical periods or industry standards. The most effective examples are those built around the specific decisions the users need to make, rather than simply displaying all available data.
