
What Is a Sales Dashboard?
Sales Dashboard vs CRM Report
What’s the difference between a sales dashboard and a CRM report?
- Sales dashboards represent how you’re performing against strategic goals. And by goals, we mean specific business outcomes, such as targeted quarterly revenue or targeted new customers per month.
- CRM reports support your dashboards by representing the tactical processes or actions necessary to achieve the overall goals. Reports track and measure the success against targets for specific actions, such as daily outbound calls or email open rates.
More resources:
- Dive deeper on the question, "What is a dashboard?"
- Download interactive sales dashboard templates
Don't just collect data. Visualize what matters.
Download the Dashboard Guide to learn:
- 10 essential steps to build effective dashboards
- How to choose the right charts and avoid visual clutter
- 15 top-notch dashboard templates for 2026

Why Are Sales Dashboards Important?
Good dashboard design is an important way to ensure your sales teams are supporting the overall revenue goals of the organization. Here are the biggest reasons why you need an effective sales dashboard:
- Keep your teams aligned: Whether measuring rep activity or quarterly targets, a unified visual layout keeps your entire sales organization moving in the same direction.
- Provide a health check: Clean designs give you a realistic, real-time look at the health of your sales pipeline, helping you accurately forecast revenue.
- Hold your teams accountable: Make sure everyone provides value with visual metrics that help reps track their quota progress and help managers coach effectively.
Types of Sales Dashboards
Sales dashboards come in many flavors. While some are used to measure weekly progress against a quota, others have a longer-term focus on business growth.
- Strategic Sales Dashboards: These big-picture interfaces monitor long-term revenue goals. VPs of Sales and executives typically use them to find out how the entire sales organization is doing at any given time.
- Operational Sales Dashboards: These dashboards typically measure performance in a shorter time frame, tracking daily pipeline velocity and rep efficiency. Sales managers use them to spot at-risk deals immediately.
- Analytical Sales Dashboards: These layouts allow users to drill down into historical CRM data to explore trends, such as win/loss ratios across different territories or product lines.
How to Build a Sales Dashboard
- Who, what, how. Be clear about who the audience is, what they want, and how they’re going to use the dashboard. This means working with your stakeholders to identify the core visualizations that map directly to their goals and strategy.
- Be SMART. This popular acronym stands for Specific, Measurable, Attainable, Realistic, and Time-bound. This is a useful touchstone whenever you’re considering whether a metric should be included on your dashboard. SMART examples are metrics such as “revenue per region per month” or “new customers per quarter”.
- Iterate and evolve. Over time, see how you or your audience are using the set of visualizations and if you find that certain ones aren’t relevant, remove or replace them.
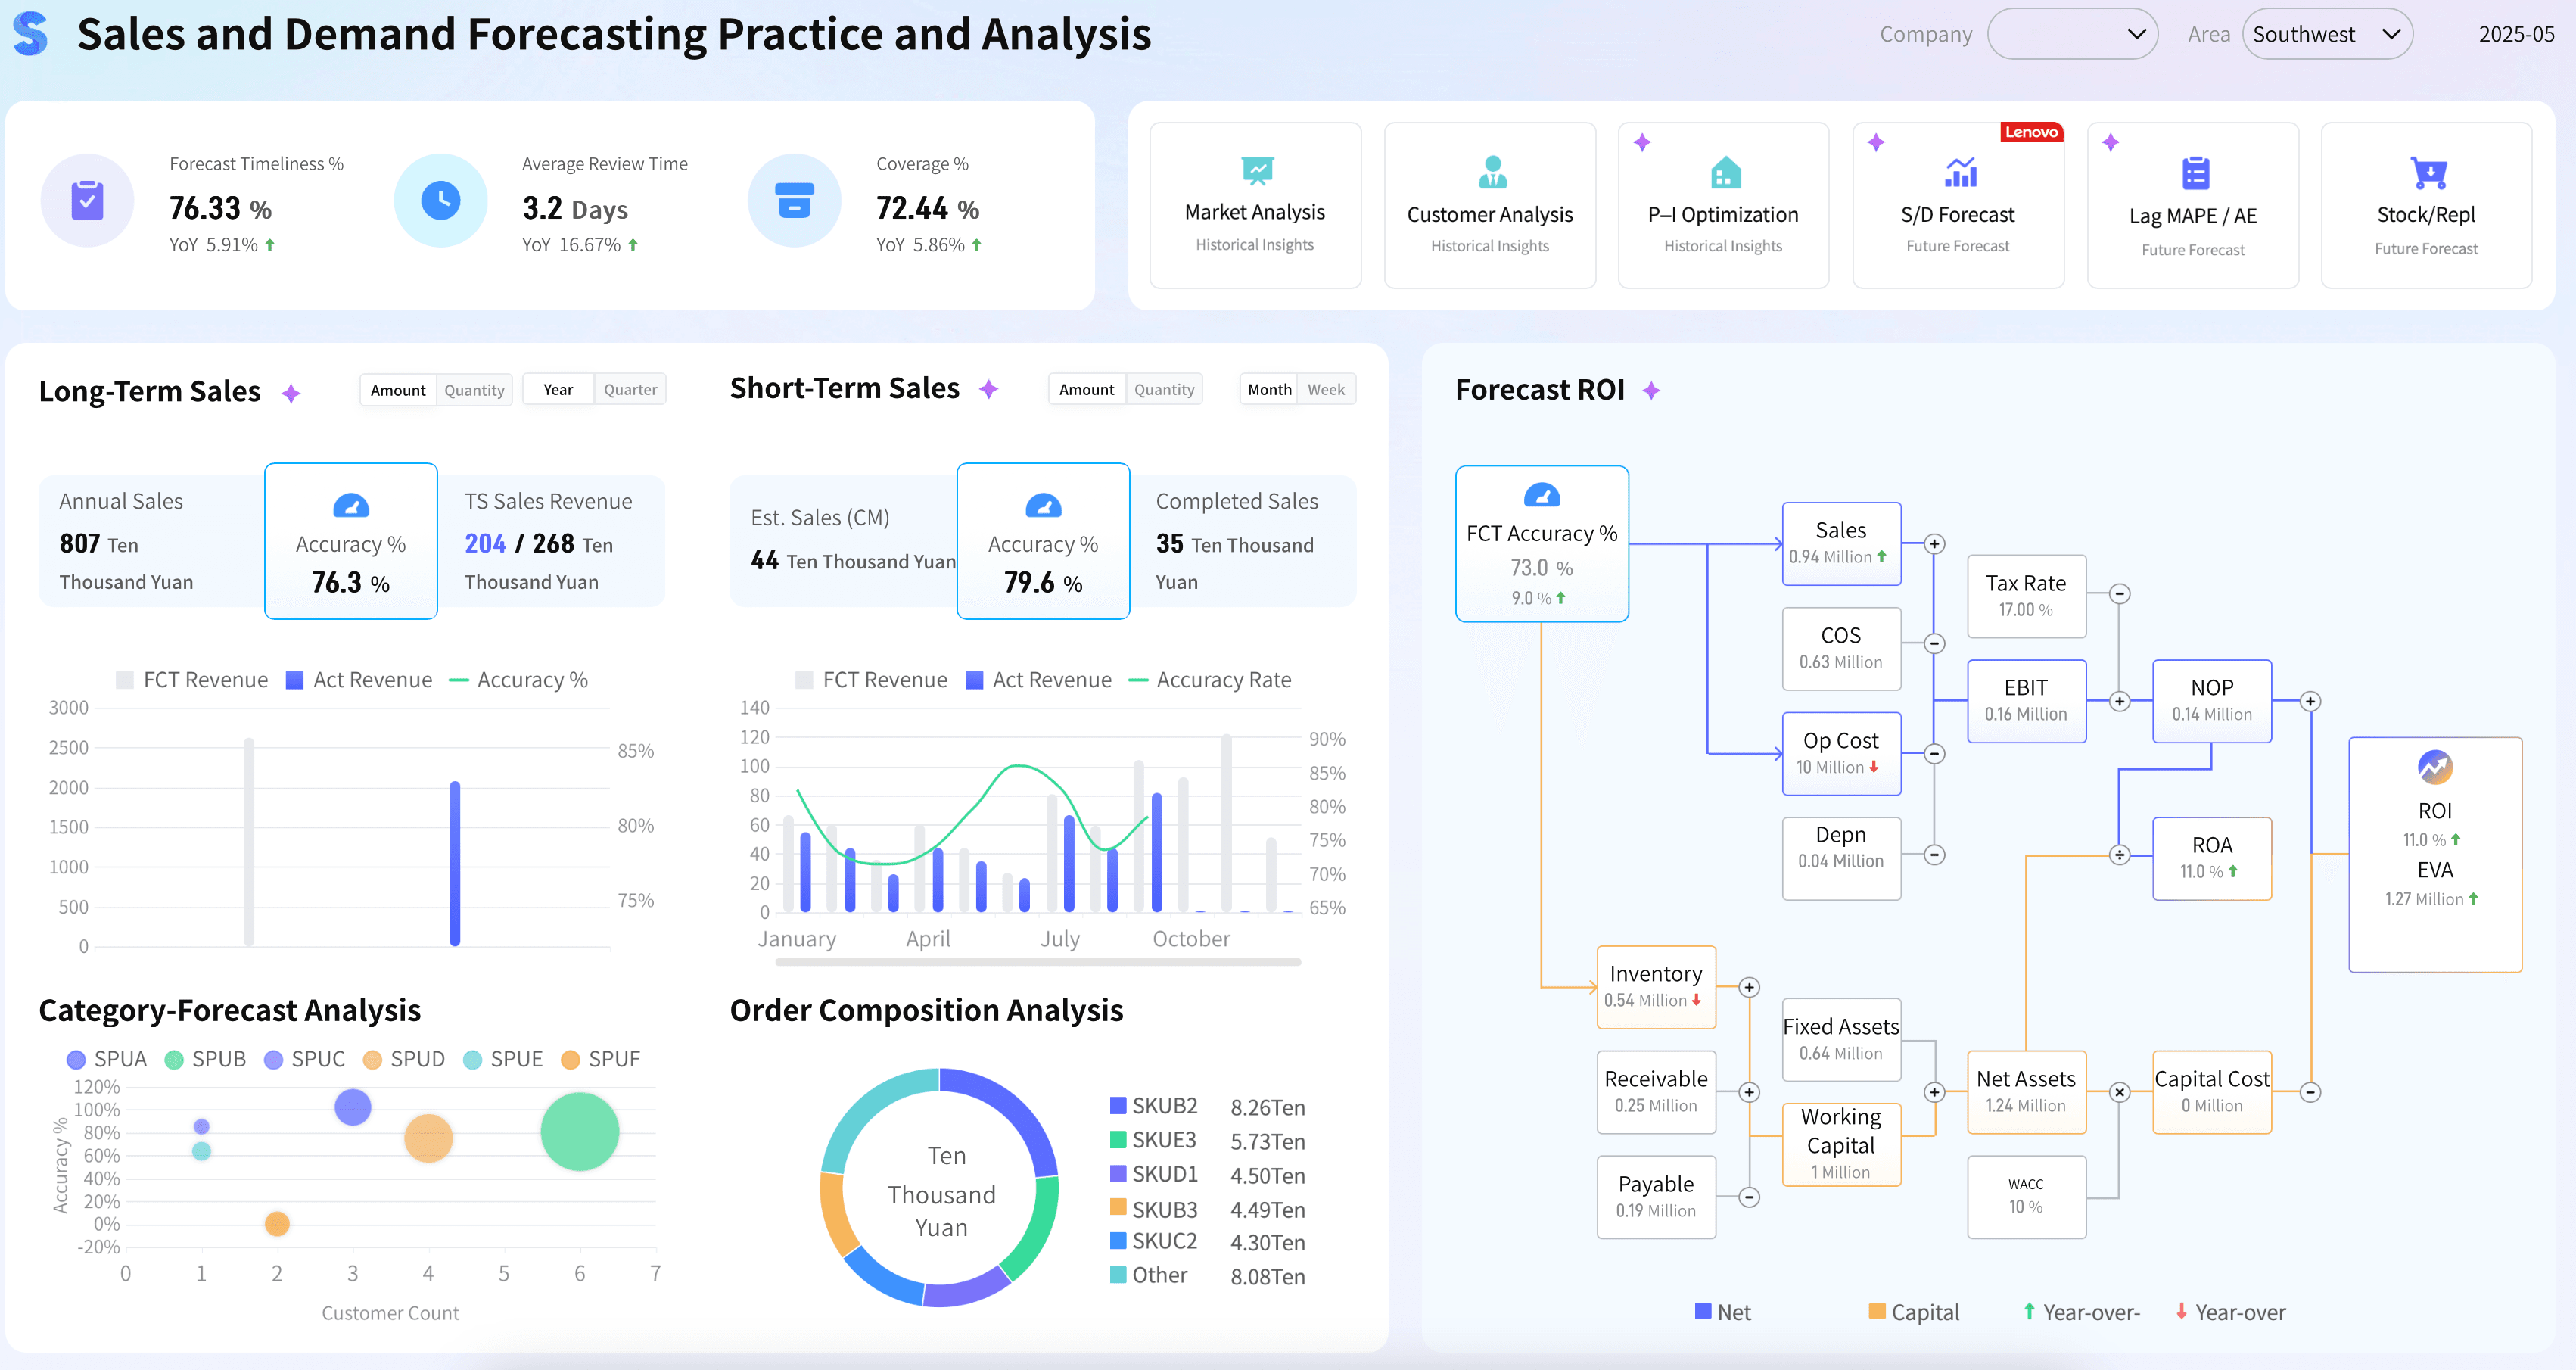
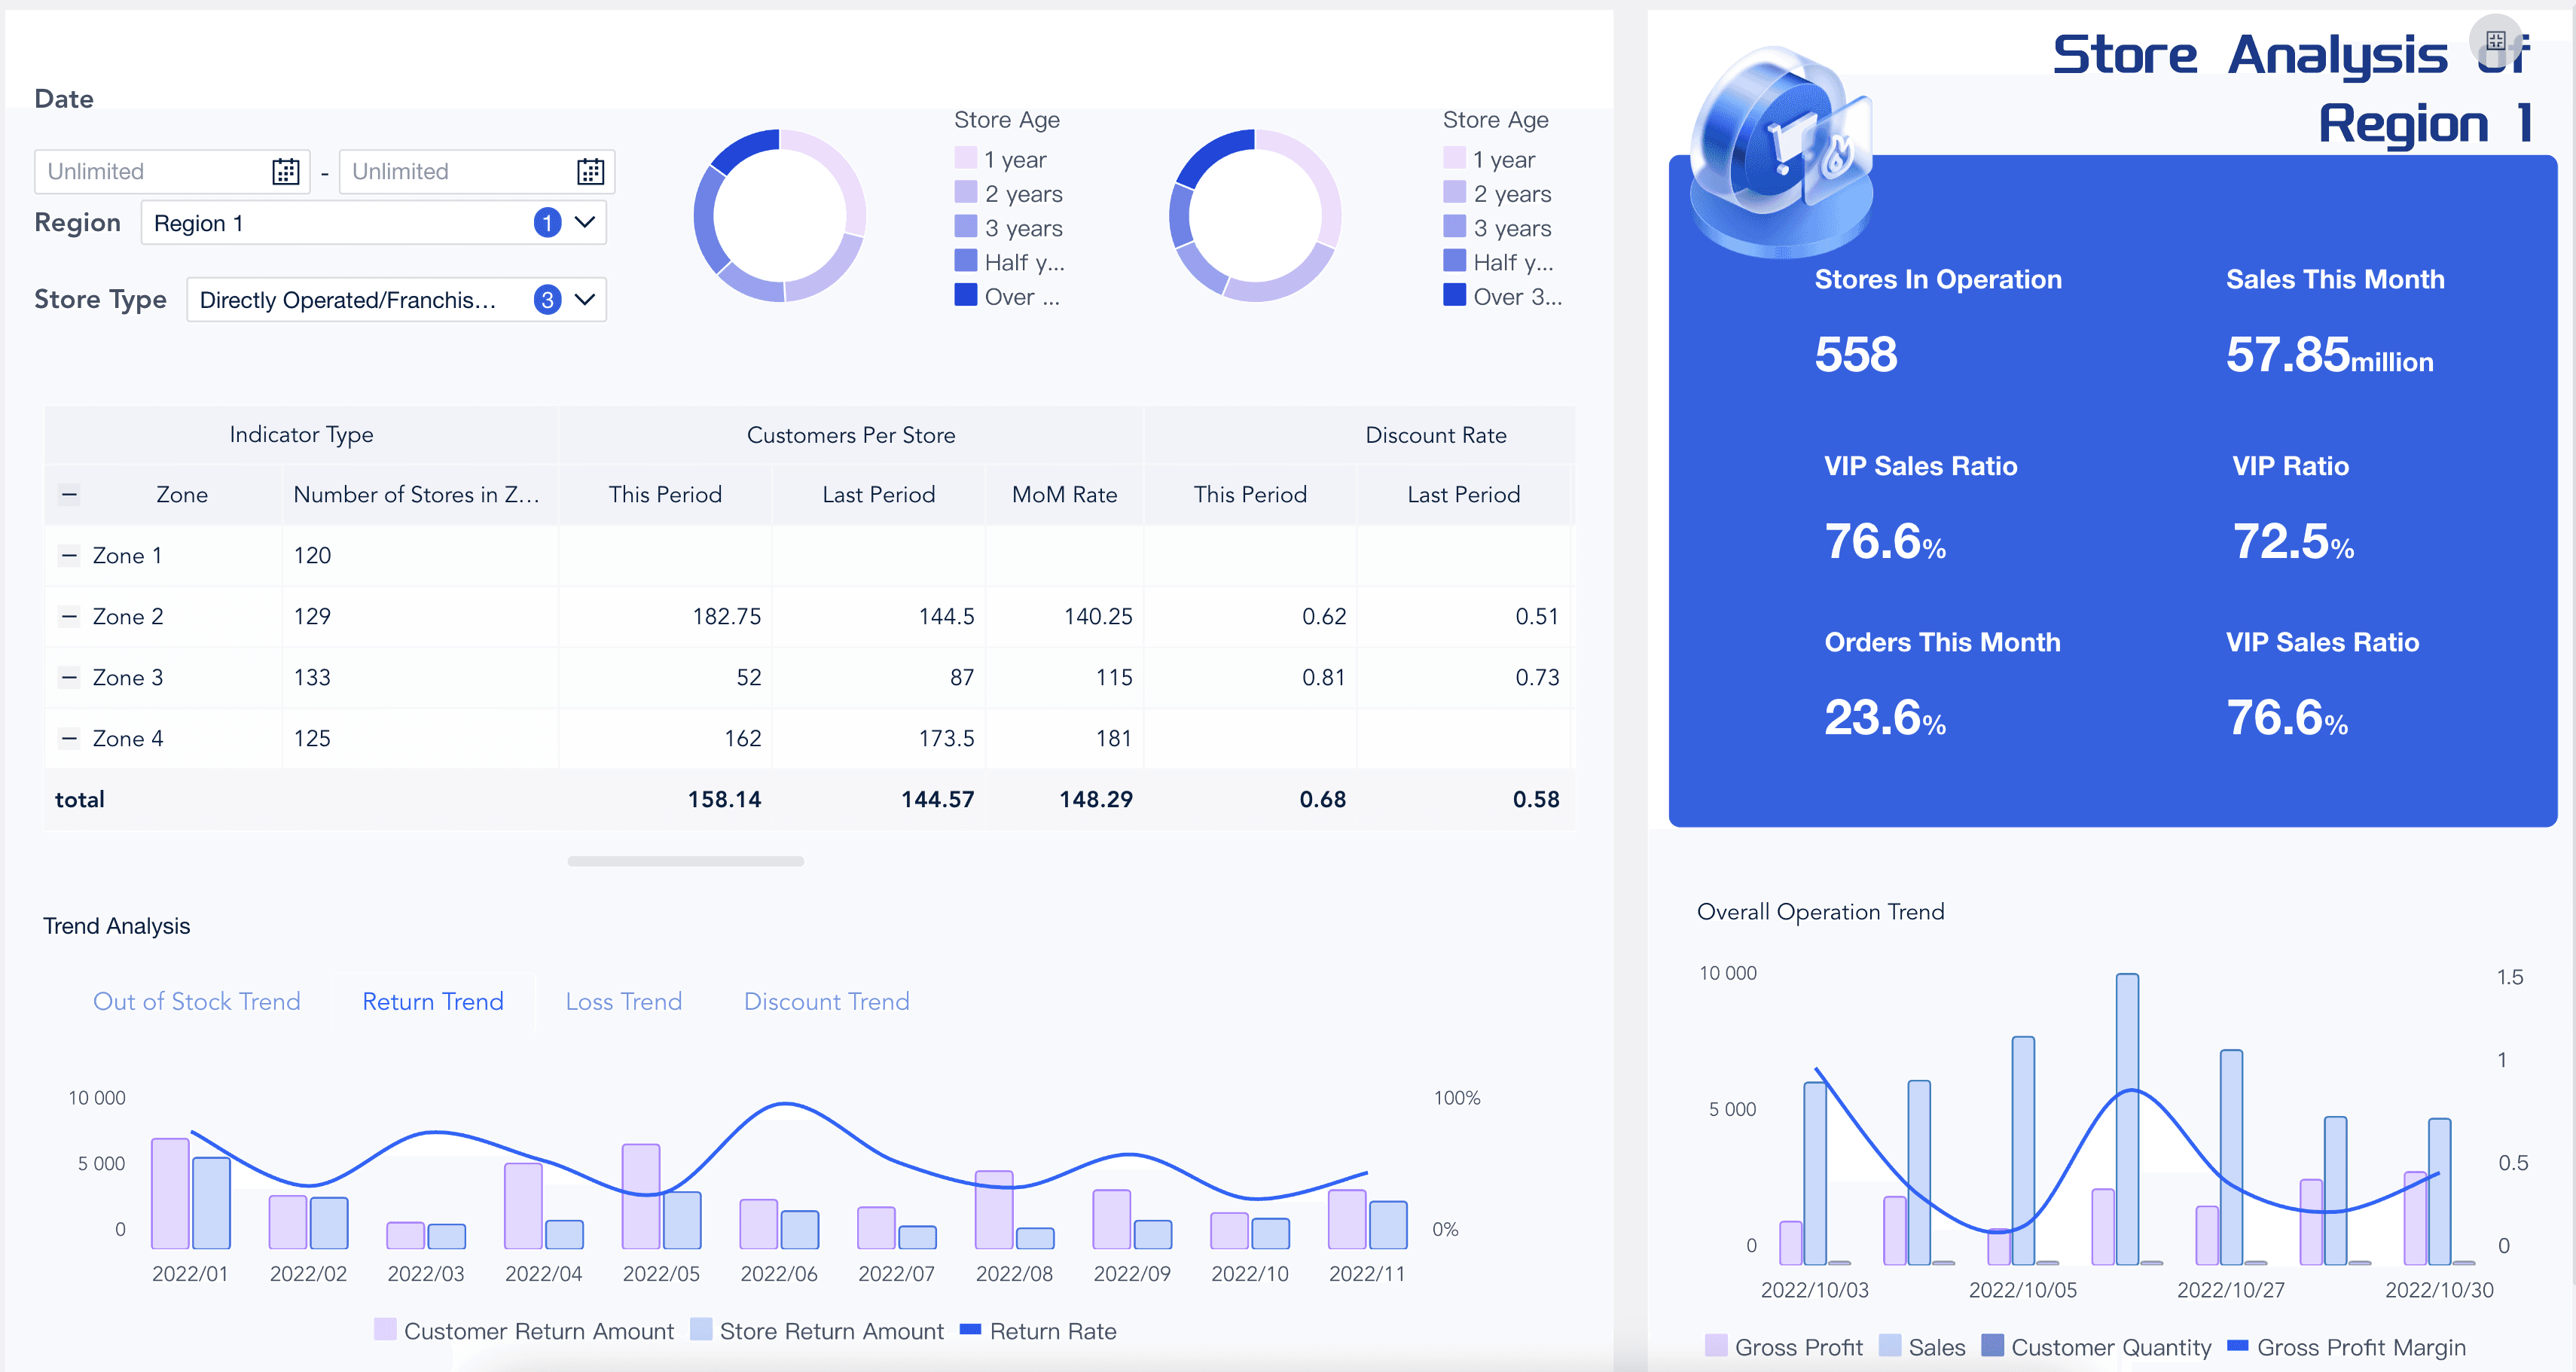
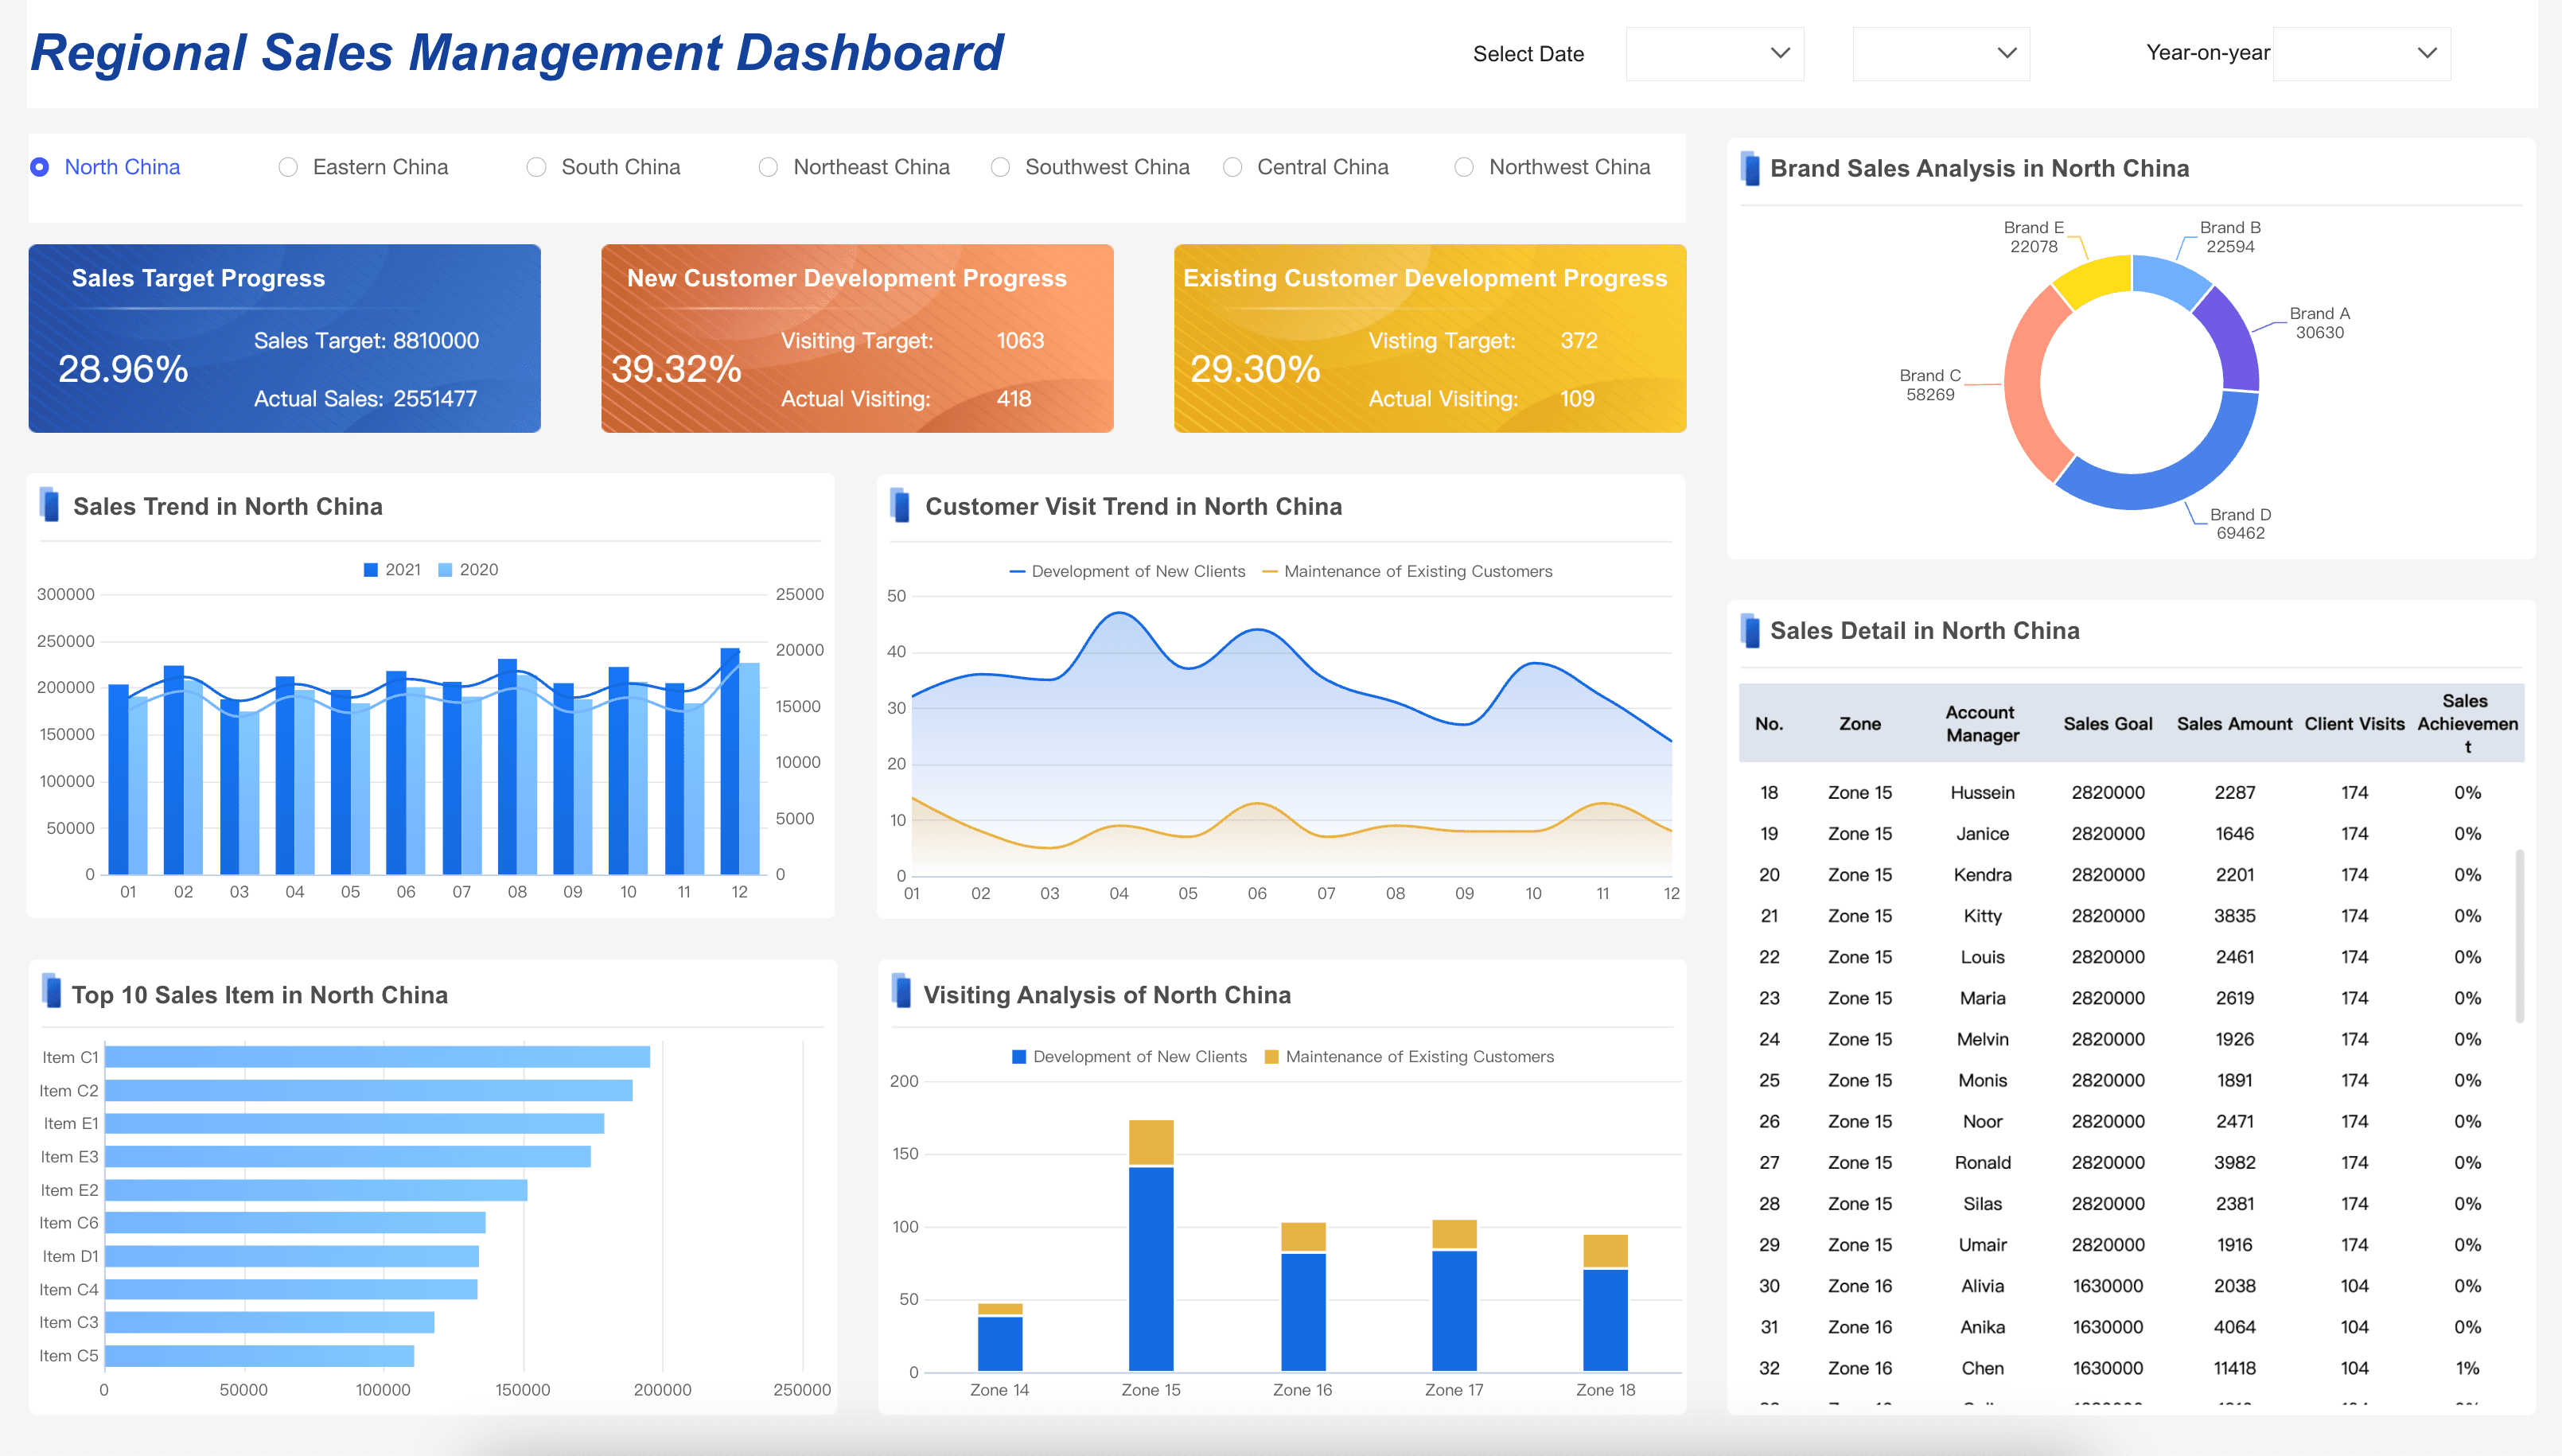
Sales Dashboard Examples
Sales leaders and their teams need to track the key performance indicators that help them close more orders. Below are the essential sales dashboard examples:

FAQs
A sales dashboard is a visual reporting tool that consolidates your most important sales metrics and KPIs into a single, real-time interface. It gives sales managers and reps an instant overview of pipeline health, revenue performance, team activity, and goal progress — eliminating the need to manually pull data from multiple sources. By centralizing this information, a sales dashboard helps teams stay aligned, spot opportunities, and course-correct before issues impact results.
The most valuable sales dashboard metrics typically include total revenue, revenue vs. target, number of deals closed, average deal size, sales cycle length, win rate, and pipeline value by stage. Activity metrics such as calls made, emails sent, and meetings booked are also useful for tracking rep performance. The right mix depends on your sales model — a B2B enterprise team will prioritize different metrics than a high-volume inside sales team, so always tie your selections back to your specific sales goals.
A sales dashboard is a live, interactive view designed for continuous monitoring — sales leaders check it daily or even hourly to track real-time performance and respond quickly to changes. A sales report is a structured, historical document produced on a scheduled basis, such as weekly or monthly, to provide a deeper analysis of trends, outcomes, and forecasts. Think of the dashboard as your day-to-day command center and the report as your periodic deep dive.
Sales dashboards are valuable at every level of a sales organization. Sales reps use individual performance dashboards to track their own quota attainment, activity metrics, and deal progress. Sales managers rely on team dashboards to monitor pipeline health, coach underperforming reps, and forecast revenue. Executives use high-level sales dashboards to review overall revenue trends, regional performance, and progress against company-wide targets. The key is to tailor the dashboard view and metrics to the specific decisions each user needs to make.
Start by identifying the audience and defining the specific sales questions the dashboard needs to answer. Then select only the metrics that directly reflect progress toward sales goals — resist the temptation to include every available data point. Choose clear, familiar visualizations such as bar charts for comparisons and line charts for trends, and make sure the layout puts the most critical KPIs front and center. Finally, connect your dashboard to a reliable, automated data source so it stays current without manual updates, and revisit the design regularly as your sales strategy evolves.
