You rely on data analysis and reporting tools to unlock actionable insights and drive business growth. Picking the right tool helps you perform analysis, optimize operational efficiency, and create reports that reveal data insights. FineReport and FineBI stand out for transforming raw data into business insights, helping you make data-driven decisions that improve revenue and reduce waste. These tools let you dig into data, select the right KPIs, and streamline processes. Modern businesses need solutions that support self-service analytics, advanced visualization, and secure, collaborative environments. When you choose a tool, look for features like integration, usability, scalability, and cost to ensure you get the best insights from your data.
What Are Data Analysis and Reporting Tools?
Definition and Core Functions
When you hear about data analysis and reporting tools for business insights, you might wonder what they actually do. These tools help you turn raw data into clear, understandable information. You use them to communicate your company’s operations and performance to your team and stakeholders. Data analysis and reporting tools for business insights go beyond just showing numbers. They help you dig into the reasons behind trends and patterns, making it easier to spot what’s working and what needs attention.
You’ll find that these tools offer a range of core functions. Here’s a quick look:
| Core Functions of Data Analysis and Reporting Tools for Business Insights |
|---|
| Collecting data from various sources |
| Analyzing data to derive insights |
| Visualizing data through dashboards and charts |
| Generating customized reports |
| Automating reporting workflows |
| Supporting informed decision-making |
With the right data analysis software, you can save time on report creation and deliver results faster. Many businesses now use self-service reporting tools and self-service dashboard creation to let anyone in the company explore data and build reports without waiting for IT support.
Business Value and Use Cases
Data analysis and reporting tools for business insights matter because they help you make smarter, data-driven decisions. You can use them to track sales, understand customer behavior, manage finances, and monitor projects. These tools support business intelligence by giving you access to real-time data and customizable dashboards that fit your needs.
Here are some common ways companies use data analytics platforms and data analytics software:
| Use Case | Description |
|---|---|
| Sales and Marketing Analysis | Track KPIs like sales goals and revenue, refine strategies, and improve ROI. |
| Customer Data Analysis | Understand customer preferences and improve service through detailed analysis. |
| Financial Analysis | Track financial metrics, find cost-saving opportunities, and support strategic planning. |
| Project Reporting | Get insights into project status and performance for better resource management. |
| Human Resources Analysis | Monitor HR KPIs to boost employee satisfaction and productivity. |
You’ll notice a shift toward self-service in business intelligence. Tools like FineReport and FineBI make it easy for you to create customizable dashboards, perform big data analytics, and visualize data without needing advanced technical skills. These data visualization and reporting solutions let you explore analytics, uncover insights, and share findings across your organization. As a result, you can respond quickly to changes, stay competitive, and drive business growth with data-driven strategies.
Criteria for Choosing Data Analysis and Reporting Tools
When you look for data analytics tools, you want to make sure they help you get the most out of your data. Data analysis and reporting tools give you the power to turn raw data into clear insights. These insights help you make data-driven decisions and improve your business intelligence. But not every tool fits every business. You need to know what to look for so you can pick the right one for your needs.
Key Features to Evaluate
You should start by checking the main features of any data analytics tool. The right features make it easier to collect, process, and visualize data. Here’s a quick table to help you compare:
| Criteria | Description |
|---|---|
| Assessing Data Volume | Estimate how much data you need to analyze and store. |
| Integration with Existing Systems | Make sure the tool works with your current data sources and systems. |
| Technical Features | Look for fast processing, strong analytics, and good data cleaning tools. |
| Usability | Choose a tool with a simple interface and mobile access. |
| Cost Considerations | Check if the price fits your budget and business size. |
| Vendor Reputation | Pick a vendor with a strong track record in analytics and business intelligence. |
FineReport and FineBI both offer user-friendly interfaces, strong analytics, and flexible data integration, making them great choices for many businesses.
Integration and Scalability
You want your analytics platform to grow with your business. Make sure the tool connects easily to your cloud data warehouse, CRM, ERP, and other systems. If a tool can’t scale or integrate well, you might face data silos and extra costs later. FineReport and FineBI both handle large data volumes and support seamless integration, so you can keep all your analytics in one place as your needs change.
Usability and Cost
Easy-to-use analytics tools save you time and help more people in your company find insights. Look for drag-and-drop dashboards, mobile access, and clear workflows. Cost matters too. For small businesses, setup costs can range from $1,000 to $20,000, with monthly fees starting at $100. Larger companies may pay more, but the right tool brings value by turning data into actionable insights. FineReport and FineBI offer flexible pricing and strong support, making them smart picks for businesses focused on data-driven growth.
Top 10 Data Analysis and Reporting Tools
Choosing the right data analysis tools can transform how you approach business insights. You want solutions that help you visualize data, automate reporting, and empower your team to make smarter decisions. Here’s a look at the top data analysis and reporting tools for business insights. Each tool brings unique strengths to the table, so you can find the best fit for your needs.
FineBI

FineBI is a self-service business intelligence platform designed to make data analysis accessible to everyone in your organization. You can connect to multiple data sources, prepare data, and build interactive dashboards—all without coding.
| Capability | Description |
|---|---|
| Data Management | Organize data by business subject using folders. |
| Data Modeling | Model data relationships and configure linkages for deeper analysis. |
| Visual Data Analysis | Get user-centric visual recommendations to spot data issues. |
| Self-Service Dataset | Add columns, filter, sort, and merge data with minimal learning curve. |
| Dashboard Function | Merge analytic data and generate unified reports for monitoring key indicators. |
| Collaboration Features | Share dashboards and collaborate with team members in real time. |
Pros:
- Zero-code interface for business users
- Real-time analytics and data visualization
- Scalable for large organizations
- Advanced data governance and permission control
Cons:
- Some advanced analytics features may require IT setup
Pricing:
- Flexible pricing based on user count and deployment
- Free trial available
Ideal Use Cases:
FineBI is perfect if you want to empower business users to perform independent data analysis, create dashboards, and share insights across departments. You’ll see value in industries like manufacturing, finance, and retail, where quick access to analytics drives better decisions.
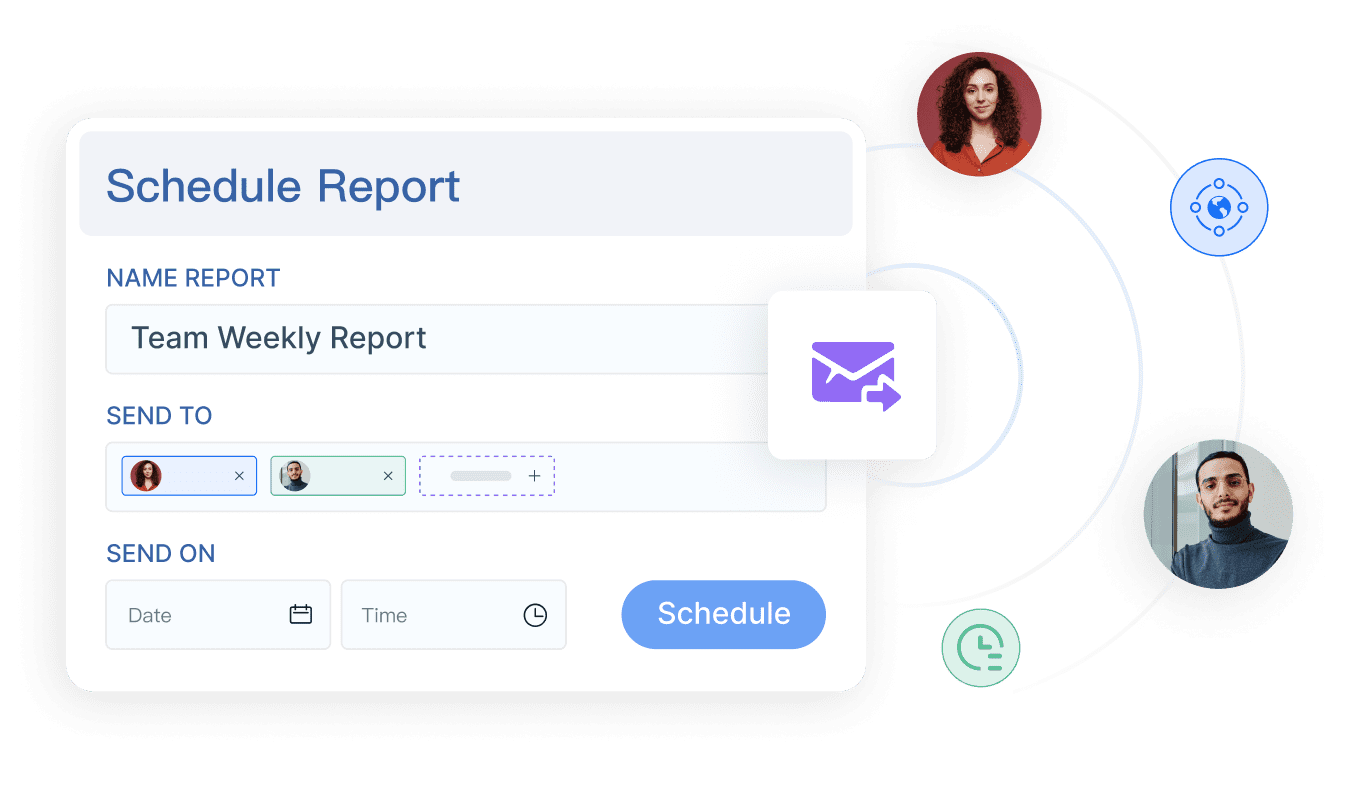
FineReport
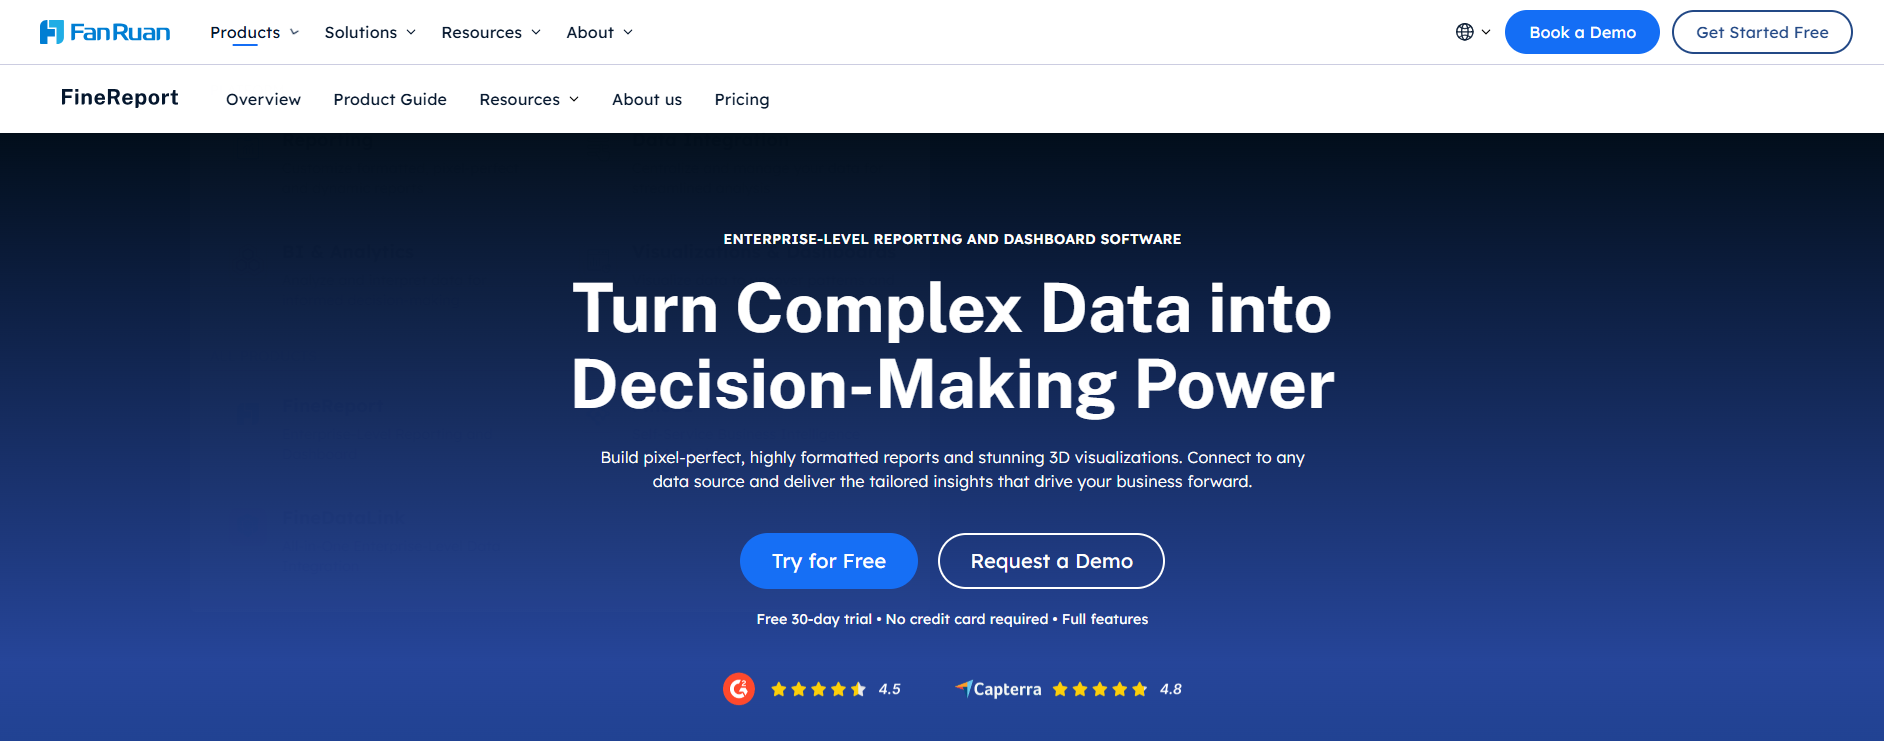
FineReport is an enterprise-level reporting and dashboard tool that helps you create pixel-perfect reports and advanced visualizations. You can connect to any data source, automate reporting, and build interactive dashboards for business insights.
| Feature | Description |
|---|---|
| Multi-Level Data Reporting | Supports various reporting styles, task notifications, and data entry settings for comprehensive reporting. |
| FVS Dashboard | Dedicated plugin for building dashboards and visualizations without coding. |
| Enhanced Chart Display | Advanced chart interactions, including linkage and dynamic updates. |
| Extended Chart | Innovative chart forms and effects for dashboard development. |
| Decision-making Platform | Centralized report center for better data analysis and management. |
| Task Schedule | Automates regular reporting tasks, streamlining workflows. |
Pros:
- Intuitive drag-and-drop report designer
- Supports complex reporting and data entry
- Seamless integration with multiple data sources
- Mobile access for dashboards and reports
Cons:
- May require initial setup by IT for enterprise deployment
Pricing:
- Custom pricing based on deployment and user needs
- Free trial available
Ideal Use Cases:
FineReport works best for organizations that need highly formatted reports, automated scheduling, and advanced dashboard layouts. You’ll benefit if you manage large datasets and require secure, collaborative reporting across teams.
Microsoft Power BI
Microsoft Power BI stands out as one of the most popular data analysis tools for business insights. You get a robust platform that supports advanced data visualization, seamless integration, and real-time analytics. Power BI makes it easy to create interactive dashboards and reports, even if you’re new to analytics.
Key Features:
- Advanced data visualization with custom charts and maps.
- Power Query for easy data import and transformation.
- Comprehensive reports with AI-driven smart narratives.
- Robust filtering and built-in data connectors.
- Natural language Q&A for quick answers.
- Flexible dashboard tiles for custom layouts.
- Integration with R for advanced analytics.
- PowerApps integration for mobile access.
Pros:
- User-friendly interface
- Strong integration with Microsoft ecosystem
- Powerful analytics and visualization options
Cons:
- Can be complex for beginners
- Premium features require additional licensing
Pricing:
- Free version available
- Pro starts at $10/user/month
- Premium plans for enterprise needs
Ideal Use Cases:
You’ll find Power BI works well for companies that need scalable analytics, interactive dashboards, and seamless integration with Microsoft products.
Tableau
Tableau is a leader in data analysis tools, known for its powerful visualization capabilities. You can drag and drop data to build dashboards and uncover insights quickly.
| Pros | Cons |
|---|---|
| Excellent data visualization capabilities | High cost of ownership |
| User-friendly drag-and-drop interface | Significant implementation and training costs |
| Ability to handle large datasets | Ongoing maintenance requirements |
| Outstanding integration with various data sources | Fragmented licensing for advanced features |
Pricing:
- Starts at $70/user/month for Creator
- Viewer and Explorer licenses available
Ideal Use Cases:
Tableau suits businesses that prioritize visual analytics and need to handle large datasets across multiple departments.
Qlik Sense
Qlik Sense offers a flexible analytics platform with associative data modeling. You can explore data freely, create interactive dashboards, and uncover hidden insights.
Key Features:
- Associative data engine for fast exploration
- Drag-and-drop dashboard creation
- Advanced analytics and data visualization
- Integration with cloud and on-premises sources
Pros:
- Strong self-service analytics
- Scalable for enterprise use
- Responsive design for mobile devices
Cons:
- Learning curve for new users
- Premium features require additional licensing
Pricing:
- Starts at $30/user/month
- Enterprise plans available
Ideal Use Cases:
Qlik Sense is ideal if you want flexible analytics and interactive dashboards for business insights, especially in data-driven industries.
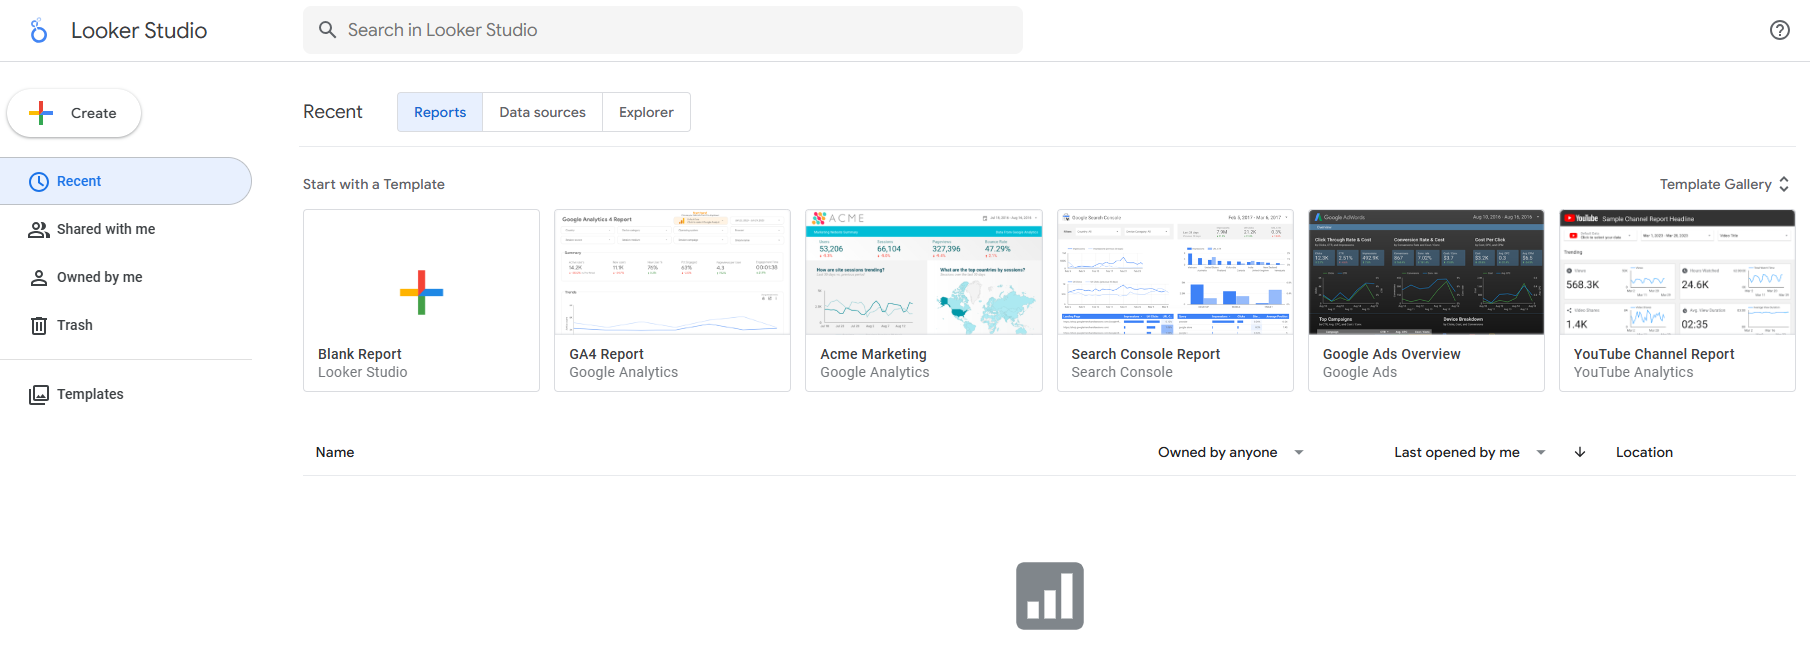
Google Data Studio
Google Data Studio is a free data analysis tool that integrates seamlessly with other Google services. You can build interactive dashboards and reports with real-time data updates.
| Feature | Benefit |
|---|---|
| Seamless integration | Changes in Google Sheets instantly update Data Studio reports. |
| Real-time data updates | No need to re-upload files, ensuring accurate reports. |
| Data Source | Description |
|---|---|
| Google Analytics | Website traffic and user behavior data. |
| Google Ads | Advertising performance metrics. |
| External Sources | Data from platforms like Facebook Ads or CRM tools. |
- Set permissions for team members.
- Share dashboards for real-time collaboration.
- Allow teammates to contribute to reports.
The unified platform enhances user experience by providing relevant data for improved reporting.
Pros:
- Free to use
- Easy integration with Google products
- Real-time collaboration
Cons:
- Limited advanced analytics features
- May not scale for very large datasets
Pricing:
- Free
Ideal Use Cases:
Google Data Studio is great for small businesses and teams that rely on Google services for data analytics and reporting.
Looker
Looker is a cloud-based data analysis tool that focuses on real-time insights and integration with the Google ecosystem.
| Strengths | Limitations |
|---|---|
| Strong integration with Google ecosystem | Performance issues with large datasets |
| Ease of use | Lack of advanced analytics capabilities |
| Real-time capabilities | Challenges with version control and support |
| Cost-effectiveness |
Pros:
- Real-time data analytics
- User-friendly interface
- Cost-effective for cloud deployments
Cons:
- May struggle with very large datasets
- Limited advanced analytics features
Pricing:
- Custom pricing based on usage and deployment
Ideal Use Cases:
Looker fits businesses that want cloud-based analytics and easy integration with Google services for fast insights.
SAP Analytics Cloud
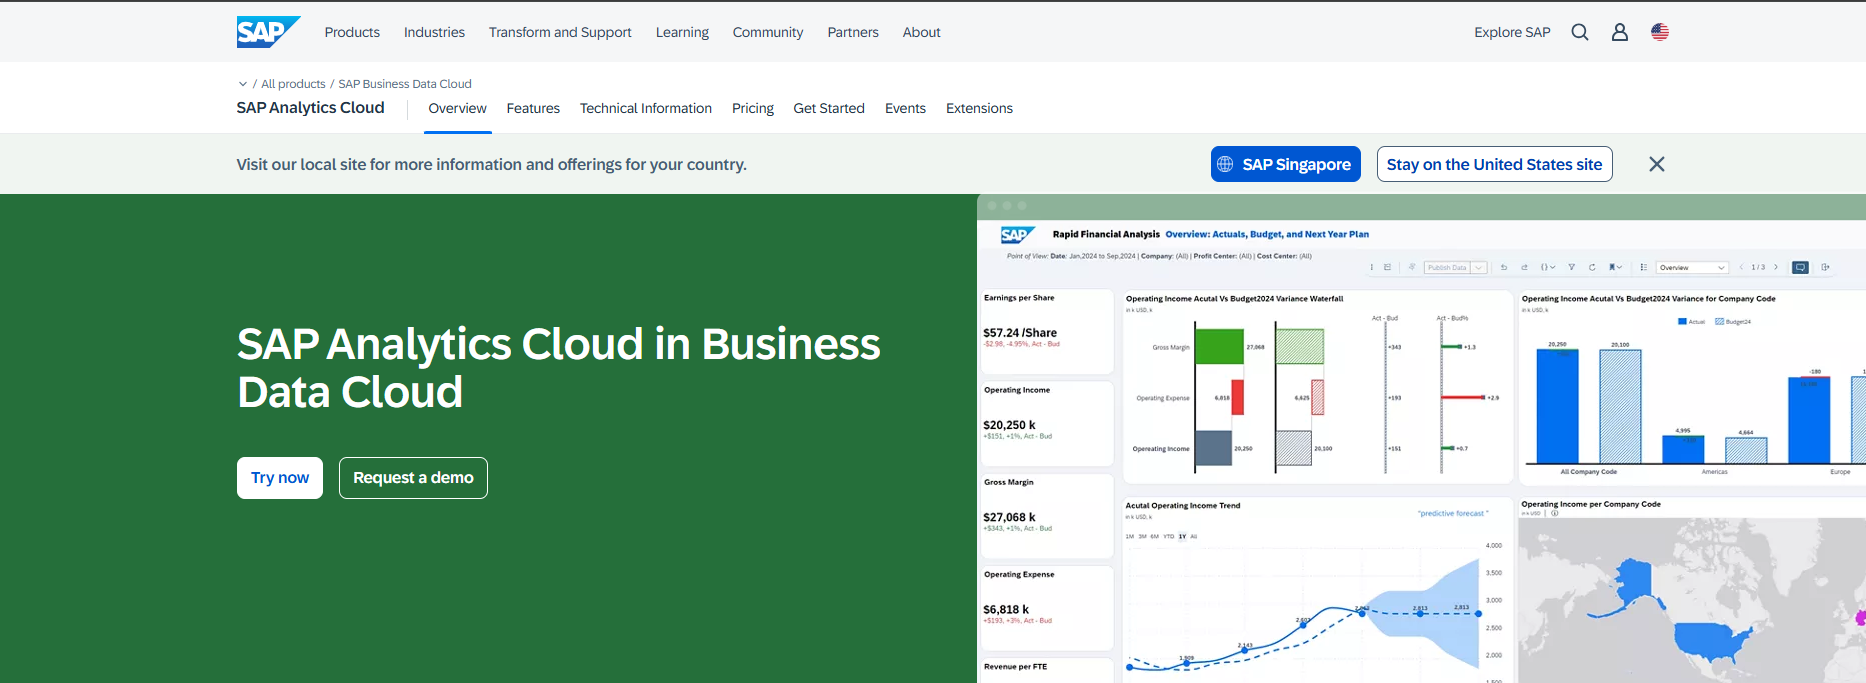
SAP Analytics Cloud combines analytics, planning, and predictive capabilities in one platform. You can use natural language queries and AI-driven planning tools to get deeper insights.
| Feature | Description |
|---|---|
| Admin and Service Management | Enhanced monitoring and optimized scheduling for data refreshes. |
| Just Ask (Natural Language Processing) | Query data using natural language for easy exploration. |
| AI for Planning & Analytics | Embedded AI tools for financial planning and predictive analytics. |
| Data Analyzer | Upgraded usability and data exploration features. |
Pros:
- All-in-one analytics and planning
- AI-powered insights
- Strong integration with SAP ecosystem
Cons:
- Higher cost for enterprise features
- May require SAP expertise for full deployment
Pricing:
- Starts at $36/user/month
- Enterprise plans available
Ideal Use Cases:
SAP Analytics Cloud is best for enterprises that need integrated analytics, planning, and predictive modeling.
Zoho Analytics
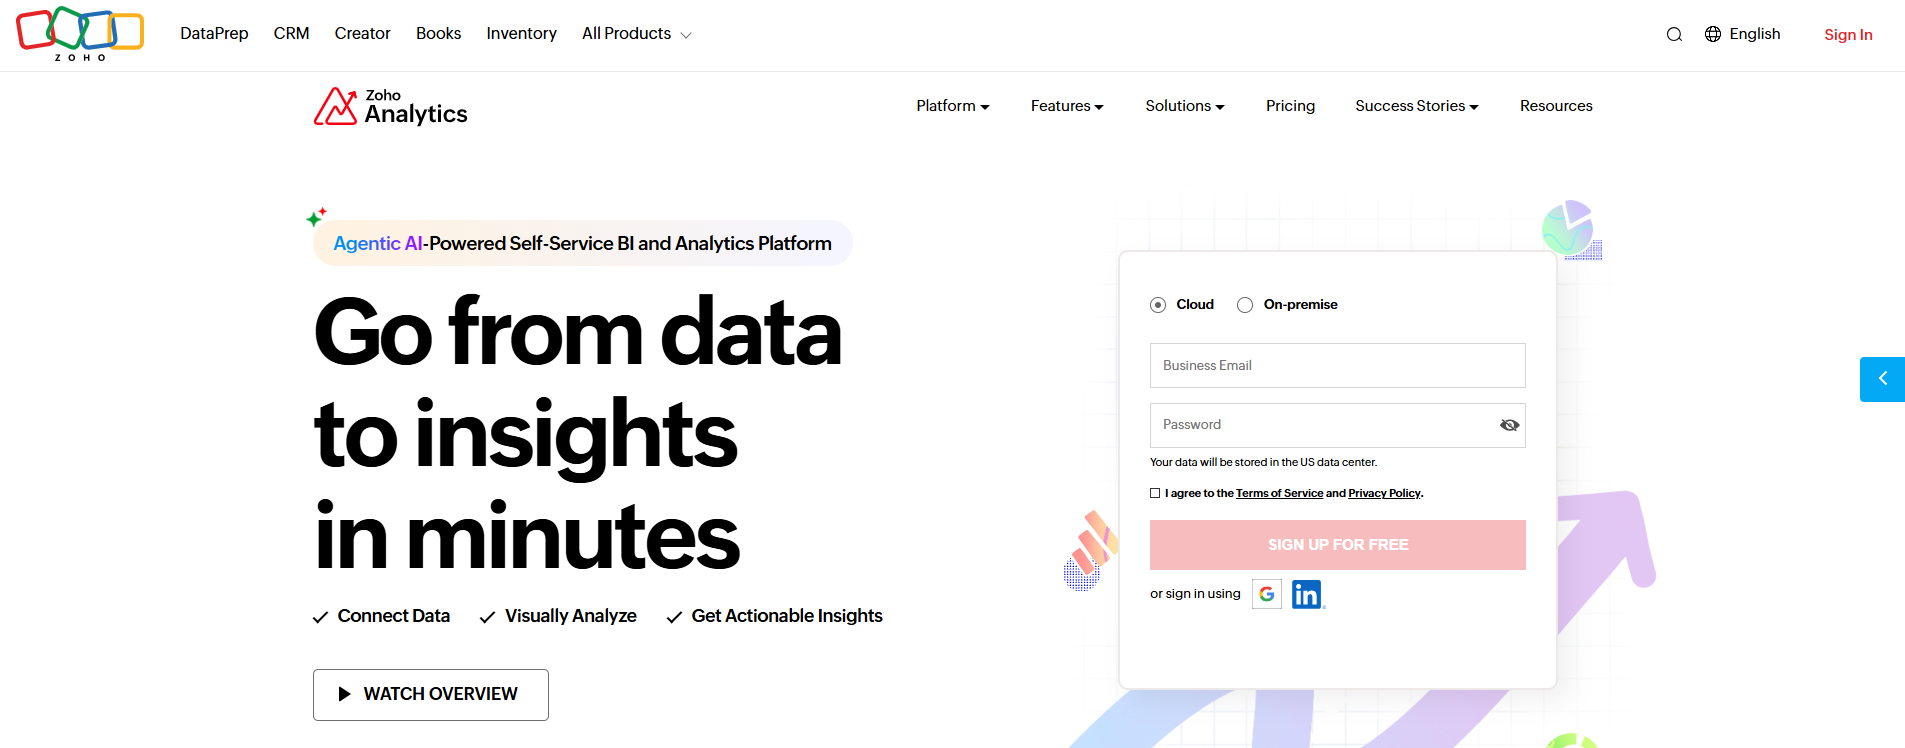
Zoho Analytics is a versatile data analysis tool for small and medium-sized businesses. You get advanced forecasting, anomaly detection, and trend analysis modules.
| Feature/Capability | Benefit for SMBs |
|---|---|
| Advanced forecasting | Predict future trends for better decisions. |
| Anomaly detection | Spot unusual patterns for quick response. |
| Trend-analysis modules | Track operational trends over time. |
| 250+ native connectors | Integrate data from various sources easily. |
| Drag-and-drop interface | Build reports and dashboards quickly. |
| Self-service prep features | Prepare data without heavy IT involvement. |
| Pre-built reports | Save time with ready-to-use insights. |
| Automated insights | Get contextual insights automatically. |
| Mobile BI apps | Access insights on-the-go. |
Pros:
- Affordable for SMBs
- Easy to use
- Wide range of connectors
Cons:
- Limited scalability for very large enterprises
- Advanced analytics features may require upgrades
Pricing:
- Starts at $24/month for two users
- Scales with user count and features
Ideal Use Cases:
Zoho Analytics is perfect for small and medium businesses that want affordable, easy-to-use data analysis tools for business insights.
Sisense

Sisense is a modern analytics platform known for embedded analytics and AI-driven insights. You can build custom dashboards and integrate analytics into your applications.
- Sisense's AnPaaS (Analytics Platform as a Service) leads the way in embedded analytics.
- The platform offers a complete stack for embedded analytics development.
- Investments in AI capabilities through Sisense Intelligence enhance data insights and decision-making.
Pros:
- Flexible embedded analytics
- Strong AI-driven insights
- Developer-friendly platform
Cons:
- May require technical expertise for full customization
- Pricing can be complex for large deployments
Pricing:
- Custom pricing based on deployment and usage
Ideal Use Cases:
Sisense is ideal for companies that want to embed analytics into their products and leverage AI for deeper business insights.
You have many choices when it comes to data analysis and reporting tools for business insights. Each tool offers unique features, pricing, and strengths. FineBI and FineReport stand out for their self-service analytics, advanced reporting, and enterprise-ready dashboards. You can use these data analysis tools to unlock insights, streamline workflows, and drive smarter decisions across your organization.
Data Analysis and Reporting Tools Comparison Table
When you compare data analysis tools, you want a quick way to see which one fits your business best. You need to look at usability, data integration, performance, and how well each tool helps you extract actionable insights. This table gives you a side-by-side view of the top data analysis tools for business use. You can spot which platform offers the dashboard features, analytics power, and reporting flexibility you need.
| Tool | Key Features | Pricing | Ideal Use Cases |
|---|---|---|---|
| FineReport | Drag-and-drop report designer, multi-source data integration, pixel-perfect reports, mobile dashboard, automated scheduling, advanced visualization | Custom, free trial | Enterprise reporting, complex analytics, automated insights, secure collaboration |
| FineBI | Self-service analytics, zero-code dashboard creation, real-time data integration, advanced governance, AI-driven insights | Custom, free trial | Business-led analytics, cross-department dashboards, rapid insights, scalable analytics |
| Microsoft Power BI | Interactive dashboards, strong Microsoft integration, AI analytics, natural language Q&A | Free, Pro $10/user/mo, Premium available | Scalable analytics, Microsoft ecosystem, interactive insights |
| Tableau | Advanced visualization, drag-and-drop interface, large data handling, strong integration | Starts $70/user/mo | Visual analytics, multi-department dashboards, deep insights |
| Qlik Sense | Associative analytics engine, flexible dashboards, mobile support, cloud/on-premises integration | Starts $30/user/mo | Flexible analytics, interactive dashboards, data exploration |
| Google Data Studio | Real-time data updates, Google integration, easy sharing, free to use | Free | Small business analytics, Google ecosystem, collaborative dashboards |
| Looker | Cloud-based analytics, real-time insights, Google integration, user-friendly | Custom | Cloud analytics, fast insights, Google-centric businesses |
| SAP Analytics Cloud | All-in-one analytics, AI planning, natural language queries, SAP integration | Starts $36/user/mo | Enterprise analytics, predictive insights, integrated planning |
| Zoho Analytics | Forecasting, anomaly detection, trend analysis, 250+ connectors, mobile BI | Starts $24/mo (2 users) | SMB analytics, affordable dashboards, quick insights |
| Sisense | Embedded analytics, AI-driven insights, developer-friendly, custom dashboards | Custom | Embedded analytics, product integration, AI-powered insights |
Tip: When you choose data analysis tools, focus on how easily your team can use them, how well they connect to your data, and how quickly you can turn analytics into real business insights.
This table helps you compare the most important features at a glance. You can see which data analysis tools offer the dashboard and analytics capabilities that match your business needs. FineReport and FineBI stand out for their flexible integration, strong analytics, and ability to deliver actionable insights across your organization.

How to Select the Right Data Analysis and Reporting Tools
Choosing data analysis and reporting tools for business insights can feel overwhelming. You want a solution that helps you turn raw data into clear insights and supports your business goals. These tools let you analyze trends, visualize performance, and share findings with your team. When you select the right platform, you unlock the power of analytics and make smarter decisions every day.
Assessing Business Needs
Start by understanding what you need from data analysis tools. Ask yourself what problems you want to solve and which departments will use the platform. Consider the types of data you work with—structured, unstructured, or big data. Think about the skills your team has and whether you need training. Make sure the tool offers strong data visualization so you can present insights clearly. Avoid common mistakes like not setting clear goals or using unprocessed data. Focus on the metrics that matter most to your business.
Step-by-step guide:
- Define your business goals and challenges.
- Identify users and their skill levels.
- List the types of data and analysis you need.
- Prioritize visualization and reporting features.
Integration with Existing Systems
Check how well data analytics tools fit with your current IT setup. Look for platforms that collect data from all your sources and connect easily to databases and cloud services. Make sure the tool offers APIs and connectors for quick deployment. FineReport and FineBI both excel at integrating with multiple systems, making them strong options for businesses with complex data environments.
- Confirm compatibility with your databases and cloud platforms.
- Choose tools that support seamless integration and fast setup.
Budget and ROI Considerations
Estimate the return on investment for your chosen data analysis tools. Use methods like tracking adoption rates, measuring data-driven changes, and analyzing customer satisfaction improvements. You can also look at product increments and assess your organization’s data maturity.
| Method | Description | Formula |
|---|---|---|
| Adoption | Measures user engagement | ((Value per active user * Active Users)/Cost of App)*100 |
| Customer Satisfaction | Quantifies improvements in satisfaction | ((Customer Value* New NPS)/Old NPS)/(Cost of Analysis)*100 |
| Product Increments | Evaluates financial impact of new features | ((product increment revenue)/Cost of Analysis)*100 |
Training and Support
Training and support help you get the most from your data analytics tools. Leading vendors offer free tutorials, paid courses, and quick-start guides. FineReport and FineBI provide user-friendly interfaces and strong support resources, making onboarding easy for your team.
| Vendor | Training Type | Link |
|---|---|---|
| Microsoft | Free tutorials | Microsoft Tutorials |
| Tableau | Free training videos | Tableau Training |
| RapidMiner | Free training modules | RapidMiner Academy |
Tip: When you choose data analysis and reporting tools for business insights, focus on your business needs, system compatibility, budget, and available training. FineReport and FineBI stand out for their flexibility, integration, and support, making them excellent choices for different scenarios.

You’ve seen how choosing the right data analysis tools can transform your business. Start by evaluating your current needs and testing a few top options.
Establishing efficient data workflows helps you make your processes seamless.
- Decide on your goals.
- Identify your users.
- Choose the data to analyze.
- Make insights easy to understand.
- Automate your reports.
| Feature | FineBI | FineReport |
|---|---|---|
| Target user | Business professionals, custom dashboards | Information personnel, formal reports |
| Purpose | Strategic decisions, business trends | Short-term support, fixed format reports |
| Type | BI tool, interactive analysis | Report tool, statistical analysis |
FineReport and FineBI offer comprehensive solutions for business intelligence. Try them to unlock deeper insights and drive smarter decisions.

Continue Reading About Data Analysis and Reporting Tools
How to Do Retention Analysis for Business Success
What is Pareto Chart and How Does it Work
How DuPont Analysis Helps You Understand Your Business


FAQ

The Author
Lewis
Senior Data Analyst at FanRuan
Related Articles

What Recruiters Look for in a Data Analysis Portfolio: 10 Criteria to Score Yours Fast
A $1 is not judged like a school assignment. It is judged like a hiring shortcut. Recruiters, hiring managers, and analytics leads use it to answer one question fast: Can this person solve business problems with data in
Lewis Chou
May 29, 2026

What Is Data Analytics Consulting? Beginner’s Guide to Services, Deliverables, and Business Value
$1 helps organizations turn raw data into decisions they can trust. For many business leaders, the challenge is not a lack of data. It is a lack of clarity. Reports conflict, teams track different KPIs, dashboards are un
Lewis Chou
Jun 03, 2026

Data Analyst Job Description [+2026 Guide]: Compare Responsibilities, Skills, and Salary by Industry
A strong $1 does more than list tasks. It defines how a company turns raw data into business decisions, which teams the analyst supports, and what measurable outcomes the role is expected to influence. For employers, tha
Lewis Chou
Jun 02, 2026