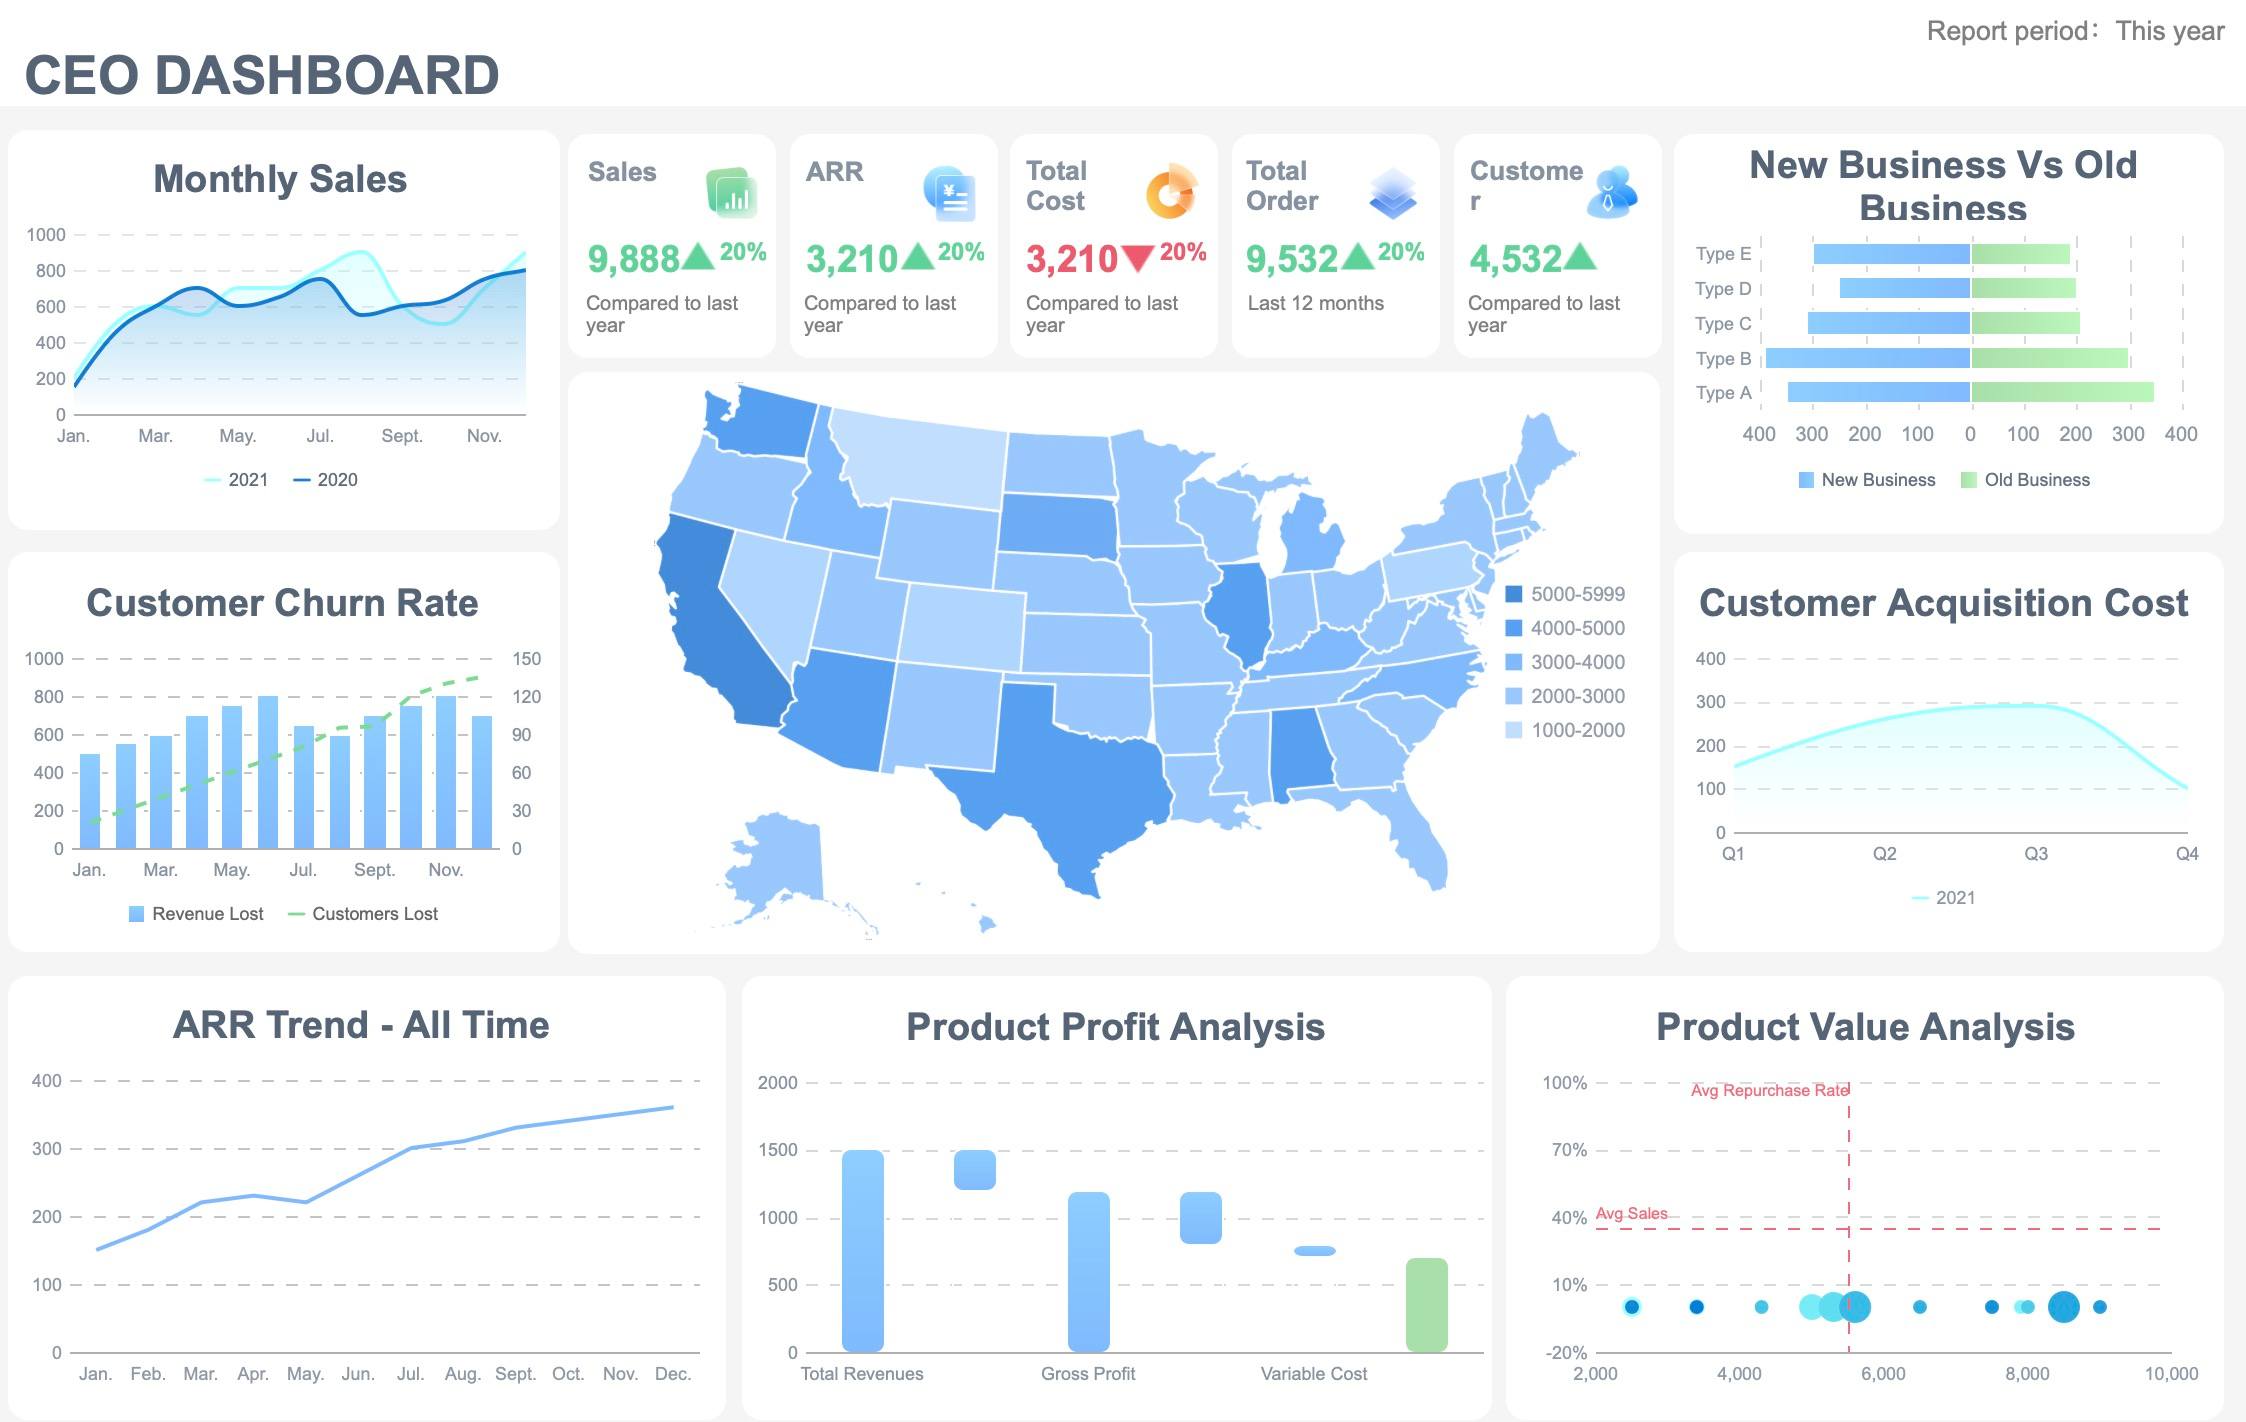
Data analysis tools help you turn raw information into clear insights. If you want to stay ahead, you need the best data analysis tools on your side. Many analysts use popular options like Python, R, Excel, SQL, and Splunk. You can see how self-service analytics has grown, with more people across companies using BI and analytics tools every year. Tools like FineBI make it easier for everyone to access data, not just IT experts. As you read, think about which tools match your own needs and goals.

You might wonder what data analysis tools actually do. These tools help you collect, process, and understand data. You use them to turn raw numbers and facts into useful information. Data analysis tools support every step of the analytics workflow. You can use them to gather data from different sources, clean it up, and make sure it is accurate. They help you create charts, graphs, and dashboards so you can see patterns and trends. You can also use these tools to share your findings with others in your team.
Data analysis tools play several key roles:
You do not need to be a data scientist to use these tools. Many data analytics tools offer user-friendly features that make analysis easier for everyone.
If you want to succeed as an analyst today, you need the right data analysis tools. These tools help you work faster and smarter. You can spot trends, solve problems, and make better decisions. Modern data analytics tools let you explore data on your own, without waiting for IT support. You can connect to many types of data, from spreadsheets to cloud databases. You can also create reports and share them with your team in real time.
Data analysis tools give you a competitive edge. You can respond quickly to changes in your business. You can also work with others to find new opportunities. With the right tools, you can turn data into real value for your organization.
Choosing the best data analysis tools for your work can feel overwhelming. You see new options every year, but some tools stand out for their power, flexibility, and future-ready features. Let’s walk through the top data analysis tools you should know. Each one brings something unique to the table, whether you want to dive into big data analytics, create stunning dashboards, or automate machine learning.

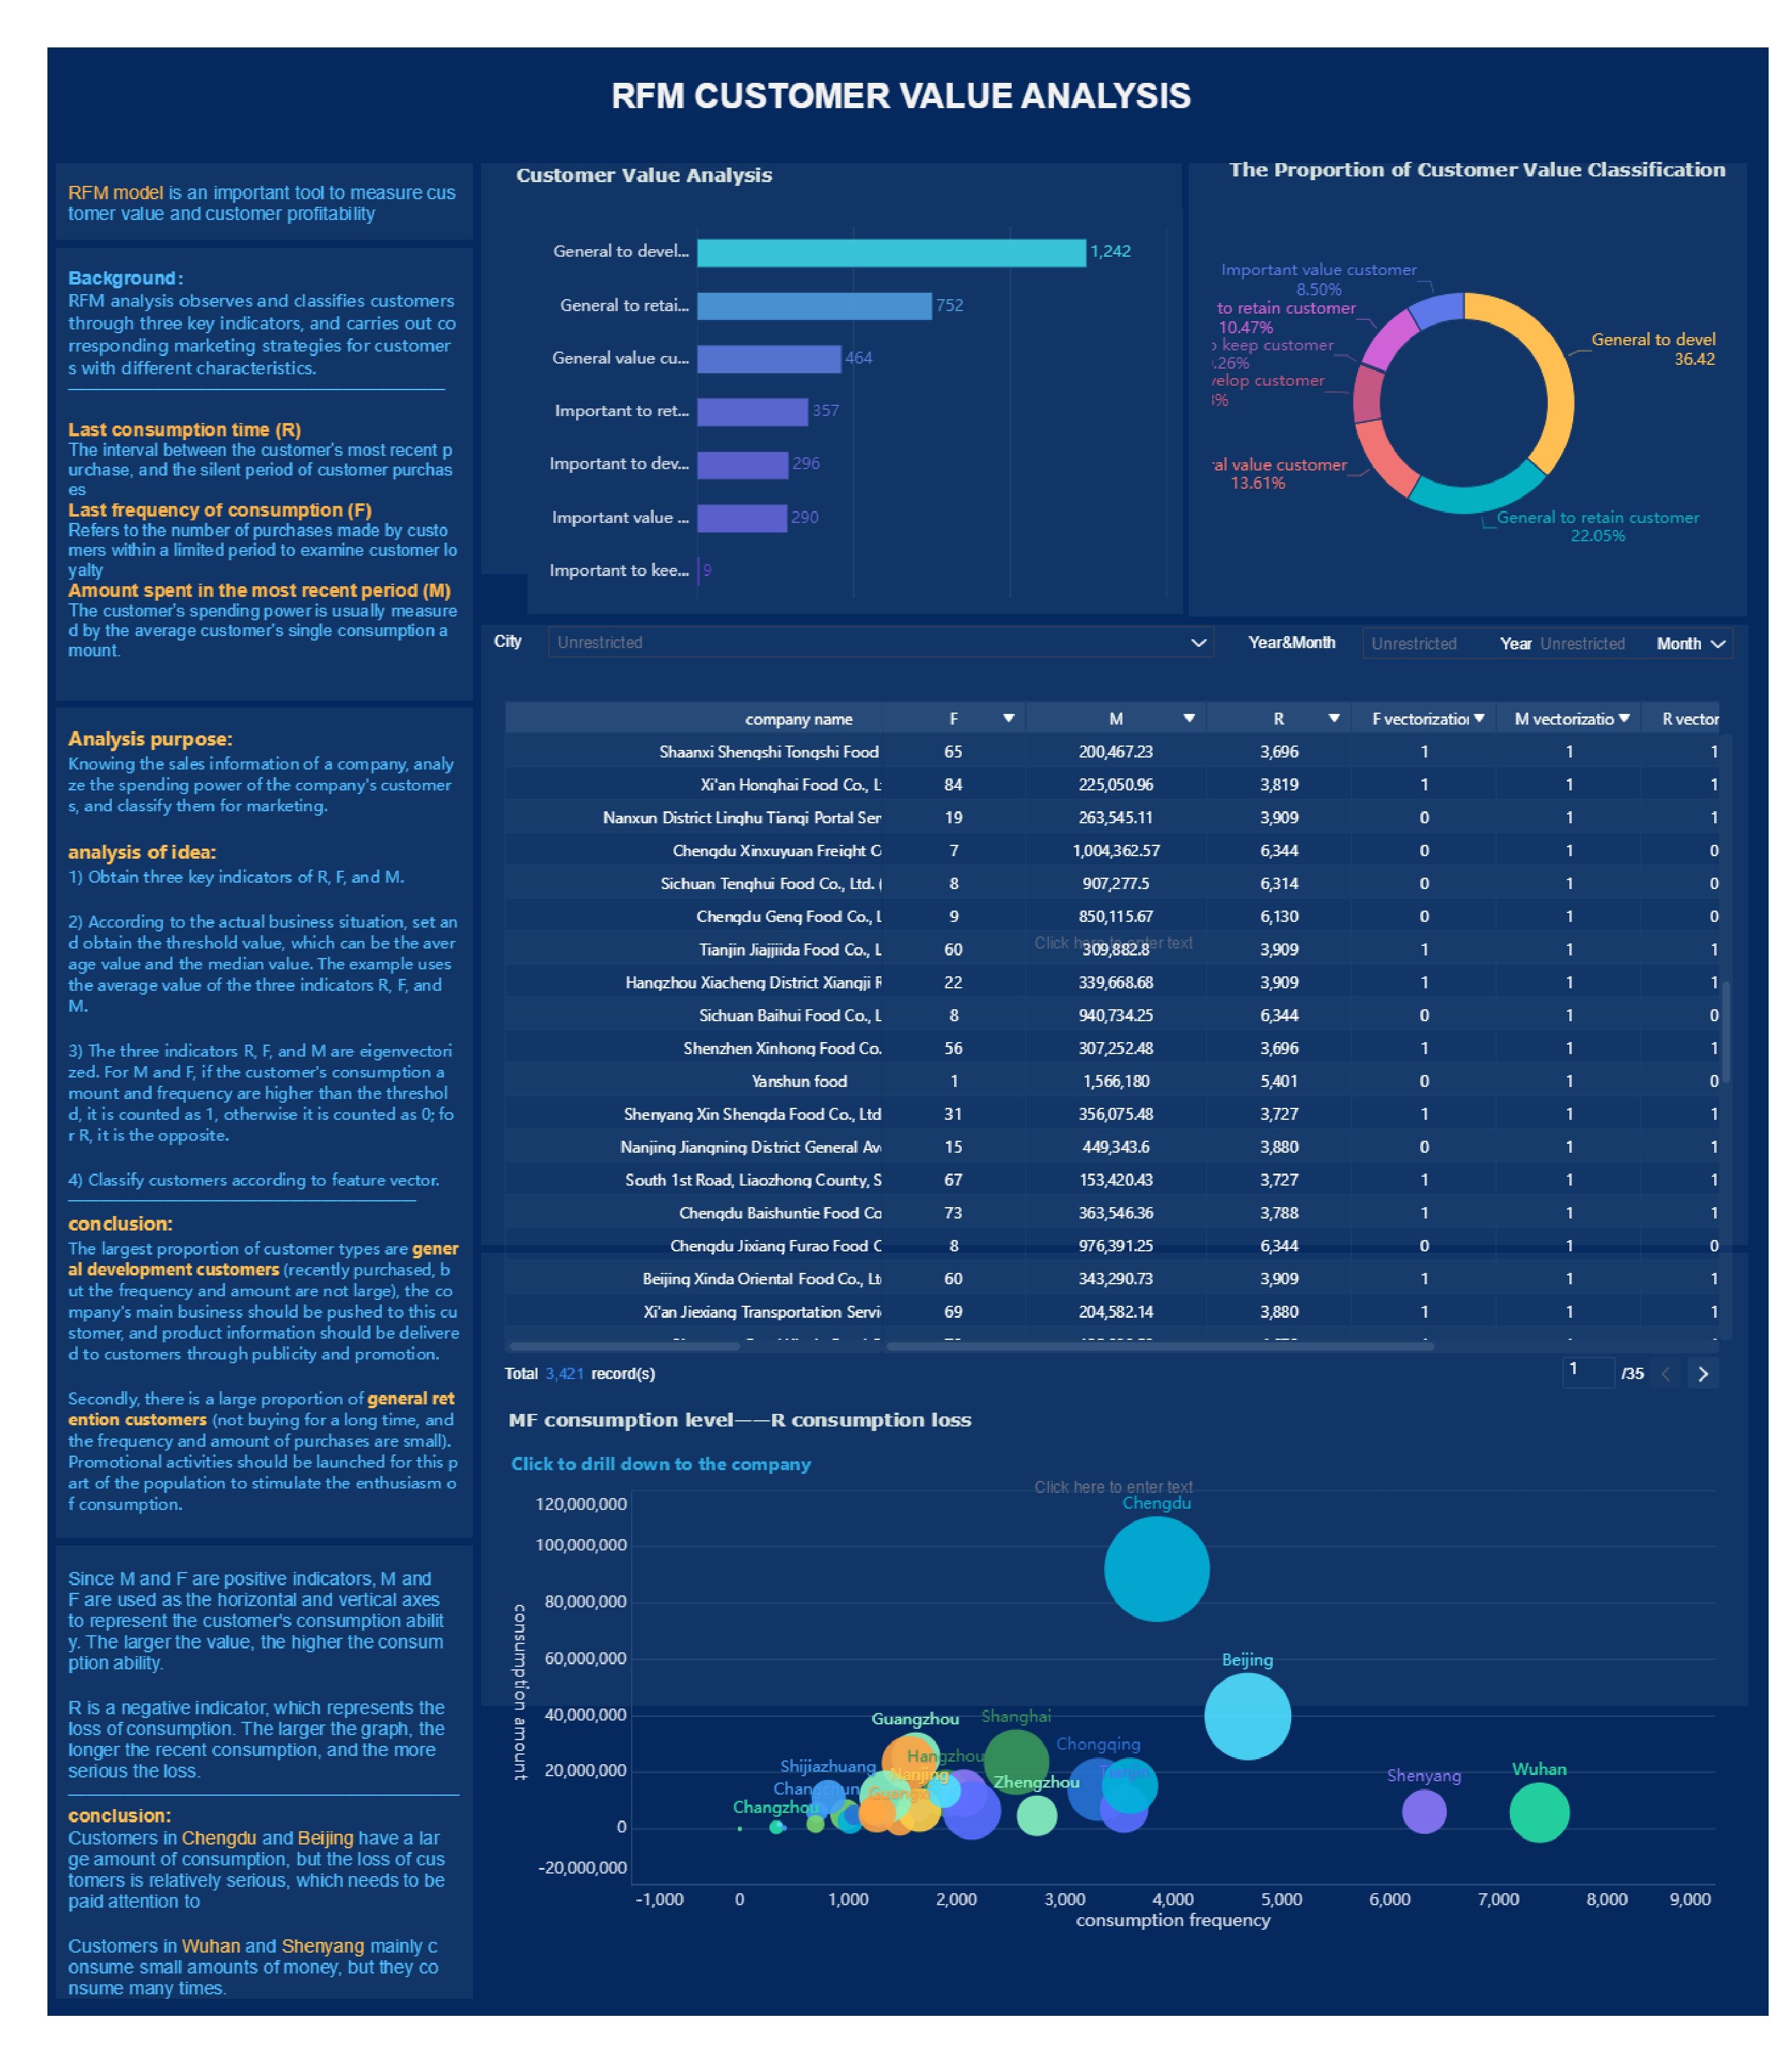
FineBI is changing the way you approach data analysis tools. You get a user-friendly interface that makes analysis simple, even if you’re not a technical expert. FineBI connects to over 100 data sources, so you can bring all your information together for unified analysis. Real-time analytics let you make decisions quickly.

FineBI’s drag-and-drop dashboards and self-service features empower you to explore data without waiting for IT support. You can create visualizations, track KPIs, and share insights across your organization. FineBI’s enterprise-grade security and governance keep your data safe while you collaborate with your team. If you want a tool that combines flexibility, speed, and ease of use, FineBI is ready for the future.
Tip: FineBI’s real-time analytics and integration capabilities make it a top choice for business users who need fast, reliable insights.
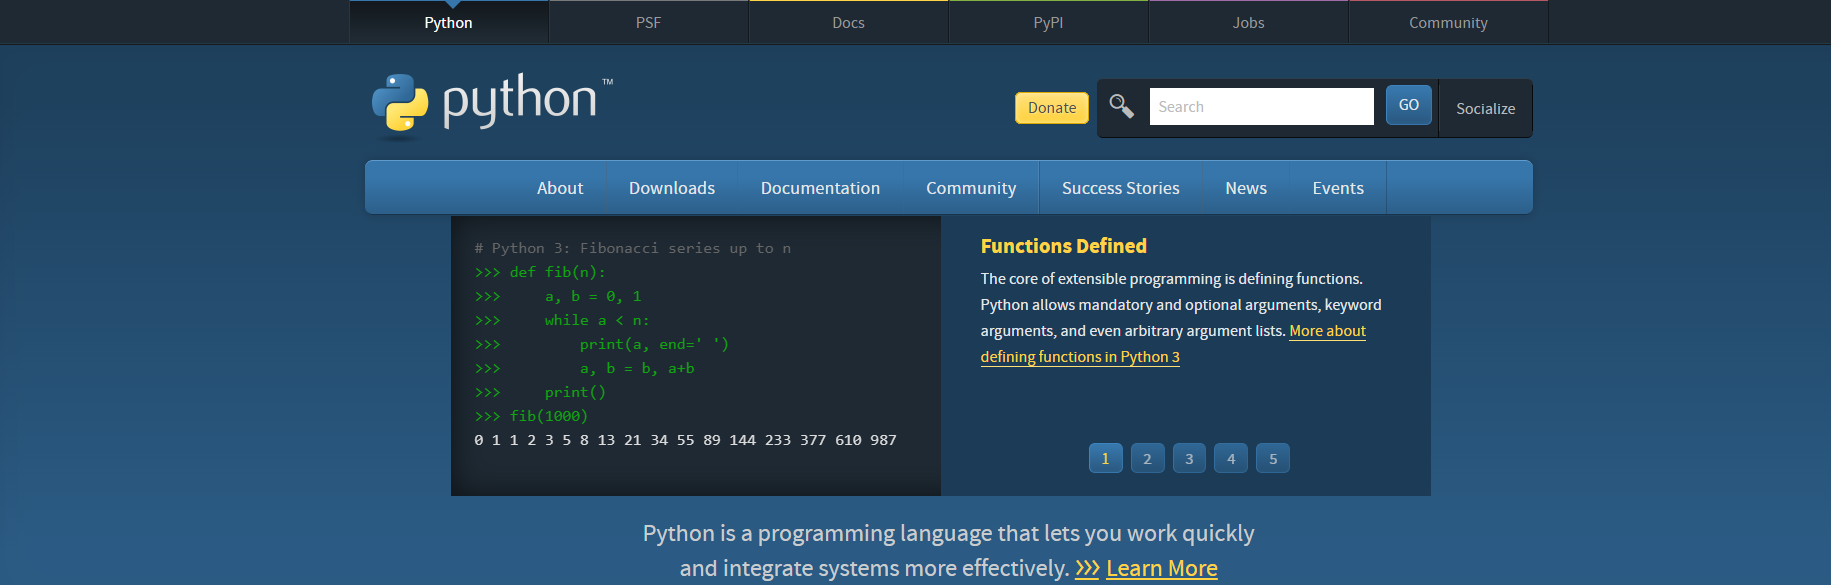
Python remains one of the best data analysis tools for both beginners and experts. You can use Python for almost any analysis task. The language is easy to read, and you find a huge ecosystem of libraries like pandas, NumPy, and Matplotlib. These libraries help you clean data, run calculations, and build visualizations. Python supports ETL processes, so you can extract and transform data quickly. You can scrape data from websites and build predictive models with machine learning. Python’s versatility makes it a favorite for big data analytics and data science tools. If you want a tool that grows with you, Python is a smart choice for the future.
Tip: Python’s open-source nature means you always find new libraries and community support. You can solve almost any data analysis problem with Python.

R is another top pick among data analysis tools, especially if you love statistics. You use R for advanced statistical modeling and data visualization. R is free and open-source, so you can access it easily for research or academic projects. Compared to Python, R focuses more on statistical analysis, while Python covers broader tasks like machine learning and automation. R’s packages make it easy to create charts and run complex models. If you want to dig deep into numbers and trends, R gives you the tools to do it. Many analysts choose R for big data analytics in healthcare, finance, and social sciences.
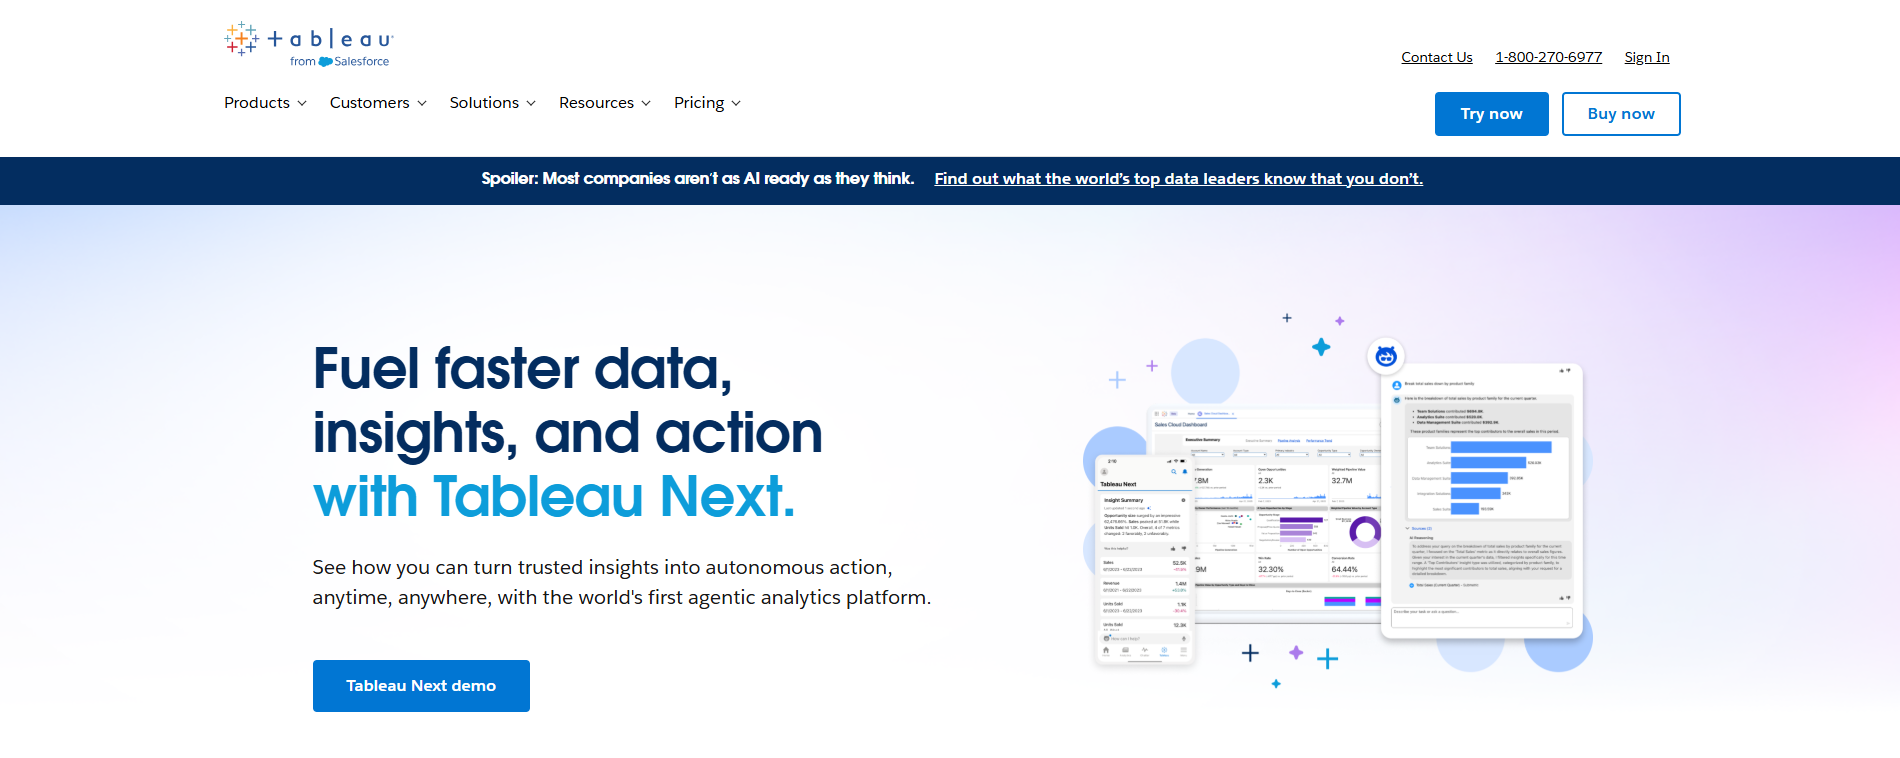
Tableau stands out as one of the best data analysis tools for visualization. You can turn raw data into interactive dashboards and reports with just a few clicks. Tableau’s drag-and-drop interface makes it easy for anyone to create charts, maps, and graphs. Tableau offers features like Google Apps integration, dynamic spatial parameters, and improved visualization suggestions with Show Me 2.0. You get flexible color ranges and accessibility enhancements, so everyone on your team can explore data. Tableau’s performance insights dashboard helps you track how your reports run in the cloud. If you want to share insights and make data analysis visual, Tableau is a top choice for the future.
Note: Tableau’s keyboard accessible interactivity lets you explore data without a mouse, making it more inclusive for all users.
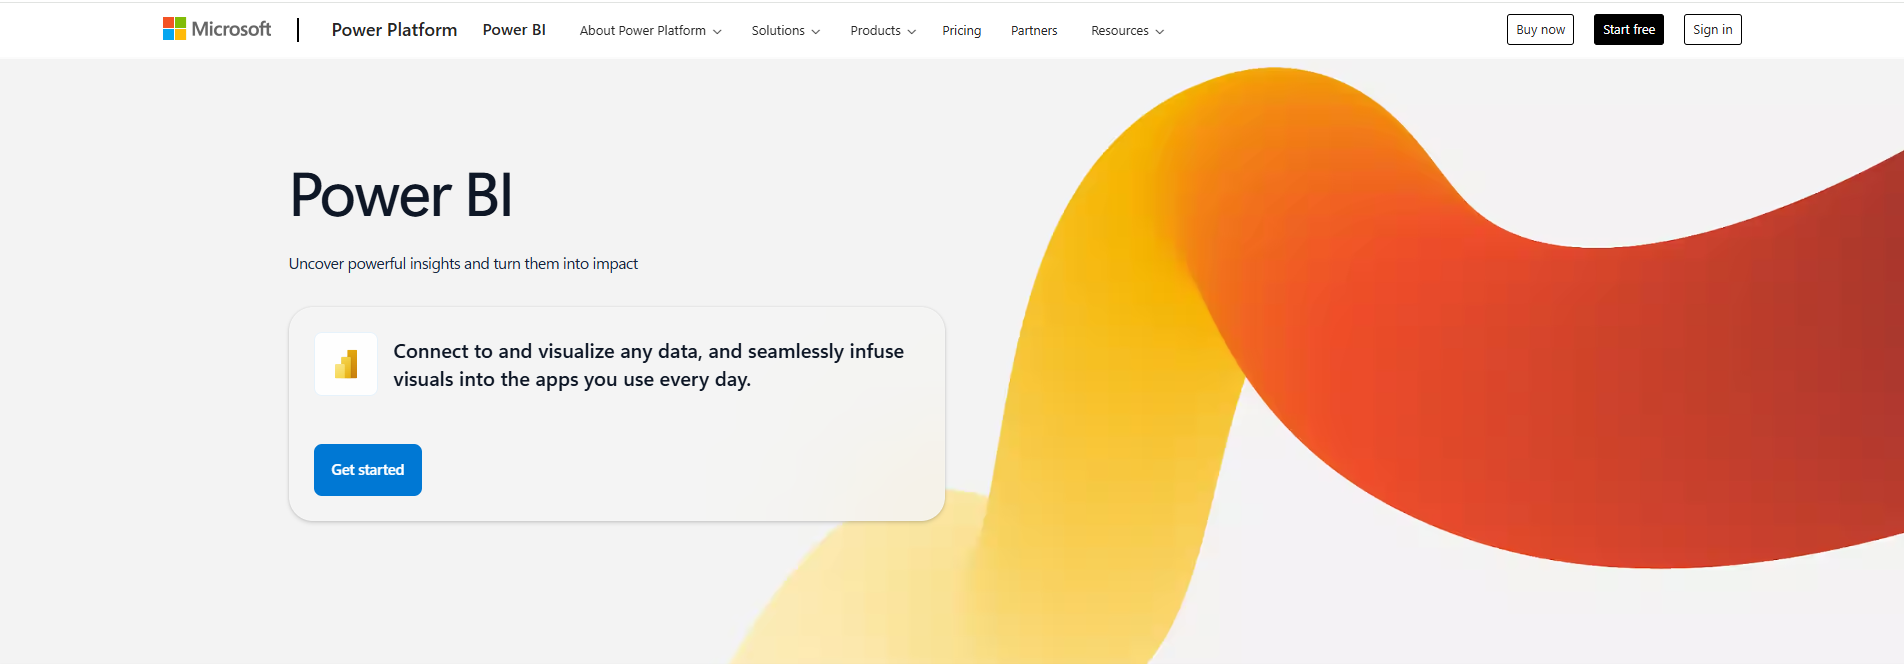
Microsoft Power BI is a leader in enterprise data analysis tools. You use Power BI to connect to many data sources and build dashboards for your business. Power BI supports large-scale analytics, so you can handle big data analytics without slowing down. Features like datamarts, no-code ETL, and integrated governance make Power BI secure and easy to use. You can set up self-tuning datasets and define relationships with the BI semantic model. Deployment pipelines help you manage reports across different environments. Power BI’s real-time analysis and reporting give you the edge in fast-moving industries.
“As our organization delves deeper into leveraging Power BI for analyzing large datasets and conducting complex analytics queries, I'm eager to understand how Power BI maintains performance and scalability in such scenarios.”
Apache Spark is a powerhouse for big data analytics. You use Spark to process massive datasets quickly, thanks to its in-memory computation and DAG execution engine. Spark handles batch, real-time, graph processing, and SQL queries in one unified platform. Compared to Hadoop’s MapReduce, Spark runs up to 100 times faster for in-memory tasks. You can analyze data from multiple sources and scale your analysis as your business grows. Spark’s speed and flexibility make it one of the best data analysis tools for companies dealing with large volumes of data.
| Feature | Apache Spark | Apache Hadoop (MapReduce) |
|---|---|---|
| Processing Style | In-memory computation, DAG engine | Batch processing, MapReduce |
| Speed | Up to 100x faster (in-memory) | Slower, disk I/O after each step |
| Data Handling | Batch, real-time, graph, SQL | Large-scale linear processing |
SAS is a trusted name in data analysis tools for enterprises. You use SAS for advanced analytics, predictive modeling, and handling complex data. SAS processes large volumes of data from different sources, ensuring high-quality analysis. You get a user-friendly interface that combines coding with a graphical UI. SAS offers a wide range of statistical techniques, including regression, clustering, and time series analysis. You can customize workflows and scale your analysis as your business grows. SAS provides robust security, with encrypted data and access controls. Many organizations rely on SAS for big data analytics and automl, especially in finance and healthcare.
| Feature | Description |
|---|---|
| Comprehensive Data Handling | Processes complex and vast volumes of data from various sources |
| Advanced Statistical Techniques | Regression, clustering, time series analysis |
| User-Friendly Interface | Combines coding with GUI |
| Customization and Scalability | Configurable workflows, scalable capabilities |
| Robust Security Measures | Encrypted data, access control |
KNIME is a flexible platform among data analysis tools, known for its data integration and automation strengths. You can connect to databases, APIs, and files, making data extraction and preparation easy. KNIME lets you design and automate workflows, saving time on repetitive analysis tasks. You can clean, aggregate, and transform data before running your analysis. KNIME’s visual interface helps you build complex workflows without coding. If you want to automate big data analytics and streamline your analysis, KNIME is a smart choice for the future.
| Strengths of KNIME in Data Integration and Automation | Description |
|---|---|
| Extensive functionality for data integration | Connects to databases, APIs, files for efficient extraction and preparation |
| Automation of workflows | Designs and executes complex workflows, automating repetitive tasks |
| Data cleaning and preparation | Supports cleaning, aggregation, transformation for seamless analysis |
Qlik is a leader in interactive data analysis tools. You use Qlik’s associative engine to explore data relationships dynamically. Qlik’s self-service analytics let you create reports and dashboards without IT help. The drag-and-drop interface makes analysis easy for everyone, no matter your data literacy level. Qlik’s collaborative features allow you to share insights and co-develop reports in real time. You can navigate multidimensional data and uncover hidden trends. Qlik is perfect for organizations that want agility and fast decision-making through big data analytics.
DataRobot brings automl and AI-driven analysis to the front of data analysis tools. You can automate machine learning tasks, from data preparation to model building. DataRobot’s built-in ML mechanisms identify and optimize data patterns for predictive modeling. The platform connects data preparation with model building through a feedback loop. DataRobot automatically selects the best machine learning model for your dataset. You can process both structured and unstructured data quickly. The user-friendly interface lets you create and deploy predictive models without technical expertise. DataRobot is used across industries like retail, finance, and healthcare for big data analytics and automl.
| Feature Type | Description |
|---|---|
| Built-in ML Mechanisms | Automates identification and optimization of data patterns for predictive modeling |
| Feedback Loop | Connects data preparation and ML model building efficiently |
| Optimized AutoML | Selects the best machine learning model for your dataset |
| Data Processing | Speeds up and enhances quality of processing for all data types |
| AI-based Data Analysis | Generates detailed reports using AI technologies |
| User-Friendly Interface | Enables easy creation and deployment of predictive models |
| Broad Application | Used in retail, finance, healthcare, and more |
Note: DataRobot’s automl features help you save time and improve accuracy in your analysis, making it a top choice for the future.
You have many options when it comes to data analysis tools. Each tool offers unique strengths for analysis, big data analytics, automl, and visualization. Whether you want to use Python for flexible analysis, Tableau for stunning dashboards, or FineBI for self-service analytics, you can find the best data analysis tools to fit your needs. The future of data analysis depends on choosing tools that help you work faster, smarter, and more collaboratively.
When you look for flexible data analysis tools, Python and R stand out. You get a huge range of libraries with both languages. Python offers pandas, NumPy, and Matplotlib for data visualization and handling. R gives you ggplot2 and dplyr for advanced statistical analysis and visualization. Python also supports TensorFlow and Scikit-learn for machine learning. R has caret and randomForest, which help with predictive modeling. These libraries make it easy for you to switch between data cleaning, analysis, and visualization. You can solve many problems with these data analytics tools, no matter your skill level.
| Language | Libraries/Packages | Strengths |
|---|---|---|
| Python | pandas, NumPy, Matplotlib | Data handling, visualization |
| R | ggplot2, dplyr | Statistical analysis, complex visualization |
| Python | TensorFlow, Scikit-learn | Machine learning, advanced analytics |
| R | caret, randomForest | Predictive modeling, data visualization |
You want data visualization tools that make your insights clear and easy to share. Tableau, Power BI, and FineBI all offer strong dashboard and visualization features. Tableau focuses on visual storytelling and freeform dashboarding. Power BI gives you structured dashboards and deep integration with Microsoft tools. FineBI lets you build interactive dashboards with drag-and-drop simplicity. You can connect to many data sources and create real-time visualizations. These data analytics tools help you turn raw data into charts, maps, and reports that everyone can understand.
| Feature | Power BI | Tableau | FineBI |
|---|---|---|---|
| Data Connectivity | Microsoft integration, Power Query | Broad connections, Tableau Prep | 100+ connectors, unified data access |
| Visualization Philosophy | Operational reporting | Visual storytelling | Self-service, interactive dashboards |
| Collaboration & Governance | Easy sharing, Microsoft ecosystem | Platform-specific sharing | Enterprise-grade security, team sharing |
| Deployment & Performance | Quick dashboard development | Flexible, high-volume data workloads | Real-time, scalable, mobile-ready |
If you need to process large volumes of data, apache spark and KNIME are top choices. Apache spark gives you high-speed processing and flexible deployment. You can run machine learning and data science tasks quickly. KNIME offers modular analytics and visual workflows. You can automate data science projects from start to finish. These data analysis tools scale with your business and handle big data without slowing down.
| Tool | Key Strengths |
|---|---|
| apache spark | High-speed processing, machine learning, flexible deployment, data visualization |
| KNIME | Modular analytics, visual workflows, end-to-end data science, visualization |
You want data analytics tools that support advanced analytics and predictive modeling. SAS and DataRobot give you powerful features for forecasting and machine learning. SAS covers principal component analysis, regression, decision trees, neural networks, and more. DataRobot automates machine learning and helps you find the best model for your data. You can use these tools for customer churn prediction, credit risk, and demand forecasting. Both tools offer collaboration and model management for enterprise use.
Tip: DataRobot’s AutoML feature saves you time by automatically selecting the best algorithms and hyperparameters for your dataset.
Self-service BI lets you explore data without waiting for IT. FineBI and Qlik make collaboration easy. FineBI offers zero-code dashboards, real-time data visualization, and enterprise-grade security. You can share insights and work with your team in one place. Qlik’s associative engine helps you explore data relationships and create interactive reports. These data analysis tools empower everyone in your organization to make data-driven decisions.
| Feature | FineBI | Qlik |
|---|---|---|
| Self-Service BI | Drag-and-drop dashboards, zero-code | Associative engine, easy report creation |
| Collaboration | Team sharing, secure publishing | Real-time sharing, teamwork |
| Data Visualization | 60+ chart types, interactive dashboards | Dynamic exploration, interactive charts |
You want your data analysis software to handle all your sources without hassle. FineBI makes this easy. You can connect to over 100 types of databases, cloud warehouses, and files. You do not need to write code. FineBI lets you create self-service datasets, filter out what you do not need, and merge tables for a complete view. You get visual tools that help you spot data issues and recommend the best ways to display your results. You can clean, transform, and standardize your data with just a few clicks. Here’s how FineBI’s workflow helps you:
| Workflow Advantage | Description |
|---|---|
| Self-service datasets | You create and manage your own datasets with filtering and merging. |
| Visual data analysis | You use intuitive tools to find data issues and get suggestions for visual effects. |
| Powerful data preprocessing capabilities | You cleanse and transform data from many sources efficiently, using a low-code approach. |
You can see how BOE, a global leader in IoT, used FineBI to bring together data from many systems. They cut inventory costs and boosted efficiency by 50%.
FineBI stands out as a data visualization software that puts you in control. You can drag and drop charts, maps, and tables to build dashboards that fit your needs. You do not need IT to help. FineBI supports over 60 chart types and lets you customize layouts for any device. You can explore your data, drill down into details, and save templates for future use. This makes data manipulation and visualization simple and fast.
You need answers now, not later. FineBI gives you real-time dashboards and reports. You see the latest numbers as soon as your data updates. You can set up real-time alerts for key metrics. If something changes, you get notified right away. You can share dashboards with your team and work together in real time. Everyone stays on the same page, whether they are in the office or on the go. FineBI’s real-time features help you make decisions faster and respond to changes as they happen.
You want your data safe. FineBI offers enterprise-grade security and governance. You control who sees what, down to the row and column. You can mask sensitive data for certain users. FineBI tracks user activity, so you know who accessed what and when. This keeps your data secure and helps you meet compliance needs. You can trust FineBI to protect your business as you grow.
FineBI helps you move from scattered spreadsheets to a unified, real-time analytics platform. You get the power to analyze, visualize, and share data—no matter your technical skill.
Choosing the right data analysis tools can feel tricky. You want something that fits your needs and helps you get results fast. Let’s break down what you should look for.
Start by thinking about your goals and your team’s skills. Do you need simple dashboards or advanced analytics? Are you working alone or with a big group? Use tools like a skill matrix or KPIs to spot gaps in your team’s abilities. You can also use benchmarking to compare your needs with others in your industry. Here’s a quick table to help you organize your thoughts:
| Criteria/Tool | Description |
|---|---|
| Balanced Scorecard | Shows overall performance from different angles. |
| Benchmarking | Compares your work with industry standards. |
| SMART Criteria | Sets clear, measurable goals. |
| KPIs | Tracks progress and highlights areas to improve. |
| Skill Matrix | Finds skill gaps and helps plan training. |
You want data analysis tools that connect easily to your existing systems. Some tools offer lots of integrations, while others have limits. Scalability matters too. If your data grows, your tool should keep up without slowing down. Look at this table to compare:
| Tool Name | Integration Capabilities | Scalability |
|---|---|---|
| Tool A | Integrates with CRM, ERP | High |
| Tool B | Limited integrations | Medium |
| Tool C | Extensive integrations | High |
A good data analytics tool should handle more data as your business expands. It should stay fast and reliable.
Think about your budget. Data analysis tools come with different pricing models. Some charge a one-time fee, others use subscriptions, and some bill you for actual usage. Here’s a table to help you compare:
| Licensing Model | Description | Advantages | Challenges |
|---|---|---|---|
| Perpetual Licensing | Pay once, use forever | Easy budgeting | High upfront cost |
| Subscription | Pay monthly or yearly | Low initial cost | Costs can add up |
| Concurrent | Pay for simultaneous users | Good for sharing | Access issues if busy |
| Usage-Based | Pay for what you use | Flexible | Hard to predict costs |
Support matters when you run into problems. Look for data analysis tools with strong user communities and good customer service. A big community means you can find answers fast. Good support helps you solve issues and learn new tricks.
Tip: Always try a demo or free trial before you decide. You’ll see if the tool matches your workflow and needs.
You want to stay ahead in the world of data analytics. The field changes fast, so you need to keep learning. Data analysis tools evolve every year. New features, new integrations, and new ways to get data insights appear all the time. If you want to make the most of your data analytics platform, you need to build your skills and adapt.
Here are some ways you can boost your data analytics skills and stay future-ready:
You can’t just learn once and stop. Data analytics requires you to keep growing. When you improve your skills, you help your team make better data-driven decisions and drive data-driven decision-making across your organization.
You don’t have to pick just one tool. Many organizations use several data analysis tools together. This approach helps you get the most out of your data analytics platform and supports strong data-driven decision-making. When you combine tools, you cover more ground and unlock deeper insights.
Here’s how using multiple data analytics tools benefits your team:
| Benefit | Description |
|---|---|
| Stronger decision-making | Leaders work with the right metrics, solving the problem of poor-quality data. |
| Faster decisions | Centralized insights help leadership teams align and act quickly. |
| Higher productivity | You spot workflow bottlenecks and improve efficiency. |
| Better innovation | Sharing insights across teams sparks new ideas and solutions. |
You can use one tool for automated machine learning, another for data visualization, and a third for big data analytics. This mix gives you flexibility and power. You get more accurate data-driven insights and support smarter data-driven decision-making.
To stay competitive, you need to keep learning and use the best mix of data analytics tools. This approach helps you adapt, innovate, and lead in a data-driven world.
Choosing the best data analysis tools helps you stay ahead. You make smarter decisions, spot hidden trends, and improve customer experiences. FineBI gives you the power to analyze and share data without barriers. When you use top data analysis tools, you see higher success rates, find new revenue, and boost productivity. Keep exploring, try new features, and invest in your learning. Staying updated with the latest trends keeps you competitive for the long run.

How to Do Retention Analysis for Business Success
What is Pareto Chart and How Does it Work
How DuPont Analysis Helps You Understand Your Business

The Author
Lewis
Senior Data Analyst at FanRuan
Related Articles
Data Analyst Dashboard: A Scenario-Based Guide to KPI Views That Drive Better Business Decisions
Learn how data analyst dashboards turn raw data into actionable KPI views for operational, analytical, and strategic decisions. Drive better business outcomes.
Lewis Chou
May 03, 2026

Self-Service Analytics Defined and Why You Need It
Self-service analytics lets you analyze data without IT help, empowering faster, data-driven decisions and boosting agility for your business.
Lewis
Jan 04, 2026

Best Self-Service Tools for Analytics You Should Know
See which self-service tools for analytics let business users access data, build dashboards, and make decisions faster—no IT help needed.
Lewis
Dec 29, 2025


