If you are searching for data reporting tools, you are probably not just looking for another dashboard builder. Most teams today need to solve several reporting jobs at once: interactive analysis for managers, structured operational reports for finance or compliance, and automated delivery for executives, clients, or frontline teams.
That is why choosing reporting software in 2026 is less about picking the most popular BI brand and more about matching the tool to the reporting workflow. Some platforms are strongest in visual exploration. Others are better for pixel-perfect paginated reports, scheduled batch delivery, or operational forms. For IT leaders, BI teams, finance managers, and reporting owners, the real question is: which tool fits the way your business actually consumes information?
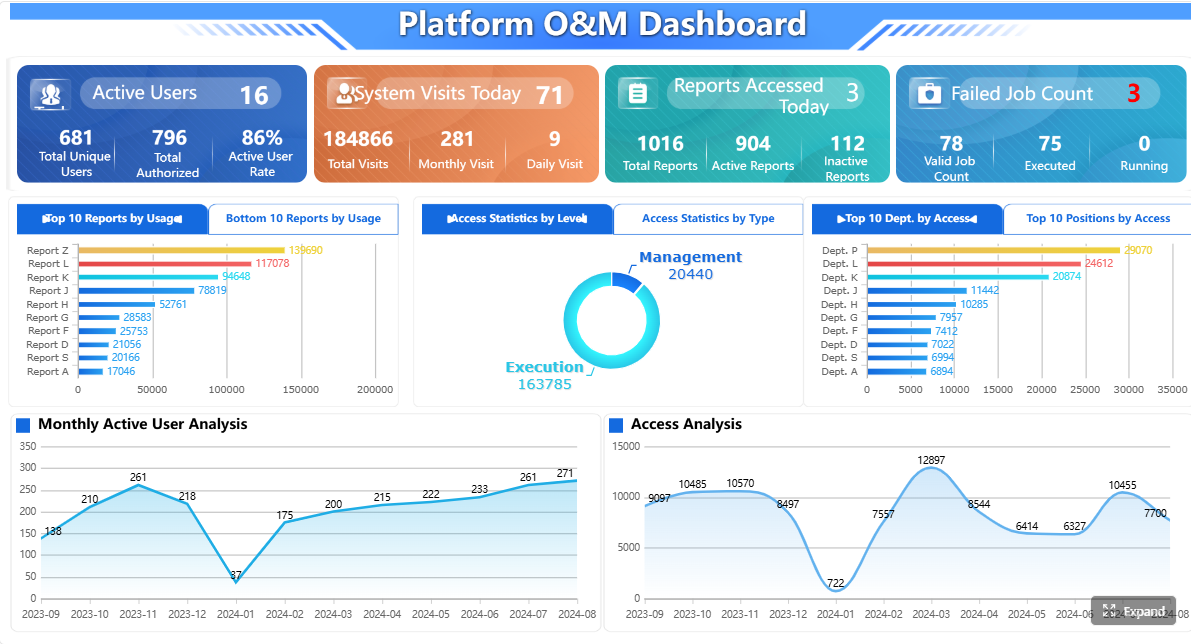 Click To Try The Dashboard
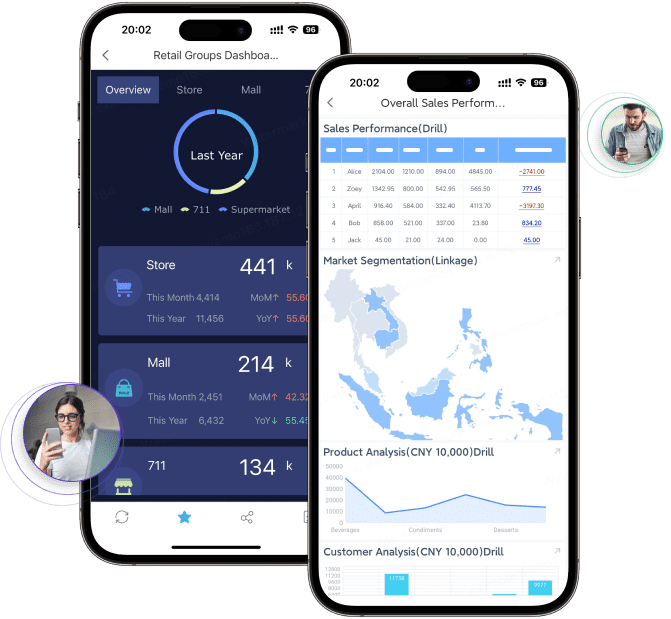
Quick Comparison Table
| Tool category | Best for | Dashboarding | Pixel-perfect reporting | Paginated reports | Automated distribution | Data entry/forms | Enterprise deployment | Recommended users |
|---|---|---|---|---|---|---|---|---|
| Enterprise BI platforms | Interactive analysis and self-service BI | Strong | Limited to moderate depending on product | Moderate in some platforms | Basic to moderate | Usually limited | Strong | Analysts, BI teams, business managers |
| Dedicated paginated reporting tools | Formal documents and operational reporting | Moderate | Strong | Strong | Strong | Often supported in some platforms | Strong | Finance, operations, IT reporting teams |
| Automated reporting and distribution platforms | Last-mile report delivery | Limited to moderate | Depends on source tool | Depends on source tool | Strong | Usually limited | Moderate to strong | BI teams, client reporting teams, exec reporting owners |
| FineReport | Enterprise reporting that combines dashboards, paginated reports, scheduling, and forms | Strong | Strong | Strong | Strong | Strong | Strong | Enterprises needing both analysis and operational reporting |
 |
What to look for in data reporting tools for 2026
Choosing among modern data reporting tools starts with clarity about the reporting work your team actually owns. Many software evaluations fail because teams compare every product on a generic feature list instead of mapping tools to real reporting tasks.
Define the reporting jobs your team needs to handle
The first step is to separate three common needs:
- Interactive BI dashboards for exploration, filtering, and drill-down
- Pixel-perfect paginated reports for formal documents, print-ready outputs, and exact layouts
- Scheduled distribution for recurring delivery to large stakeholder groups
A sales operations team may care most about dashboard speed and self-service analysis. A finance team may need highly structured monthly packs. A customer reporting team may already have dashboards but struggle with getting the right version of a report to the right recipients on time.
If you treat all of these as the same requirement, you risk buying a tool that does one job well and the others poorly.
Compare speed to insight, governance controls, usability, and total cost of ownership
For many buyers, the real comparison is not just features. It is the balance between:
- Speed to insight: How quickly can users answer business questions?
- Governance: Can you control metric definitions, permissions, and report access?
- Usability: Can business users work productively without constant technical support?
- Total cost of ownership: What will setup, licensing, training, maintenance, and administration really require?
A dashboard tool may appear cheaper at first but require more manual effort for formal reporting. A reporting platform may reduce spreadsheet work, reformatting, or repeated distribution tasks, which changes the long-term cost picture.
Check how well each platform supports self-service analysis without creating metric sprawl
Self-service is valuable, but unmanaged self-service can create duplicate KPIs, conflicting definitions, and inconsistent reporting across departments.
Good reporting tools help teams balance flexibility with control through:
- Centralized metric definitions
- Shared datasets or semantic layers
- Certified reports or governed templates
- Role-based permissions
- Reusable report components
This matters especially in larger organizations where the reporting audience spans finance, operations, sales, and executives.
Prioritize tools that fit your data stack, security model, and audience needs
The right platform should match:
- Your data sources and refresh patterns
- Your deployment preferences
- Your security and permission model
- The technical skill of report builders
- The consumption style of report readers
A dashboard used daily by analysts is different from a monthly board package or a burst report sent to hundreds of regional managers. The more varied your reporting audience, the more important it becomes to choose a platform that supports more than one output style.
How BI dashboards, paginated reports, and automated distribution differ
The phrase data reporting tools often covers very different products. Understanding the differences helps avoid poor-fit purchases.
BI dashboards for interactive analysis
BI dashboards are designed for exploration. They are best when users need to monitor KPIs, filter by region or product, drill into details, and react quickly to changing business conditions.
Typical strengths include:
- Interactive charts and visualizations
- Fast slicing and filtering
- Drill-down and drill-through analysis
- Near real-time or frequent refreshes
- Self-service analytics for business users
This makes dashboards ideal for:
- Sales pipeline monitoring
- Marketing performance tracking
- Inventory and supply chain monitoring
- Operational KPI reviews
- Department performance analysis
The trade-off is that dashboard-first tools may be less suitable when exact document formatting matters more than interaction.
Paginated reports for structured operational reporting
Paginated reports are built for consistency, precision, and print-ready output. They are usually the right choice for documents where layout is part of the requirement, not just the presentation layer.
Typical use cases include:
- Invoices and billing documents
- Financial statements
- Regulatory or compliance reports
- Board packs
- Account statements
- Production and logistics reports
- Multi-page detailed tables
These reports are most useful when teams need:
- Pixel-perfect layout control
- Predictable pagination
- Repeatable templates
- Printable or export-ready output
- Precise tables, headers, footers, and sections
This is where many pure BI tools become less comfortable. They may display data effectively but not handle strict operational formatting with the same degree of control.
Automated distribution for recurring delivery
Automated distribution solves the last mile of reporting. Even when dashboards are available, many organizations still need reports delivered on a schedule in the format stakeholders actually read.
Common distribution needs include:
- Emailing weekly executive reports
- Sending region-specific reports to managers
- Delivering client-ready PDFs
- Publishing reports to portals
- Exporting files for archival or downstream workflows
- Distributing burst reports based on recipient rules
This reduces manual effort and improves consistency. For BI teams, automated distribution is often the missing layer between analysis and action.
Top reporting software categories and leading tools to compare
There is no single winner across all reporting scenarios. The market is easier to understand when you compare tools by category.
Enterprise BI platforms
Enterprise BI platforms are built primarily for dashboards, analytics, and governed self-service. Common products in this category include Power BI, Tableau, Qlik, Looker, and Domo.
What they usually do well:
- Interactive dashboards
- Data modeling or semantic governance
- Visualization depth
- Departmental or enterprise KPI monitoring
- Broad ecosystem support
Typical trade-offs:
- Formal paginated reporting may be weaker or require add-ons
- Highly formatted exports can be limited
- Distribution workflows may be basic for complex recipient scenarios
- Administration and licensing can become complex at scale
These tools are often a strong fit when the main goal is faster decision-making through interactive analytics.
Dedicated paginated and operational reporting tools
This category focuses on highly structured reporting. It is most relevant when layout precision, printable output, report templates, and operational documents are business-critical.
Common evaluation factors include:
- Formatting control
- Export quality
- Bursting and scheduling
- Multi-page table handling
- Template management
- Parameter queries
- Operational workflows
This category is often favored by finance, compliance, manufacturing, logistics, and enterprise reporting teams.
FineReport belongs strongly in this conversation because it is designed for enterprise reporting scenarios that require both structured reports and broader reporting workflows, rather than dashboarding alone.
Automated reporting and distribution platforms
These platforms focus on report delivery rather than replacing the BI layer. They are especially relevant for teams that already use Tableau, Power BI, Looker, or another BI tool but need better scheduling, packaging, or recipient-level distribution.
Typical strengths include:
- Scheduled exports
- Distribution orchestration
- Recipient-based personalization
- Presentation or document automation
- Delivery to email, files, or collaboration tools
Their value is highest when the dashboard already exists, but the organization still depends on manual report preparation every week or month.
10 BI reporting tools and automated reporting options worth shortlisting
Below is a practical shortlist of data reporting tools and adjacent platforms worth comparing in 2026. These tools do not all solve the same problem, so shortlist them based on your reporting use case.
Best-fit tools for governed enterprise decisions
These tools are generally strong when organizations need centralized metrics, permissioning, governed reporting, and broad departmental rollout.
1. Microsoft Power BI
 Power BI is widely adopted for dashboarding and self-service BI, especially in Microsoft-centric environments. It is often chosen for its ecosystem fit, data connectivity, and accessibility for business reporting teams.
Best fit:
- Microsoft-heavy organizations
- Governed BI rollouts
- KPI monitoring and dashboard sharing
Watch for:
- Formal reporting needs may require separate design considerations
- Complex distribution workflows may need extra tooling or process work
2. Tableau
 Tableau remains a strong option for visual exploration and analytical dashboarding. It is often favored by data teams that prioritize rich visual analysis and interactive storytelling.
Best fit:
- Data exploration
- Analytical dashboards
- Users who need strong visual drill-down
Watch for:
- Highly formatted operational reports may not be its primary strength
- Scheduled delivery is useful, but some organizations still need more robust last-mile reporting workflows
3. Looker
 Looker is often considered by organizations that value governed metrics and centralized data definitions. It can be a good fit for teams that want a semantic approach to BI.
Best fit:
- Metric governance
- Shared definitions across teams
- Scalable analytics programs
Watch for:
- Report formatting needs should be evaluated carefully
- Adoption may depend on internal technical capability
4. Qlik
 Qlik is frequently evaluated for associative analysis and enterprise BI use cases. It can be suitable for teams that need flexible data exploration with governance.
Best fit:
- Enterprise analytics
- Cross-filtering and associative exploration
- Department-wide BI initiatives
Watch for:
- The reporting experience should be tested against your operational document needs
Best-fit tools for speed and self-service
These tools are often preferred when analyst productivity and rapid iteration matter more than formal document control.
5. Looker Studio
 Looker Studio is often used for lightweight dashboards and reporting in Google-centric environments. It can be useful for fast, accessible reporting projects.
Best fit:
- Lightweight dashboarding
- Marketing and web reporting
- Google ecosystem users
Watch for:
- Less suitable for high-control enterprise operational reporting
6. Metabase
 Metabase is commonly shortlisted by teams that want quick setup and a relatively approachable BI experience. It is often attractive for internal analytics use cases.
Best fit:
- Internal analytics teams
- Fast deployment
- Lightweight self-service reporting
Watch for:
- Enterprise-scale governance and formal report delivery needs should be evaluated carefully
7. Domo
 Domo is often positioned as a broad platform for data integration, dashboards, and business visibility. It can appeal to organizations looking for an all-in-one approach.
Best fit:
- Broad business reporting initiatives
- Organizations looking for a unified BI environment
Watch for:
- Cost, administration, and fit with an existing data stack should be assessed early
Best-fit tools for distribution-heavy BI teams
These tools are most relevant when report delivery is a bigger challenge than dashboard creation.
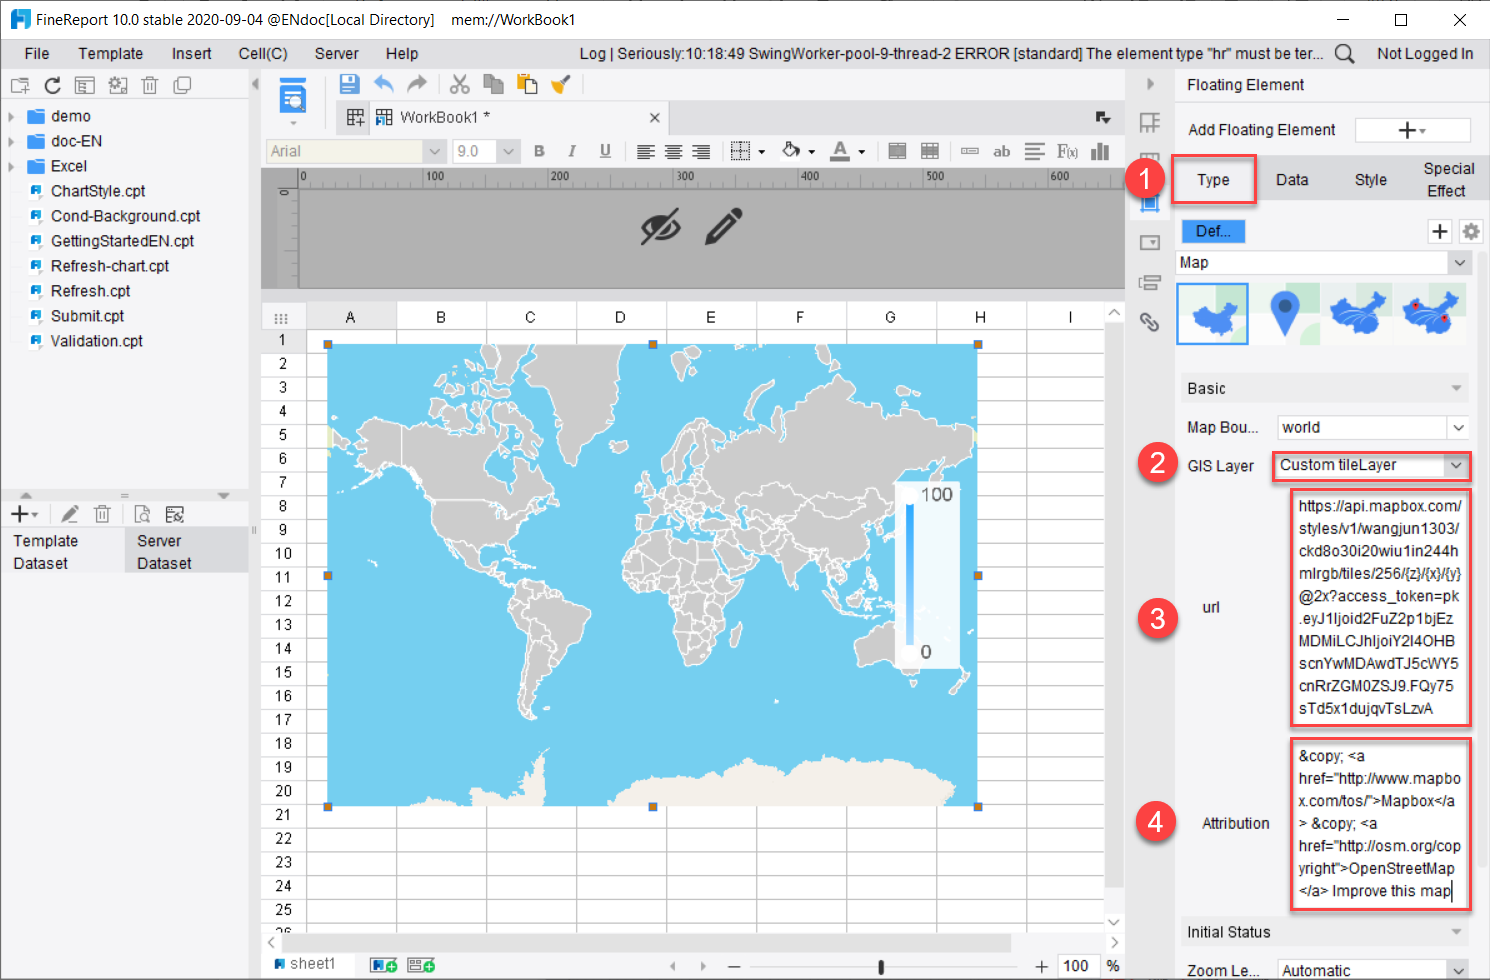
8. FineReport
 FineReport is well suited for organizations that need more than dashboards. It supports pixel-perfect reports, paginated layouts, dashboards, parameter queries, scheduled tasks, automated distribution, and data entry forms. That makes it especially relevant for operational reporting and enterprise reporting workflows.
Best fit:
- Finance and management reporting
- Operational reporting
- Print-ready and paginated outputs
- Dashboard plus formal report scenarios
- Teams that need scheduled delivery and report governance
Watch for:
- Best evaluated through a real proof of concept using your report templates and distribution needs
9. SSRS
 SQL Server Reporting Services remains relevant in some Microsoft-based reporting environments, especially where paginated reporting and structured delivery are priorities.
Best fit:
- SQL Server-centric reporting stacks
- Structured and recurring reports
- Operational reporting
Watch for:
- User experience and modern dashboard expectations may vary depending on use case and implementation approach
10. Distribution-focused reporting automation platforms
Tools in this category can work alongside existing BI software to automate exports, scheduled presentations, or recurring stakeholder updates.
Best fit:
- BI teams with an established dashboard layer
- Executive, board, client, or recurring presentation workflows
- Teams trying to reduce manual last-mile reporting effort
Watch for:
- These tools may not replace your core BI or paginated reporting platform
How to choose the right reporting tool for your team
Shortlisting data reporting tools is easier when you evaluate by use case, not by vendor popularity.
Match the tool to the reporting use case
A simple rule works well:
- Choose dashboard-first tools for exploratory analysis
- Choose paginated reporting tools for formal, structured documents
- Choose distribution tools for recurring multi-recipient delivery
If your organization needs all three, you may need a platform that spans multiple reporting styles or a reporting stack with complementary tools.
Compare features, pros, cons, and implementation effort
When comparing options, go beyond feature checklists. Score each tool on practical fit:
- Visualization depth
- Formatting precision
- Scheduling and automation
- Governance and permissions
- Integration fit
- Ease of adoption
- Administration overhead
- Migration effort
A product can look strong in demos but still create friction if report authors need heavy technical support or if business users cannot maintain it.
Build a practical evaluation checklist
The best evaluation method is a proof of concept using real business reporting requirements.
Include:
- Real source data
- Real users
- Real approval workflows
- Real delivery deadlines
- Real export requirements
Then score each tool on:
- Usability
- Reliability
- Scalability
- Governance
- Delivery capability
- Long-term fit

Final recommendations by use case and team maturity
Different teams should reach different conclusions.
Choose a BI-first platform if your main goal is interactive analysis and faster decisions
If your users primarily need visual exploration, KPI dashboards, and self-service analysis, an enterprise BI platform is often the right starting point. Tools like Power BI, Tableau, Looker, and Qlik are commonly considered here.
Choose a paginated reporting solution if formal layouts, print-ready outputs, or compliance reporting are core requirements
If your reporting success depends on exact layout, repeatable document design, or detailed operational tables, a dedicated reporting platform will usually serve you better than a dashboard-first tool alone.
Choose an automated distribution layer if your team already has dashboards but needs reliable, governed delivery at scale
If the main pain point is recurring report packaging and delivery, focus on automation, bursting, scheduling, and recipient-level control rather than replacing your existing BI tool unnecessarily.
Create a shortlist based on audience, governance needs, and the balance between flexibility and control
The best 2026 reporting stack is the one that aligns with how different stakeholders consume information, not the one with the broadest marketing claims.
Practical recommendations for selecting data reporting tools
Here are five practical steps that experienced reporting teams use to make better software decisions:
-
Separate analysis from delivery requirements early.
Do not assume the same tool will excel equally at dashboards, board packs, invoices, and burst distribution. -
Test one high-stakes report in the evaluation.
Use a monthly finance pack, operational summary, or executive review template to see whether the platform handles real complexity. -
Check governance before rollout.
Metric definitions, permissions, and template control become more important as reporting adoption grows. -
Evaluate the full reporting workflow, not just design.
Build, refresh, review, distribute, archive, and secure the report end to end. -
Choose for the audience, not the analyst.
A report consumer may need a printable statement, a scheduled PDF, or a portal-based view, even if the analyst prefers dashboards.
When FineReport is a strong fit for enterprise reporting
Tools like Tableau and Power BI are widely used for visualization and BI analysis, but teams with complex reporting workflows may also need a dedicated enterprise reporting platform like FineReport.
FineReport is especially relevant when organizations need to combine:
- Dashboards for KPI monitoring
- Pixel-perfect report design
- Paginated and printable reports
- Parameter queries for business users
- Scheduled tasks and automated distribution
- Data entry forms and reporting workflows
- Enterprise-level reporting governance
This makes it a practical option for finance, manufacturing, logistics, operations, management reporting, and other environments where dashboards alone are not enough.
In other words, if your team needs both interactive visibility and formal business reporting, FineReport may cover a broader range of reporting jobs in one platform than a dashboard-only approach.

Get Ready-to-Use Dashboard and Report Templates in Fine Gallery
Conclusion
The best data reporting tools for 2026 are not all trying to do the same job. Some are built for interactive BI dashboards. Some are built for highly formatted paginated reports. Others focus on automated distribution and last-mile delivery.
A smarter buying approach is to define your reporting jobs first, then choose the tool or combination of tools that fits them best. If your reporting environment includes dashboards, formal reports, scheduled delivery, and operational workflows, FineReport is worth including on your shortlist.
FAQs
Most reporting tools fall into three groups: BI dashboard platforms for interactive analysis, paginated reporting tools for formal documents, and automated distribution tools for scheduled delivery. Some platforms, such as FineReport, combine these capabilities in one system.
BI dashboards are built for filtering, drill-down, and ongoing analysis, while paginated reports are designed for fixed layouts, print-ready formatting, and repeatable business documents. The right choice depends on how people need to consume the information.
Focus on your reporting workflow, not just feature lists. Key factors include dashboarding needs, pixel-perfect layout support, scheduling, governance, integrations, security, and total cost of ownership.
Automated distribution is useful when reports must be sent regularly to executives, clients, regional teams, or other large audiences without manual effort. It helps reduce repetitive work and ensures stakeholders receive the right report on time.
Yes, some enterprise reporting platforms are built to support multiple output styles in one environment. FineReport is an example of a tool that combines dashboards, paginated reports, automated delivery, and forms for operational reporting.


The Author
Yida Yin
FanRuan Industry Solutions Expert
Related Articles

Regulatory Reporting Software Comparison: 8 Factors Enterprises Should Evaluate Beyond Compliance Checklists
If you are comparing $1 software , you are probably not just looking for a tool that helps you submit filings on time. You are trying to reduce reporting risk, improve audit readiness, handle growing reporting complexity
Yida Yin
Jun 29, 2026

HR Reporting for Executives: Build a Monthly Workforce Dashboard for Headcount, Turnover, and Hiring
HR reporting becomes truly valuable when it gives executives a reliable monthly view of workforce health, hiring progress, and retention risk in one place. Leaders do not need scattered updates from HR, recruiting, finan
Yida Yin
Jun 28, 2026

Automated Expense Reporting: How Finance Managers Build Policy-Driven Monthly Spend Reports with FineReport + Dora
Finance managers do not need more raw expense data. They need a reliable monthly reporting process that turns receipts, card transactions, reimbursement requests, and approval records into policy driven spend reports tha
Yida Yin
Jun 28, 2026