Management reporting is the internal reporting process enterprises use to turn financial and operational data into decisions. For CFOs, finance directors, operations leaders, and business unit heads, its value is simple: it helps leaders understand what changed, why it changed, what risks are emerging, and what actions must happen next. Without strong management reporting, monthly reviews become slow, reactive, and overly dependent on spreadsheets, disconnected teams, and hindsight.
Click To Try The Dashboard
All reports in this article are built with FineReport
Management reporting is the structured creation of internal reports that help leaders monitor business performance and make better operational and strategic decisions. Unlike statutory reports designed for regulators or external stakeholders, management reporting is built for internal use. It can be tailored by business unit, product line, region, team, or executive audience.
For enterprise leaders, the main benefit of management reporting is performance visibility. It shows whether revenue, cost, margin, service delivery, productivity, and cash are moving in the right direction. More importantly, it explains the drivers behind those movements so leaders can intervene early rather than react after results have already deteriorated.
This matters because most leadership teams do not struggle with a lack of data. They struggle with fragmented data, inconsistent definitions, delayed reporting cycles, and monthly packs that describe performance without guiding decisions. Good management reporting fixes that by creating a repeatable process for surfacing signals, clarifying accountability, and connecting metrics to actions.
Management reporting is used by multiple stakeholder groups across the enterprise:
Executives and board-facing leaders use it to review overall performance, strategic risks, and required decisions.
Finance leaders and FP&A teams use it to explain variance, update forecasts, and align business performance with financial outcomes.
Operations directors use it to monitor service levels, productivity, utilization, throughput, and cost drivers.
Business unit managers use it to understand results at a more granular level and manage teams against plan.
Functional leaders in sales, HR, supply chain, and customer service use it to track the drivers that influence enterprise performance.
Key Metrics (KPIs) in management reporting
A strong management reporting framework usually includes a balanced set of financial and operational KPIs. The exact mix depends on the business model, but these are the core metrics most monthly packs should consider:
Revenue: Total income generated in the reporting period; shows growth, decline, and mix shifts.
Gross Margin: Revenue minus direct costs; indicates pricing power and delivery efficiency.
EBITDA or Operating Profit: Core profitability before certain non-operating items; useful for performance tracking.
Cash Flow: Cash generated or consumed; critical for liquidity and decision-making.
Budget vs. Actual Variance: Difference between planned and actual performance; highlights execution gaps.
Forecast vs. Actual: Compares expected outcomes with delivered results; improves planning accuracy.
Utilization Rate: Measures productive use of labor or assets; especially important in services and operations.
Productivity: Output per employee, machine, or hour; links resources to results.
Pipeline or Demand Indicators: Show future revenue potential and commercial momentum.
Service Level or OTIF: Tracks fulfillment and service performance; reveals customer impact.
Customer Churn or Retention: Indicates stability of the customer base and revenue risk.
Action Status: Tracks progress against prior commitments; ensures accountability.
How management reporting works in practice
Management reporting works best when it is treated as a disciplined operating process, not just a monthly document. The report itself is only the output. The real system includes data collection, metric governance, analysis, commentary, review, and decision-making.
The reporting cycle from data collection to decision-making
In practice, the management reporting cycle starts with data extraction from source systems such as ERP, CRM, HRIS, production platforms, project systems, and budgeting tools. Finance and analytics teams then validate the data, reconcile key figures, and calculate the agreed metrics.
The next stage is analysis. This is where the reporting team moves from numbers to narrative. Variances are investigated. Trends are compared against budget, forecast, prior period, and prior year. Material changes are grouped into themes such as pricing, volume, mix, labor efficiency, overhead inflation, customer behavior, or delivery delays.
Then the monthly pack is assembled. The best packs do not just stack charts and tables. They organize information into a clear decision flow:
Finance and FP&A own reporting standards, consolidation, variance analysis, and forecast updates.
Operations teams provide context on throughput, service levels, efficiency, capacity, and delivery risks.
Department leaders explain local performance and commit to corrective actions.
Executive sponsors review the pack, challenge assumptions, and make decisions on priorities, spending, hiring, or interventions.
The final stage is the review meeting. This is where management reporting delivers value. If the monthly pack is clear, timely, and trusted, the meeting can focus on action rather than debating whose numbers are correct.
How management reporting differs from financial reporting
Financial reporting is formal, standardized, and often compliance-driven. It is designed for external stakeholders such as regulators, lenders, investors, and auditors. Its emphasis is accuracy, consistency, and adherence to accounting rules.
Management reporting is internal, flexible, and decision-oriented. It is built around the questions leaders need answered now. It can be segmented by business unit, product, customer, region, or operational workflow. It can also include non-financial KPIs, commentary, risk flags, and forward-looking views.
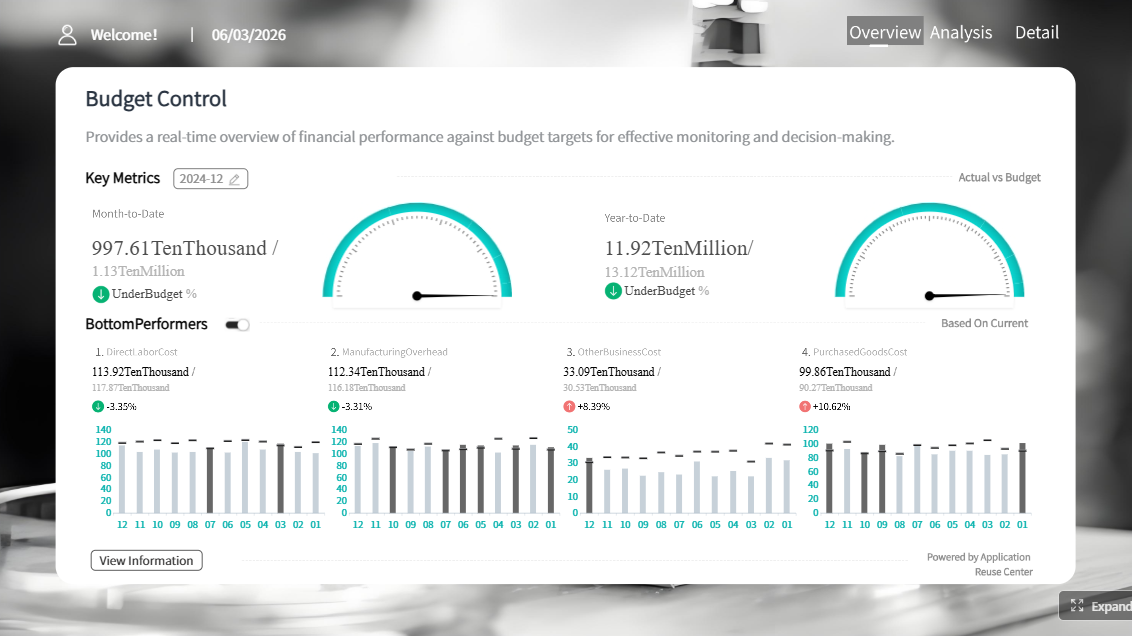
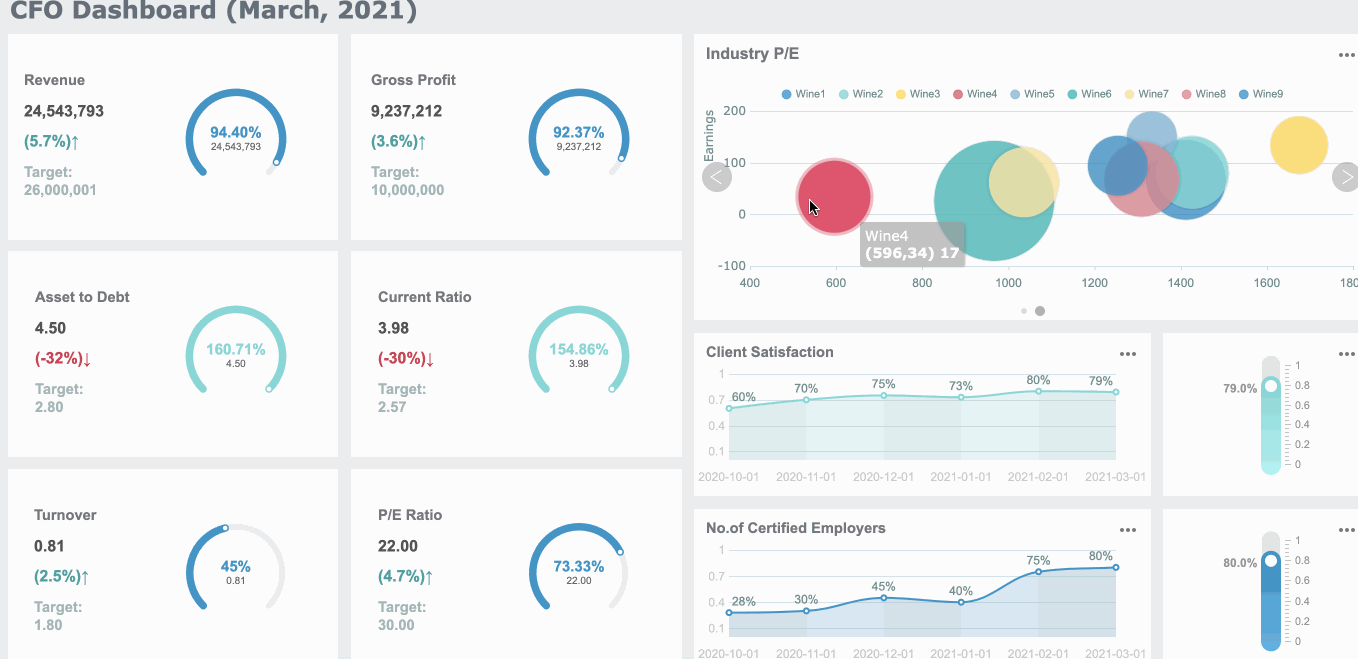
Most enterprises anchor management reporting around a monthly management pack. This is the standard executive review document, combining headline financials, operational KPIs, risks, forecasts, and action updates.
Other common formats include:
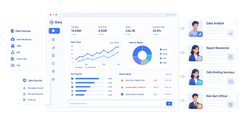
Interactive dashboards: Useful for real-time or near-real-time monitoring and drill-down analysis.
Board summaries: Condensed versions of the monthly pack focused on strategy, risk, and major movements.
Functional reports: Sales, supply chain, HR, IT, and service operations reports tailored to departmental priorities.
Exception reports: Highlight only material variances, threshold breaches, or unresolved risks.
Monthly reporting remains the core cadence because it aligns well with financial close, planning cycles, and executive operating rhythms. But high-performing organizations often complement it with:
Weekly views for sales, operations, cash, service levels, or project delivery
Quarterly reviews for strategy refresh, resource allocation, and longer-range forecasting
What every monthly management reporting pack should include
A monthly management reporting pack should help leadership understand business health in minutes, not hours. The right structure keeps the report concise while still surfacing what matters most.
Executive summary and headline insights
The first page should not be a wall of numbers. It should answer the leadership team’s top questions immediately.
An effective executive summary includes:
The most important movements in the month
What is ahead of plan and what is below plan
Emerging risks and opportunities
Decisions required from leadership
Actions already underway
Escalations that need attention
This section should be brief, sharp, and interpretive. If leaders only read one page, they should still understand the core story of the month.
This is the backbone of most management reporting packs. It should show not just whether the business hit the numbers, but what caused performance to move.
A strong financial section typically includes:
Revenue by total and key segment
Direct cost and gross margin
Operating expense trends
EBITDA or operating profit
Cash flow and liquidity view
Budget vs. actual
Forecast vs. actual
Prior month and prior year comparisons
The most useful packs add concise commentary beside each major variance. For example, instead of saying margin is down 2.4 points, explain that the decline came from unfavorable product mix, overtime costs, and delayed pricing adjustments in one region. Leaders need business context, not just arithmetic.
Operational KPIs and business drivers
Financial outcomes are usually the result of operational behavior. That is why management reporting should connect money to drivers.
Relevant operational KPIs vary by industry, but common examples include:
Sales volume or order intake
Pipeline coverage and conversion
Production output and yield
Utilization and capacity
On-time delivery and service levels
Backlog and lead times
Labor productivity
Customer satisfaction or complaint rates
The rule here is practical: include metrics leaders can act on quickly. If a KPI does not influence a decision, it probably does not belong in the core monthly pack.
For example:
If revenue is down, show whether the issue is volume, price, conversion, churn, or delivery capacity.
If costs are up, show whether labor inefficiency, supplier inflation, scrap, rework, or low utilization is driving the result.
If service levels slipped, connect it to staffing, backlog, downtime, or demand spikes.
Risks, forecasts, and action tracking
A monthly pack should never end with last month’s numbers alone. Leaders need to know what is likely to happen next and what is being done about it.
This section should include:
Updated forecast for the next month, quarter, or year-end
Assumptions behind the forecast
Key risks that may affect delivery
Scenario considerations where uncertainty is material
Mitigation plans with accountable owners
Progress against actions agreed in the prior review
This is one of the most overlooked parts of management reporting. Many organizations document performance but fail to maintain a visible action log. That weakens accountability and turns reporting into a passive exercise. Strong management reporting makes follow-through visible.
Best practices for more useful and impactful reporting
Improving management reporting is less about adding more data and more about improving relevance, consistency, and usability.
Keep reports decision-oriented, not data-heavy
The biggest reporting mistake is confusing comprehensiveness with usefulness. Executives do not need every available metric. They need the few metrics that explain business performance and support decisions.
Best practice is to design each section around a leadership question, such as:
Are we on track?
Where are we off plan?
What is causing the variance?
What action is recommended?
Use the same definitions every month so decision-makers can compare performance over time without reinterpreting the numbers.
Improve clarity through structure and visualization
A good management reporting pack is easy to scan. It uses a stable layout, clear headings, short commentary, and charts that highlight trends and outliers quickly.
Use:
Consistent section order each month
One message per chart where possible
Simple visuals such as line charts, bar charts, waterfalls, and variance bridges
Color sparingly to flag exceptions, not decorate pages
Short written commentary focused on implications and action
Build trust with governance and data quality controls
Management reporting only works when leaders trust the numbers. That requires governance, not just analytics.
Put these controls in place:
Define each KPI and calculation logic clearly
Assign an owner to every critical metric
Use review checkpoints before publication
Maintain version control for the monthly pack
Standardize source systems and transformation rules where possible
Automate recurring data preparation to reduce manual error
4 practical implementation steps from a consulting perspective
Begin with decisions, not templates
Identify the top recurring decisions leadership must make each month. Build the pack around those questions first.
Limit the core monthly pack to material metrics
Keep the main report focused. Push detailed diagnostics into appendices or drill-down dashboards.
Create one performance narrative across finance and operations
Align revenue, margin, cash, service, productivity, and forecast views so leaders see one coherent story, not disconnected scorecards.
Automate repeatable data flows early
Manual data collection delays reporting and introduces credibility risk. Prioritize automation for recurring extracts, reconciliations, and refreshes.
Review report usefulness every quarter
Remove pages nobody uses. Add views only when they support a real decision or recurring risk.
How to strengthen your management reporting process over time
Management reporting should evolve with the business. As strategy changes, market conditions shift, and data capabilities improve, the reporting process should become sharper and more predictive.
Start by asking leadership what decisions the monthly pack must support. Then review the pack regularly and remove low-value content. Most organizations carry legacy pages long after they stop helping anyone.
Next, align financial and operational measures into a shared performance narrative. Revenue should connect to volume, pricing, conversion, and retention. Margin should connect to labor, mix, procurement, and productivity. Cash should connect to collections, payables, inventory, and capital spend. That alignment is what turns reporting into management.
Finally, improve the process with feedback, automation, and better forecasting. Build workflows that shorten preparation time, improve drill-down access, and make variance explanations easier to standardize. The goal is not just faster reporting. It is more actionable reporting.
Build smarter management reporting with FineReport
Building this manually is complex; use FineReport to utilize ready-made templates and automate this entire workflow.
FineReport helps enterprises centralize data from multiple systems, standardize KPI definitions, automate recurring report generation, and deliver both dashboard-based and pack-style management reporting. Instead of spending each month extracting, reconciling, formatting, and distributing files by hand, teams can focus on analysis, narrative, and action.
This is especially valuable when you need to:
Consolidate data from ERP, CRM, HR, and operational systems
Build monthly management packs with consistent layouts
Track budget vs. actual and forecast movements automatically
Create role-based dashboards for executives and department leaders
Improve speed, accuracy, and trust in reporting outputs
Get Ready-to-Use Dashboard Templates in Fine Gallery
If your current management reporting process still depends on disconnected spreadsheets, manual commentary collection, and time-consuming deck assembly, this is the right point to modernize. The strongest reporting teams are not the ones producing the biggest packs. They are the ones delivering the clearest performance story, fastest.
Management reporting is the internal process of turning financial and operational data into insights leaders can use to make decisions. It helps management understand performance, explain changes, and decide what actions to take next.
Management reporting is designed for internal decision-making and can be tailored by team, product, or region. Financial reporting is more standardized, mainly supports external stakeholders, and focuses on compliance and historical results.
A strong monthly pack usually includes key KPIs, budget versus actuals, forecast updates, trend analysis, major risks, and action owners. The goal is not just to show numbers, but to explain what changed, why it matters, and what happens next.
The most useful KPIs depend on the business, but common ones include revenue, gross margin, operating expense, cash flow, budget variance, forecast accuracy, utilization, productivity, and customer retention. The best reports combine financial and operational measures so leaders see both outcomes and drivers.
Companies usually improve management reporting by centralizing data, standardizing metric definitions, reducing manual spreadsheet work, and tailoring reports to each audience. Clear commentary, faster reporting cycles, and stronger action tracking also make reports more useful.
Product Trial
FineReport
Pixel-perfect reports · Interactive dashboards · Easy data entry · Digital twins