BI tools for small business help you turn your data into clear insights without needing a technical background. When you use these tools, you can track your sales, spot trends, and see what drives your business forward. Here are the top 10 BI tools for small business owners:
These tools make a real difference. They help you make smarter decisions, save time by automating manual tasks, and reveal trends about your customers and market. Take a look at how BI tools impact your business:
| Impact Area | Description |
|---|---|
| Improved Decision-Making | Enables data-driven decisions, helping avoid costly mistakes and allocate resources effectively. |
| Increased Efficiency | Automates manual tasks, saving time and money that you can use for other priorities. |
| Greater Insights | Provides actionable insights into customers and market trends, enhancing strategies. |
No need to worry if you are not a data expert. These tools are designed for everyone.
Choosing the right BI tools for small business can feel overwhelming. You want something easy to use, affordable, and powerful enough to help you make smart decisions. Let’s break down the top bi tools available, so you can find the best fit for your needs.
Here’s a quick look at the criteria used to select the top bi tools for small business:
| Criteria | Description |
|---|---|
| Ease of Use | A user-friendly interface for both technical and non-technical users. |
| Data Integration | Ability to connect with various data sources for seamless access. |
| Visualization Features | Strong reporting and visualization capabilities for meaningful insights. |
| Scalability | Capability to handle increasing data volumes and business demands. |
| Collaboration Tools | Features for real-time sharing of reports and insights among teams. |
| Security & Compliance | Robust measures to protect sensitive business data. |
| Pricing & Licensing | Evaluation of cost structure, including subscription fees and additional costs for scaling. |
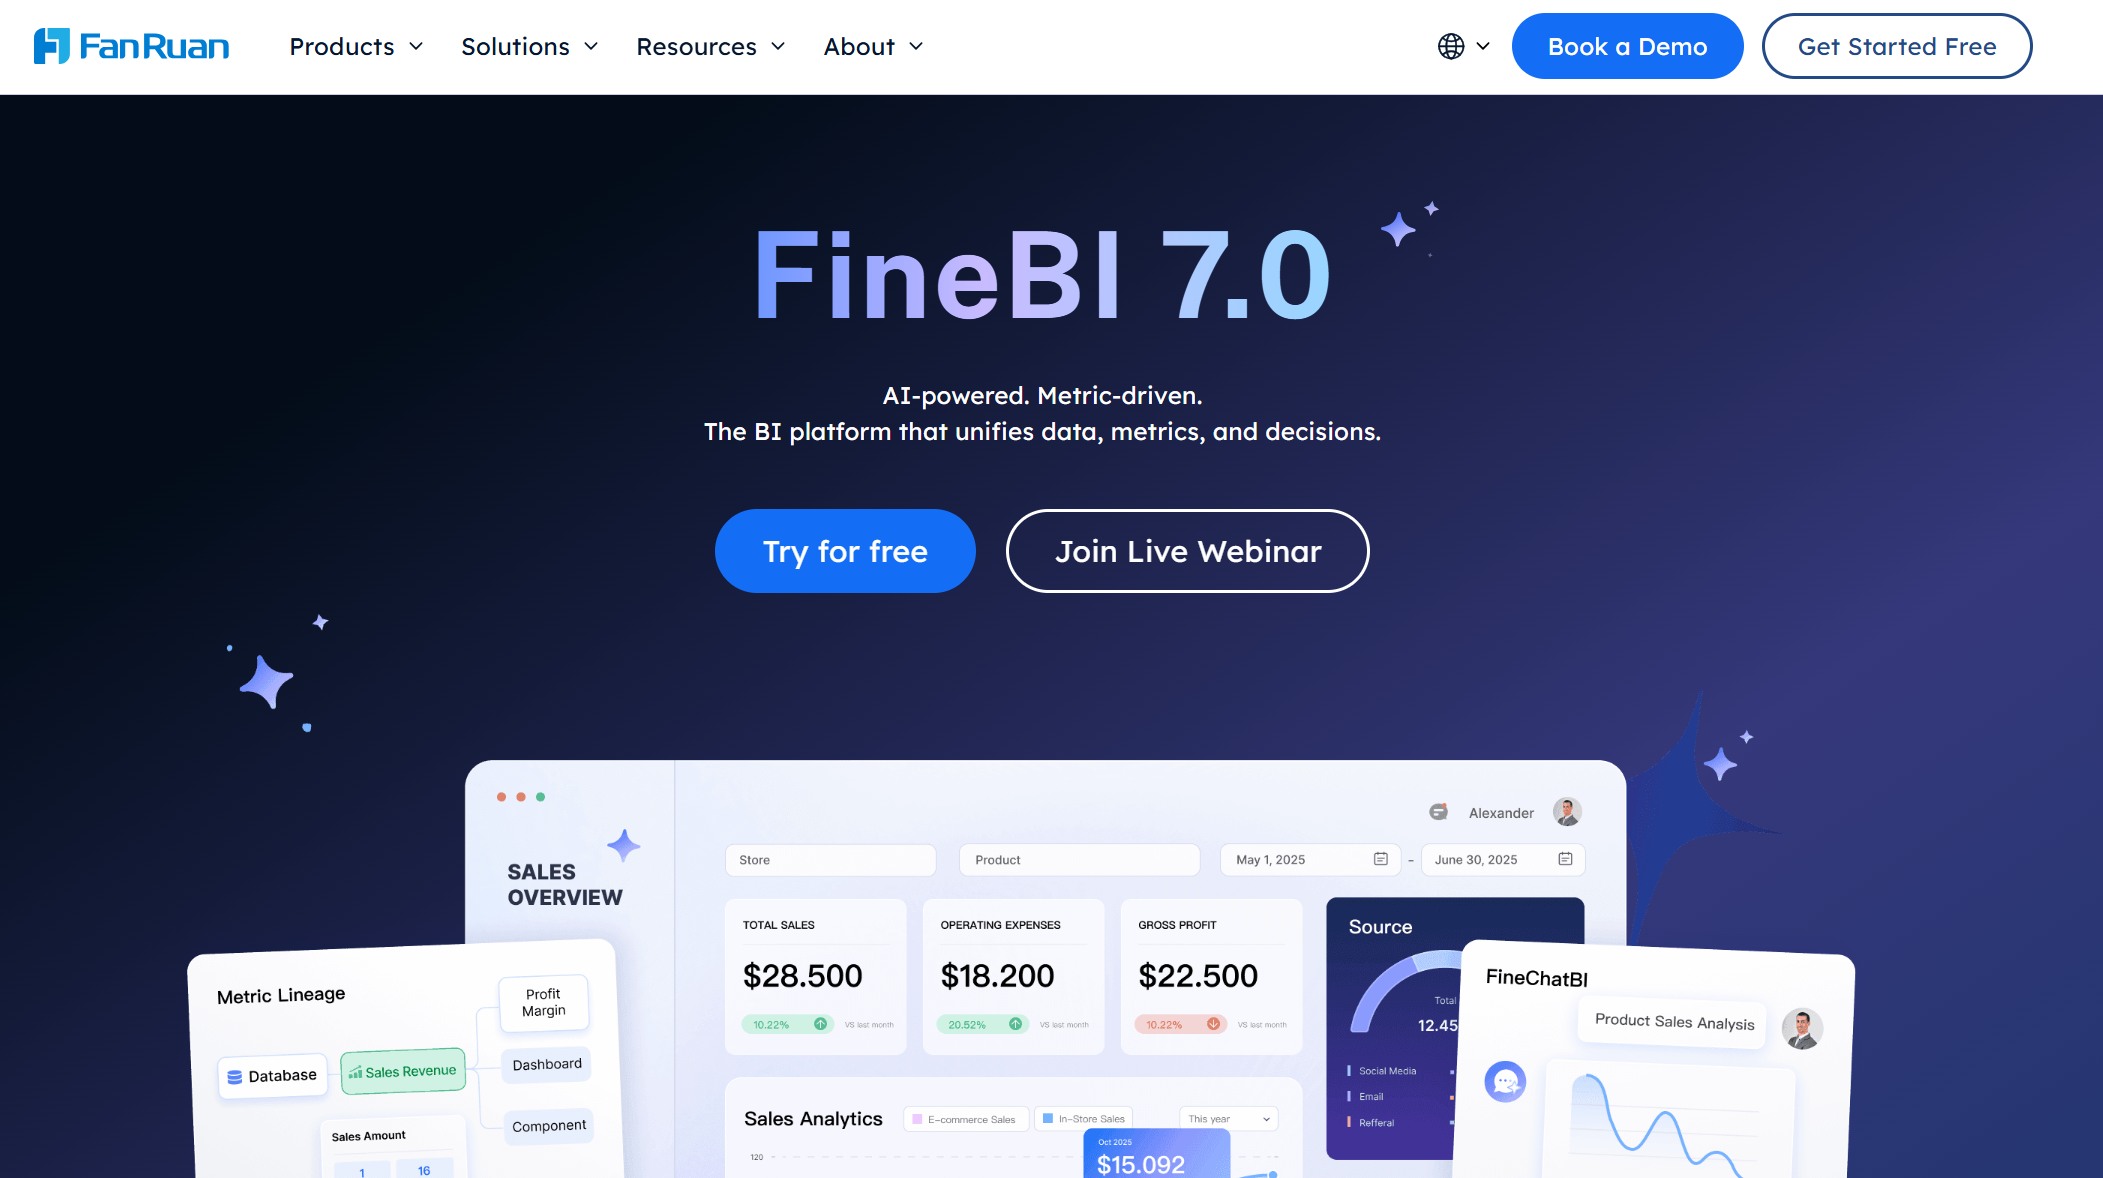
Website: https://www.fanruan.com/en/finebi
FineBI stands out among the top bi tools for small business. You get a self-service analytics platform that lets you explore your data without needing IT support. The drag-and-drop interface makes it easy for anyone to build dashboards and reports. You can connect FineBI to many data sources, including databases, cloud platforms, and even Excel files. Real-time analysis means you always see the latest numbers, helping you react quickly to changes.
Here’s what makes FineBI unique:

FineBI is ideal for small businesses that want to empower their teams to make data-driven decisions. You don’t need technical skills to get started, and you can scale up as your business grows.
Pros:
Cons:
Best for: Small businesses looking for a flexible, user-friendly BI solution that supports self-service analytics and real-time insights.
Microsoft Power BI is one of the most popular business intelligence tools for small businesses. You can create interactive reports and dashboards with a familiar interface. Power BI connects to many data sources, including Excel, cloud services, and databases.

Website: https://www.microsoft.com/en-us/power-platform/products/power-bi
| Advantages | Disadvantages |
|---|---|
| User-friendly | Bulky user interface |
| Affordable | Limited data handling capacity |
| Interactive content | Restricted customization of visuals |
| Frequent updates | |
| Ability to connect to multiple data sources |
You’ll find Power BI easy to learn, especially if you already use Microsoft products. The free edition works well for small teams with basic reporting needs. You can update reports regularly and share them with your team.
Best for: Small businesses that want an affordable, easy-to-use BI tool with strong integration to Microsoft products.
Tableau is another top bi tool for small business. You can build interactive dashboards and visualize complex data with drag-and-drop simplicity. Tableau connects to many data sources and offers advanced analytics features.

Website: https://www.tableau.com/
| Key Features | Benefits for Small Businesses |
|---|---|
| Interactive and shareable dashboards | Enables collaboration and real-time insights |
| Powerful data visualizations | Enhances understanding of complex data |
| Integration with numerous data sources | Allows for comprehensive data analysis |
| Drag-and-drop functionality | User-friendly for non-technical users |
| AI-driven insights | Provides advanced analytics capabilities |
Small businesses use Tableau to track sales, monitor compliance, and optimize marketing investments. You can collaborate with your team and share insights easily.
Pros:
Cons:
Best for: Small businesses that need powerful data visualization and advanced analytics.
Zoho Analytics offers a robust set of features for small businesses. You can connect to over 500 applications and create custom dashboards with a drag-and-drop interface.

Website: https://www.zoho.com/analytics/
| Feature | Description |
|---|---|
| Abundant Connectivity | Over 500 native connectors with popular applications, facilitating data integration. |
| Drag-and-Drop Interface | Enables users to create reports and dashboards easily without coding. |
| Customizable Dashboards | Transforms metrics into visualizations and allows for automatic report generation. |
| Interactive Filters | Users can segment data and drill down into dashboards for deeper insights. |
| Collaboration and Sharing | Secure sharing of reports with detailed access control for internal and external users. |
You get advanced forecasting and anomaly detection modules, plus affordable pricing plans. Pre-built reports and automated insights help you make decisions faster.
Pros:
Cons:
Best for: Small businesses that want affordable, customizable dashboards and automated insights.
Google Data Studio is a free tool that helps small businesses visualize and share data. You can connect it to Google products like Analytics and Sheets, and create custom reports.
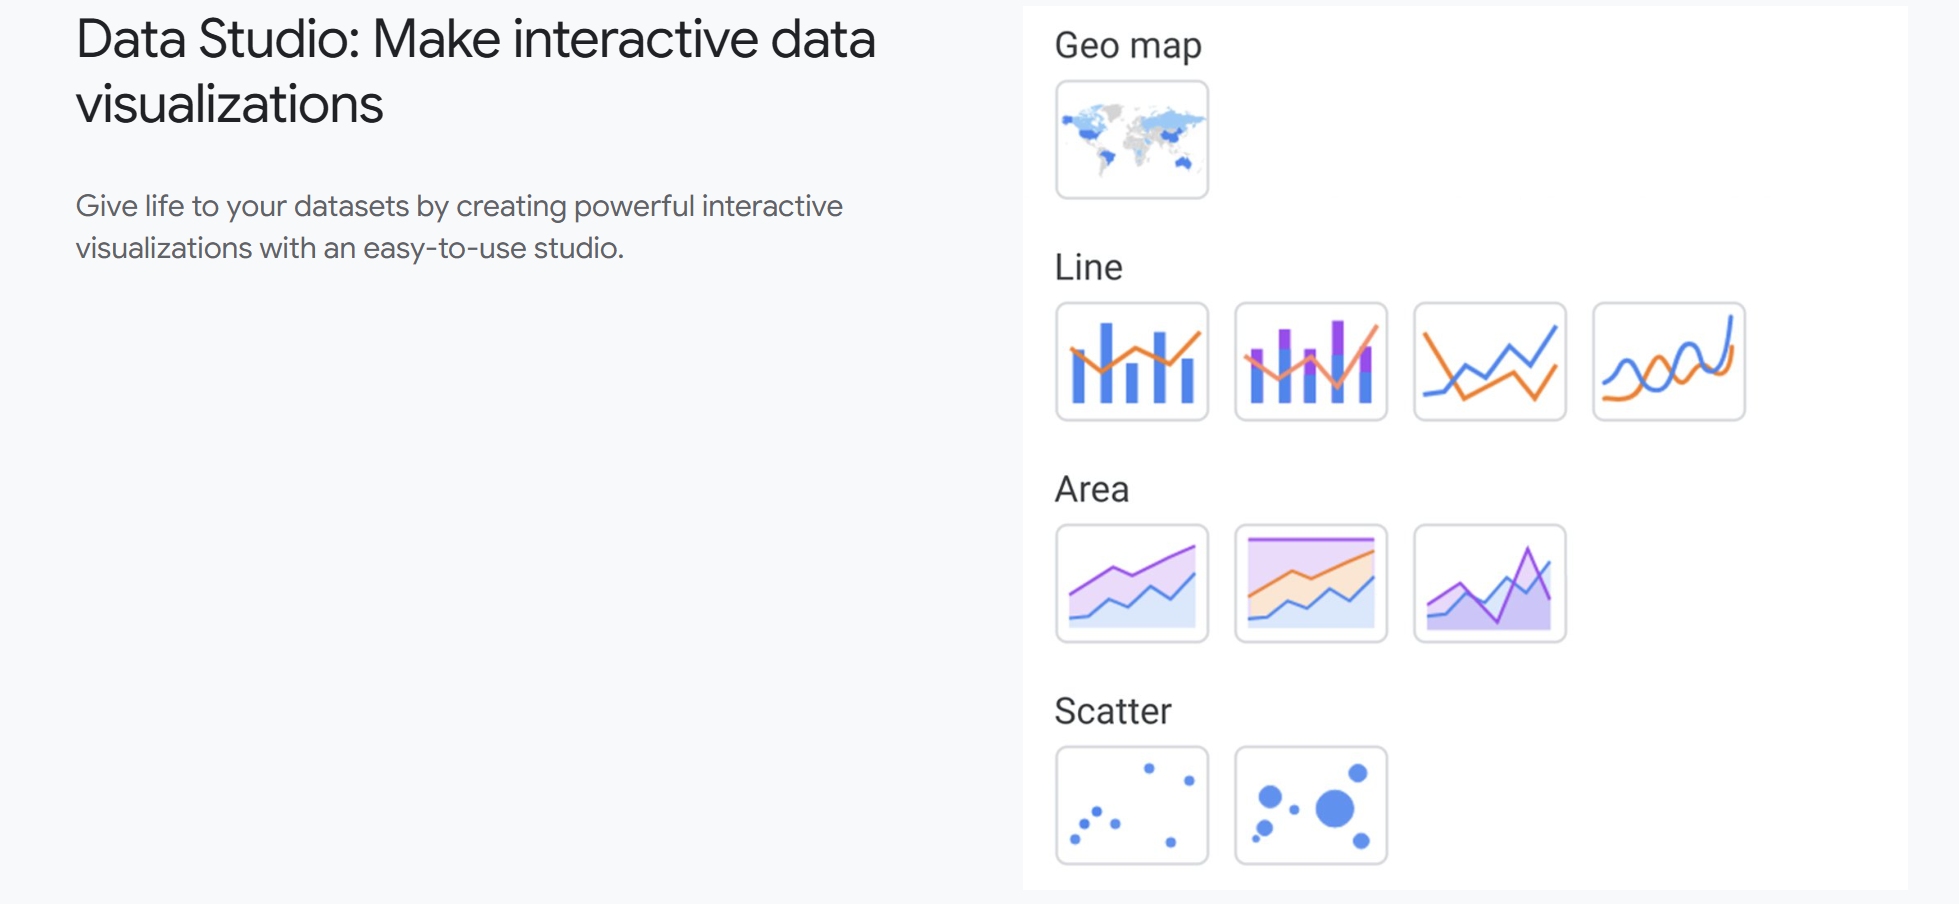
However, you may face a steep learning curve when creating reports. Integration with non-Google data sources can be challenging.
Pros:
Cons:
Best for: Small businesses that rely on Google products and want a cost-effective solution for data visualization.
Qlik Sense democratizes data analytics for small businesses. You can create dashboards and reports independently, using a drag-and-drop interface and AI-driven insights.

Website: https://www.qlik.com/us/products/qlik-sense
Qlik Sense is great for teams that want to explore data together and build analytical narratives.
Pros:
Cons:
Best for: Small businesses that value team collaboration and self-service analytics.
Looker Studio offers powerful analytics and data visualization for small businesses. You can manage costs with an affordable pricing model and scale up as your business grows.

Website: https://lookerstudio.google.com/
Looker Studio is ideal if you want to focus on the metrics that matter most and work with the latest data.
Pros:
Cons:
Best for: Small businesses that need scalable analytics and collaborative reporting.
Sisense is designed to scale with your organization, but it’s primarily tailored for mid- to large-scale deployments. You can centralize your data and create advanced analytics, but the platform may be complex for small teams.

Website: https://www.sisense.com/
Sisense operates on a tiered, quote-based pricing model. Cloud deployments tend to cost more than self-hosted versions, and advanced features may come at a premium. You’ll need a solid technical foundation and ongoing support, which may not be feasible for small businesses with limited resources.
Pros:
Cons:
Best for: Small businesses with dedicated IT resources and plans for rapid growth.
Domo helps small businesses integrate data from many sources. You can use thousands of pre-built connectors or build custom ones for proprietary systems.
Website: https://www.domo.com/
| Feature | Description |
|---|---|
| Pre-built connectors | Bring in popular data sources in minutes. |
| Custom connectors | Build connectors for proprietary and on-premise solutions. |
| Centralized data | Centralize data for better decision-making and operational efficiency. |
Domo makes it easy to centralize your data and create dashboards for better decision-making.
Pros:
Cons:
Best for: Small businesses that need quick integration and centralized data analytics.
Helical Insight is an open-source BI tool for small businesses. You can customize it to fit your needs and create interactive dashboards. The platform supports integration with various data sources and offers flexible reporting options.
Website: https://www.helicalinsight.com/
Pros:
Cons:
Best for: Small businesses with technical skills that want a customizable, open-source BI solution.
Tip: When you choose among the top bi tools, consider your team’s technical skills, budget, and the types of data you need to analyze. The right tool will help you unlock the full potential of your data analytics and drive your business forward.
When you hear about BI tools for small business, you might wonder what they actually do. These tools help you turn raw data into useful information. You can use them to track sales, monitor inventory, and understand customer behavior. The main goal is to make your data easy to understand and use for decision-making.
Here’s how leading industry sources define business intelligence tools:
| Source | Definition |
|---|---|
| LexisNexis | Tools and strategies for turning data into business insights. |
| Infor | A set of technologies and practices used to collect, analyze, and present business data to support decision-making. |
| SAP | The processes and tools used to analyze business data, turn it into actionable insights, and help everyone in an organization make better-informed decisions. |
You don’t need to be a data expert to use these tools. Most top bi tools offer user-friendly dashboards and reports. You can see trends, spot problems, and share insights with your team.
Business intelligence tools bring several advantages to small businesses. You get more than just charts and numbers. You gain the ability to predict trends, automate routine tasks, and personalize your customer experience.
These benefits make data analytics accessible and valuable for every small business owner.
BI tools for small business give you the power to make smarter choices. You can see what’s working and what needs attention. With clear dashboards, you can track performance and adjust your strategy quickly. You don’t have to guess anymore. Instead, you use facts and trends to guide your decisions.
Top bi tools help you share insights across your team. Everyone stays on the same page. You can react faster to changes in the market. This leads to better results and steady growth.
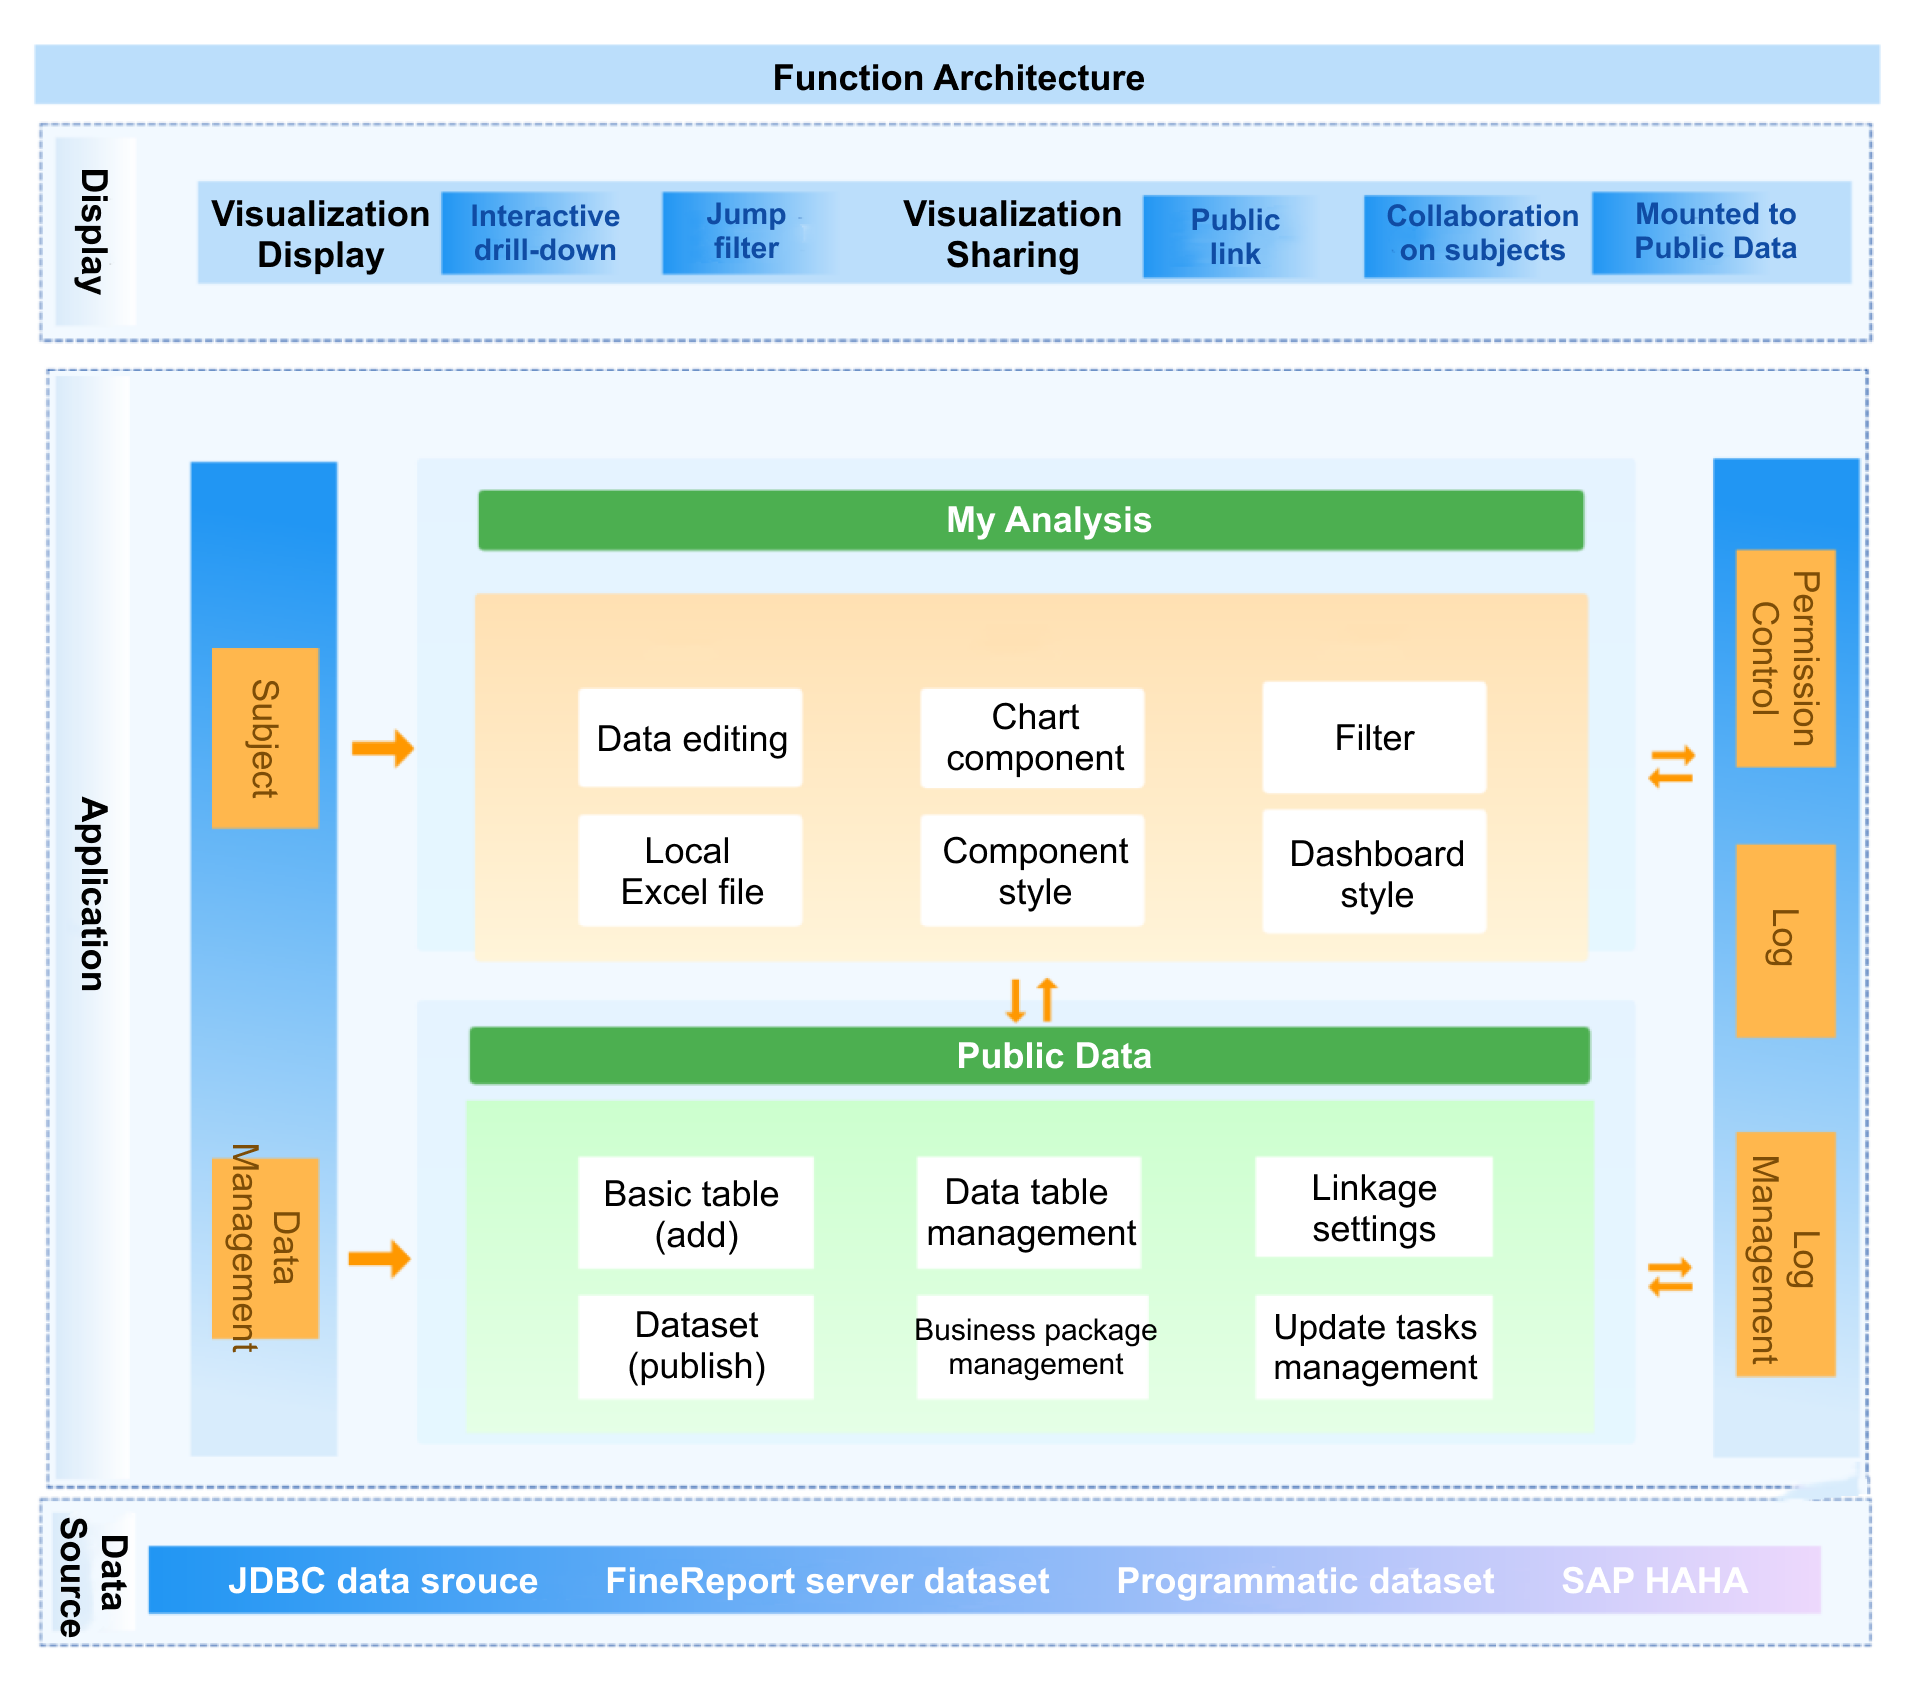
You want your business intelligence software to handle all your data, no matter where it lives. FineBI makes this easy for small businesses. You can connect to over 30 big data platforms and SQL sources, including Excel files. The platform uses a visual, low-code approach for cleaning and preparing data from different business systems. You get a high-performance engine that keeps your data synchronized and standardized. FineBI organizes your data into folders by business subject, so you can find what you need fast. You can model relationships between data sets and link them with composite keys. Self-service datasets let you explore and analyze data without manual setup.
| Feature | Description |
|---|---|
| Data Source Connectivity | Connects with big data platforms, SQL sources, and Excel datasets. |
| Data Preprocessing | Visual, low-code cleansing of data from various business systems. |
| ELT/ETL Engine | Dual-core engine for standardized, synchronized data. |
| Data Management | Folder-based classification for easy access and comprehension. |
| Data Modeling | Simple modeling and composite key linkage configuration. |
| Self-Service Datasets | Explore and analyze data without manual linkage setup. |
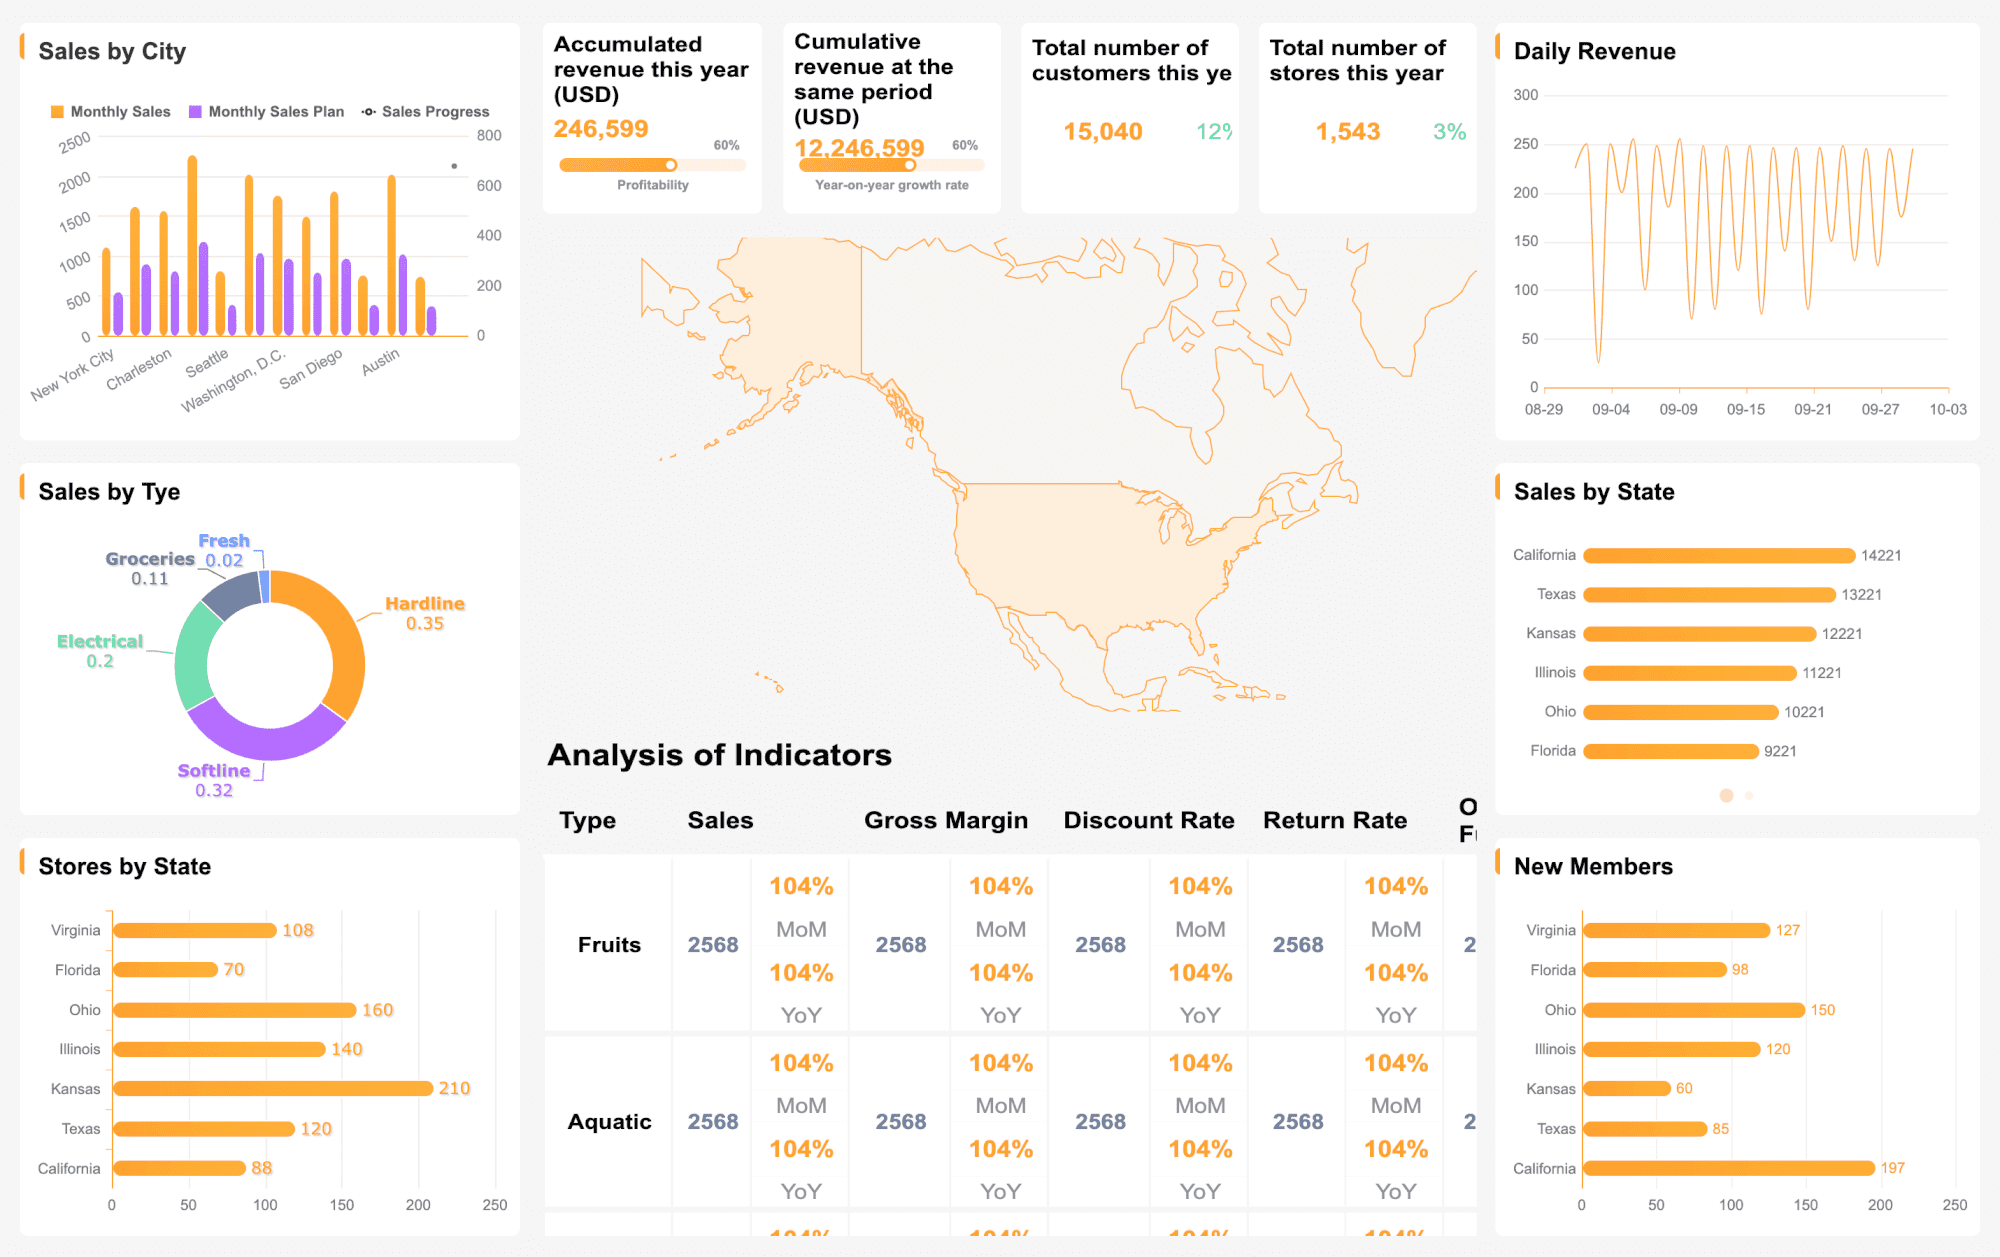
FineBI gives you the power to build dashboards on your own. You do not need coding skills or IT support. The drag-and-drop interface lets you create interactive dashboards quickly. You can choose from a wide range of charts and visual components. You can customize layouts and styles to match your business needs. Dashboards update in real time, so you always see the latest numbers. You can access dashboards from any device, making it easy to stay informed wherever you are.
You need to make decisions based on current data trends. FineBI supports real-time data processing, so you always work with up-to-date information. The platform integrates machine learning, helping you predict future trends and customer behavior. The user-friendly interface means everyone on your team can use analytics without long training sessions. FineBI connects seamlessly with your existing systems, so your workflow stays efficient.
| Feature | Relevance to Small Business Growth |
|---|---|
| Real-time data processing | Enables timely decision-making based on current data trends. |
| Machine learning integration | Predicts future trends and customer behavior. |
| User-friendly interfaces | All team members can use analytics without extensive training. |
| Seamless integration | Efficient workflows with existing systems. |
You want your team to work together and keep data safe. FineBI supports secure sharing of dashboards and reports. You can set permissions based on roles, departments, or business needs. Sensitive data stays protected with masking and access controls. Teams can collaborate on dashboards, share insights, and validate data together. FineBI helps small businesses maintain data security while promoting teamwork.
Tip: FineBI combines ease of use, scalability, and strong data analytics features. You get a business intelligence software that grows with your small business and helps you unlock the full value of your data.

When you look at BI tools for small business, you’ll notice two main types: self-service and IT-centric. Self-service tools let you and your team explore data without waiting for IT support. You get instant access, build reports, and make decisions faster. IT-centric tools, on the other hand, require technical help for setup and report creation. This can slow down your workflow and limit who can use the tool.
Here’s a quick comparison:
| Feature | Self-Service BI | Traditional BI |
|---|---|---|
| User Control | User-driven | IT-controlled |
| Data Access | Easy access | Limited access |
| Analysis Speed | Fast | Slow |
| Scalability | Scalable | Limited |
| Cost | Lower | High |
| Flexibility | High | Low |
| Report Creation | Business-user-driven | IT-driven |
If you want your small business to move quickly and empower everyone, self-service BI is the way to go.
Cost matters when you choose top bi tools. You want something affordable that grows with your business. FineBI stands out here. You start with basic analytics and scale up as your needs change. The drag-and-drop interface means you don’t need coding skills, saving you money on training and support. FineBI’s in-memory engine handles large data volumes, so you get quick answers even as your business grows. Many other tools charge extra for advanced features or need more IT resources, which can drive up costs for small businesses.
You need BI tools for small business that connect easily to your existing systems. FineBI makes integration simple. You can link databases, cloud platforms, and Excel files without hassle. Support is important too. FineBI offers clear guidance and resources, so you don’t get stuck. Other tools may require more technical help or have limited support for small teams. When you pick a BI tool, check how well it fits with your current setup and how much help you’ll get if you run into problems.
Tip: Choose a BI tool that matches your team’s skills, budget, and growth plans. The right choice will help your small business unlock insights and stay ahead.
When you look for BI Tools for Small Business, ease of use should be at the top of your list. You want a tool that feels intuitive and lets you get started quickly. A simple interface helps you and your team adopt the software faster. If you have experience with Excel, platforms like Power BI may feel familiar. Intuitive dashboards and clear navigation make self-service analytics possible, even for those new to data analysis.
| Factor | Importance Level |
|---|---|
| Data Integration | High |
| Visualization Capabilities | Medium |
| User Experience | High |
BI Tools for Small Business work best when they fit into your current workflow. You want seamless connections to your CRM, accounting software, and other business apps. This integration keeps your customer data consistent and up-to-date. Automated processes reduce manual entry and errors. Real-time synchronization ensures you always have the latest insights.
| Integration Aspect | Description |
|---|---|
| Seamless Data Exchange | Links accounting, CRM, and other tools for smooth workflows. |
| Automation of Tasks | Cuts down manual entry, boosting efficiency. |
| Real-time Data Synchronization | Keeps data updated for accurate decision-making. |
You want BI Tools for Small Business that fit your budget and offer real value. Pricing models vary, so compare options before you decide. Some tools charge per user, which works well for small teams. Others use capacity-based or usage-based pricing, which may save money if you process fewer queries.
| Pricing Model | Description |
|---|---|
| Per-User Subscriptions | Pay for each user; ideal for small teams. |
| Capacity-Based Pricing | Pay for computing power; suits larger groups with occasional users. |
| Usage-Based Pricing | Pay for queries or data processed; can be cost-effective for small businesses. |
Look beyond the sticker price. Consider ongoing support, training, and updates. These factors affect the total cost of ownership.
Strong support and an active user community make a big difference. You want quick answers when you run into problems. Many organizations see lower support costs and faster solutions when they use community platforms. Peer-to-peer learning helps you get more from your BI Tools for Small Business.
A helpful support network and engaged community boost your confidence and help you get the most out of your BI tool.
Getting the most out of BI Tools for Small Business starts with smart implementation. You want to treat your BI rollout like a startup. Test quickly and learn fast. Begin with departments that have clear pain points. Use self-service BI to keep costs low and empower your team. Keep your data clean. Reliable BI outputs depend on good data hygiene, so avoid duplicate records and outdated information. Set up threshold-based notifications for alerts. This helps you respond on time without getting overwhelmed by too many alarms. Regularly prune old reports to keep dashboards relevant and easy to use.
Tip: Continuous and contextual training works better than one-time workshops. Your team learns more when training fits their daily workflow.
You want your team to feel comfortable using BI Tools for Small Business. On-the-job training works best. Employees practice prompts and get outputs that matter to their roles. Online courses from platforms like LinkedIn or Coursera offer flexibility. Workshops led by experts give hands-on experience. Start by assessing your team’s AI literacy. Identify which BI tools you already use. Find out which departments need training. Use surveys or skills assessments to spot gaps.
| Training Method | Description |
|---|---|
| On-the-job training | Employees practice prompts and receive outputs relevant to their roles. |
| Online courses | Convenient for employees to complete alongside their workloads. |
| Workshops | Hands-on sessions focusing on real-world applications of BI and AI. |
You need to track the impact of BI Tools for Small Business. Use clear key performance indicators (KPIs) to measure progress. Revenue growth shows if your business is expanding. Profit margins tell you how well you manage costs. Customer acquisition costs help you see if your marketing pays off. Track sales calls, website traffic, and lead generation to measure sales and marketing efforts. Customer satisfaction scores reveal how happy your clients are. Product engagement metrics show how users interact with your offerings.
| KPI | Description |
|---|---|
| Revenue Growth | Measures the increase in revenue over a specific period. |
| Profit Margins | Indicates the profitability of the business after expenses. |
| Customer Acquisition Costs | Evaluates the cost associated with acquiring a new customer. |
Note: Regularly review these metrics to keep your BI strategy on track and make adjustments as your business evolves.
You’ve seen how BI tools for small business can transform your workflow. These platforms deliver actionable insights, simplify reporting, and make data visualization tools accessible to everyone. When you choose a solution with affordable pricing, you set your business up for growth and efficiency. Take time to explore FineBI and other options. The future of BI promises smarter decisions and more opportunities for small businesses.
Ready to unlock your data’s full potential? Start exploring today.

How to Do Retention Analysis for Business Success
What is Pareto Chart and How Does it Work
How DuPont Analysis Helps You Understand Your Business

The Author
Lewis
Senior Data Analyst at FanRuan
Related Articles

How to Build a UAT Dashboard for BI Projects: KPIs, Workflow, and Sign-Off Criteria
Learn how to build a UAT dashboard for BI projects. Track KPIs, manage workflow, and define sign-off criteria to ensure successful releases.
Lewis Chou
May 05, 2026
How to Build a UAT Dashboard for BI Projects: KPIs, Workflow, and Sign-Off Criteria
A uat dashboard gives BI teams one place to control testing progress, $1, defect risk, and stakeholder sign off before release. For IT managers, BI product owners, analytics leads, and operations directors, this is not a
Eric
Jan 01, 1970

Customer Insights Dashboard: What Enterprise Teams Should Track and Why It Matters
Learn what enterprise teams should track in a customer insights dashboard to centralize data, improve decisions, and drive revenue and retention.
Lewis Chou
May 01, 2026


