A cio dashboard is a digital platform that gives you a centralized, real-time view of your organization’s key IT metrics, helping you monitor performance and drive strategic decisions. You need a dashboard that delivers real-time insights so you can respond quickly and align your IT strategy with business goals. When you focus on actionable metrics, you avoid vanity data and instead use information that drives real results. FineReport empowers you to select the right KPIs, ensuring you see only the most meaningful data. Organizations with advanced dashboard measurement capabilities identify opportunities faster and optimize operations continuously, not just occasionally. As an it leader, you can trust that your cio dashboard supports smarter, more effective decisions.
A cio dashboard is a visual tool that gives you, as a cio or IT leader, a consolidated, real-time view of essential IT metrics and system health, helping you monitor infrastructure, track vendor performance, and manage operational risks to support decisions that align IT with business goals.
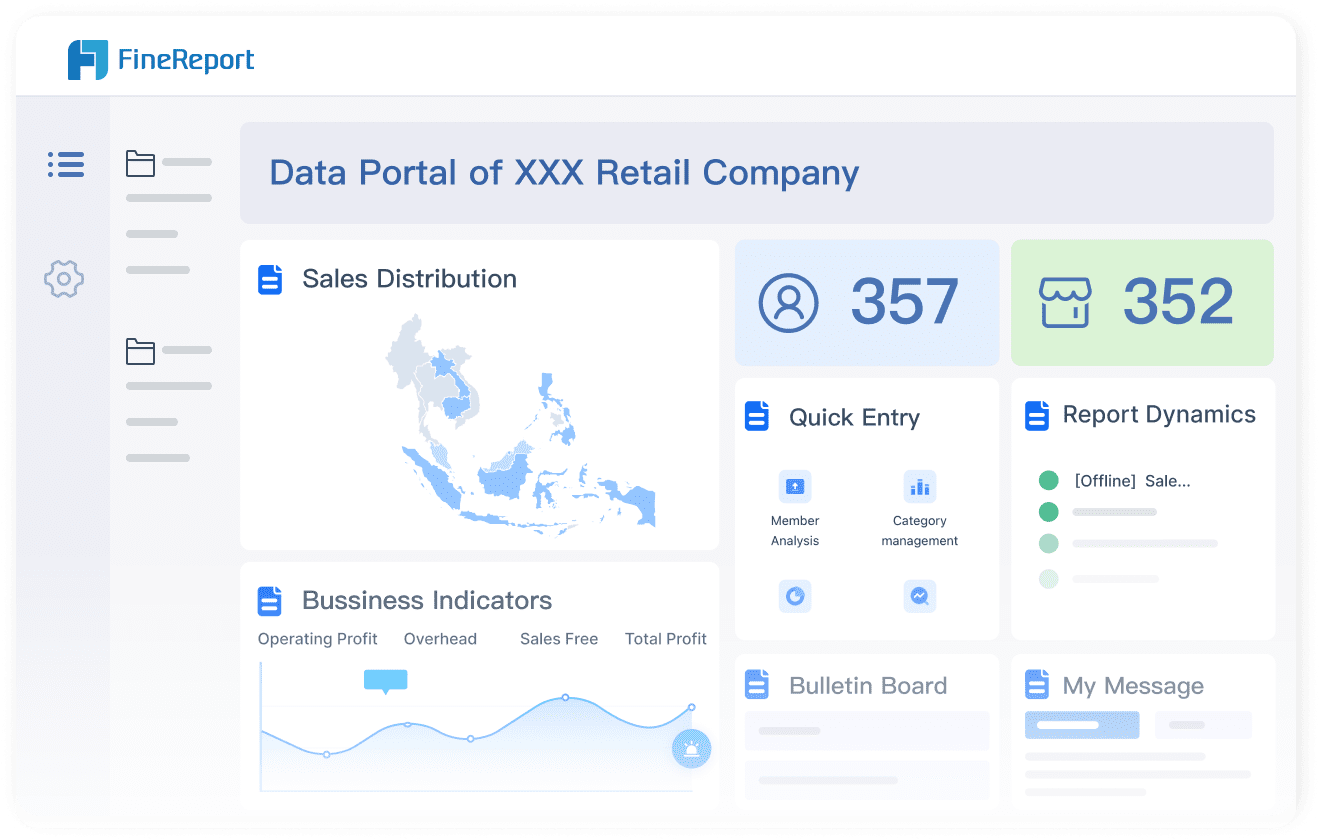
You use a cio dashboard to see all your critical IT data in one place. This dashboard acts as your command center, showing real-time data on system health, performance, and key performance indicators. You can monitor your IT infrastructure, vendor relationships, and risks without switching between different tools. This single view helps you make faster, more informed decisions. Leading IT organizations define a cio dashboard as a visual tool for chief information officers and IT leaders. It provides a consolidated, real-time view of essential KPIs and system health. You can use it to track IT operations and ensure your technology supports your business strategy.
A cio dashboard plays a strategic role in your daily work. It helps you track progress toward your goals and brings together financial, operational, and risk data into one unified hub. You get a real-time, comprehensive view of IT performance and business alignment. This unified visibility lets you see spending, risk, usage, and KPIs across your entire technology stack. You can align your IT initiatives with organizational objectives and streamline workflows. Having all your key indicators in one place saves you time and helps you focus on what matters most.
Tip: A well-designed cio dashboard tells a story. You can use visualizations to connect technology investments to business outcomes. When you present 8-12 strategic KPIs, you show how IT drives financial success and supports digital transformation.
Here is a table that summarizes the strategic roles of a cio dashboard:
| Strategic Role | Description |
|---|---|
| Tracking Progress | Track progress against strategic goals. |
| Unified Data Hub | Unify financial, operational, and risk data for better decisions. |
| Real-time View | Get a comprehensive, real-time view of IT performance and business alignment. |
| Unified Visibility | See spending, risk, usage, and KPIs across your technology stack. |
| Strategic View | Gain a strategic perspective on IT performance. |
| Initiative Alignment | Align IT initiatives with organizational objectives. |
| Workflow Streamlining | Streamline workflows and save time by tracking key indicators in one place. |
You can also use your cio dashboard to communicate value to your board and other leaders. Visual storytelling with clear metrics helps you show how IT supports business growth. Built-in analytics make it easier to demonstrate the impact of your technology investments.
FineReport gives you a modern solution for building effective cio dashboards. You can use its drag-and-drop interface to create complex dashboards without coding. FineReport provides real-time reporting, so you always have up-to-the-minute data for quick decisions. You can access your dashboards on any device, which keeps you informed wherever you are. FineReport also offers customizable templates, making it easy to design dashboards that fit your needs and look professional.
| Feature | FineReport Description |
|---|---|
| Drag-and-Drop Interface | Create complex dashboards easily, no coding required. |
| Real-Time Reporting | See real-time data visualizations for fast decision-making. |
| Mobile Accessibility | Access dashboards on any device, anytime. |
| Customizable Templates | Use a variety of templates for functional and attractive dashboards. |

FineReport supports your digital transformation by helping you unify data from multiple sources. You can monitor key metrics, track progress, and align your IT strategy with business goals. With FineReport, you gain the real-time insights you need to lead your organization with confidence.

A cio dashboard is a centralized digital platform that gives you, as a cio, a real-time overview of your IT environment, allowing you to monitor key metrics, identify risks, and make informed decisions that align technology with business goals.
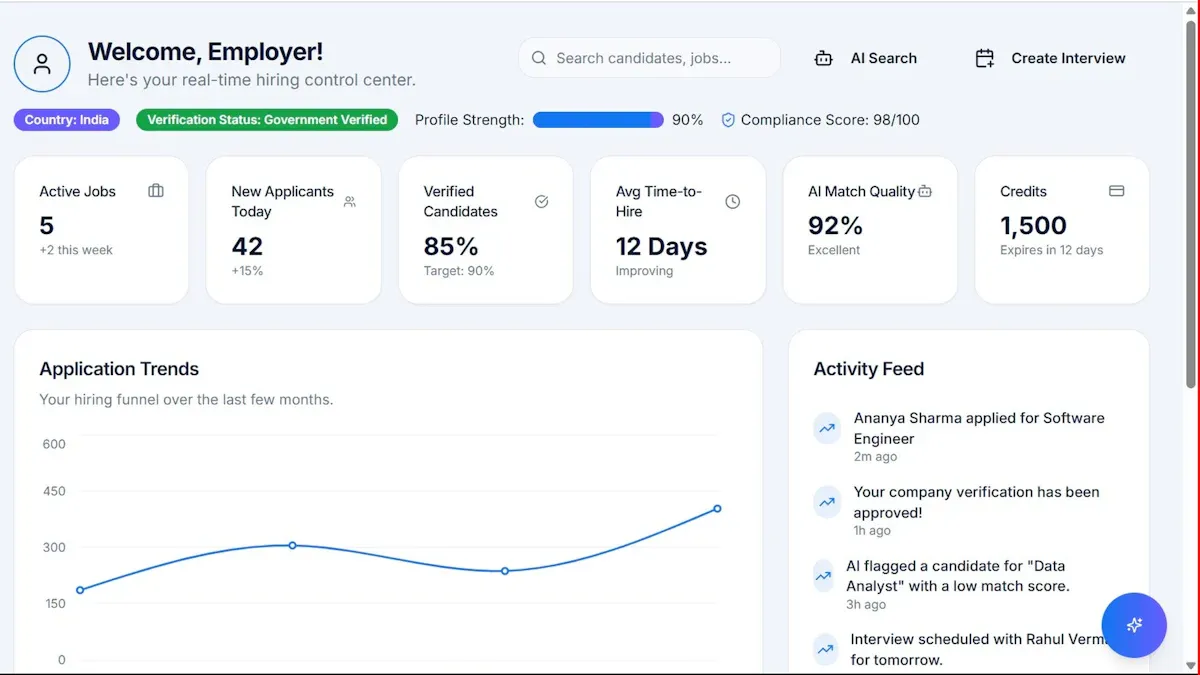
You need to see what is happening in your IT landscape as it unfolds. A cio dashboard delivers real-time visibility, letting you track key metrics across systems, teams, and projects. This immediate access to real-time data helps you spot trends, address issues, and respond to changes without delay. When you use a dashboard, you can view actionable metrics that matter most to your organization.
Real-time insights empower you to act quickly and keep your IT operations running smoothly.
Here is how organizations have improved visibility after implementing dashboards:
| Source | Benefit of Real-Time Visibility |
|---|---|
| IDC Blog | Enhanced visibility across teams, enabling data-driven adjustments. |
| Thinkaicorp | Immediate adjustments in sales processes due to real-time visibility. |
| Monday.com | Real-time insights into pipeline status, supporting prompt actions. |
| Keystone Corp | Improved production balance, quality control, and faster decision-making in supply chains. |
FineReport supports this benefit by integrating data from multiple sources and presenting it in a unified dashboard. You can access your dashboards on any device, ensuring you never miss critical updates.

A cio dashboard streamlines your daily operations. You no longer need to gather fragmented reports from different tools. Instead, you get a unified, automated view of your IT environment. This efficiency reduces manual reporting effort and frees up your time for strategic work.
| Metric | Before CIO Dashboard | After CIO Dashboard |
|---|---|---|
| Reporting effort | Fragmented, manual | Unified, real-time dashboard view |
| Data consolidation | Manual | Automated ingestion and analysis |
| Strategy alignment | Disconnected from business | Clear linkage to business outcomes |
| Decision-making | Reactive | Predictive and proactive |
| Reporting frequency | Infrequent, manual | Auto-generated, exportable reports |
| Manual reporting effort | High | 70% reduction |
You gain the ability to make decisions based on reliable data. Dashboards transform data chaos into decision intelligence. You see all your key metrics in one place, which reduces confusion and helps you make faster, more accurate decisions. This clarity supports your role as a cio and strengthens your leadership.
You want your IT strategy to support your business objectives. A cio dashboard helps you align IT operations with business goals by tracking both traditional IT metrics and business-aligned KPIs. This alignment ensures that your technology investments deliver measurable value.
| Traditional IT Metric | Business-Aligned KPI | Business Impact |
|---|---|---|
| Ticket Resolution Time | Ticket Reduction Trend | More time for billable work through proactive support |
| System Uptime | Time to Integrate New Services | Faster rollout of new offerings, supporting business growth |
| IT Spend % of Revenue | ROI on IT Initiatives | Focus on high-value services that drive revenue |
| Patch/Update Compliance | Business Continuity Readiness | Minimized downtime, protecting revenue and reputation |
FineReport enables you to customize your dashboard to highlight these key metrics. You can track the ROI of IT initiatives, monitor system uptime, and measure how quickly your team integrates new services. This approach keeps your IT strategy focused on business outcomes and digital transformation.
The Abu Dhabi Projects and Infrastructure Centre (ADPIC) shows how a cio dashboard can transform public sector management. ADPIC needed to oversee complex government projects while maintaining high standards for safety, quality, and sustainability. By implementing FineReport, ADPIC created a CXO dashboard tailored to their needs.
With FineReport, ADPIC gained:
You can see how FineReport adapts to unique requirements and delivers measurable results. ADPIC now makes faster, data-driven decisions and ensures every project aligns with their goals. This success story highlights the value of choosing a flexible, powerful dashboard solution for your organization.
A cio dashboard is a visual platform that gives you, as a cio, a unified, real-time view of your IT environment, helping you track key performance indicators, identify risks, and support digital transformation with actionable metrics.
You need to focus on the right cio dashboard metrics to drive better decisions. The most effective dashboards highlight key performance indicators that matter for IT leaders. These KPIs help you measure cost, efficiency, and customer satisfaction. Here is a table of the top KPIs you should track:
| KPI Name | Description |
|---|---|
| Total cost of ownership (TCO) | Measures the total cost of all aspects of IT, helping you find areas for budget reduction. |
| Return on investment (ROI) | Assesses the financial benefits of IT investments, guiding future technology initiatives. |
| Budget adherence | Tracks how closely IT spending matches your budget, helping you avoid overspending. |
| Cost per incident | Evaluates the average cost of each IT incident, improving incident management efficiency. |
| Customer satisfaction (CSAT) score | Shows how satisfied users are with IT services, reflecting the quality of your support. |
Tracking these KPIs gives you real-time insights into your IT operations and supports data-driven decision-making.
You must monitor security and risk to protect your organization. A strong cio dashboard tracks security incidents, response times, and compliance. Use these best practices to improve your monitoring:
You should also track the number and type of cyber attacks, conduct regular vulnerability scans, and monitor incident response times. These steps help you identify risks early and keep your systems secure.
FineReport lets you create dashboards that fit your unique needs. You can customize backgrounds, cell styles, chart designs, and titles. Adjust the layout to highlight the most important cio dashboard metrics for your team. FineReport supports multi-source integration, 3D dashboards, and mobile dashboards, so you can access your data anywhere. Companies in industries like telecommunications and insurance have used FineReport to gain complete performance visibility and respond quickly to issues. This flexibility empowers you to make better decisions and drive digital transformation.

A cio dashboard is a visual platform that gives you, as a cio, a single source of truth for your IT environment, helping you monitor key metrics, identify risks, and drive alignment with organizational objectives through actionable insights and real-time accuracy.
Start by selecting the right KPIs for your cio dashboard. Involve stakeholders from across your organization to ensure the metrics you choose support strategic goals and align IT with business goals. Make sure your KPIs are SMART: specific, measurable, achievable, relevant, and time-bound. Use benchmarking to set realistic targets and regularly review your KPIs to keep them relevant. Connect your dashboard to reliable data sources, integrating with existing IT systems for enhanced visibility into IT operations and data-driven decision-making.
Tip: Limit the number of metrics to avoid information overload. Tailor your dashboard to your audience so every metric is timely and actionable.
Gather input from key stakeholders through surveys or interviews. This helps you understand what each group needs from the dashboard. Create role-specific views that focus on the goals and decisions relevant to each team. Use clear charts and graphs for quick understanding. FineReport’s drag-and-drop design lets you customize layouts, backgrounds, and chart styles. Organize your dashboard logically and use clear labels to make navigation easy. Regularly update your dashboard to adapt to changing business needs and support digital transformation.

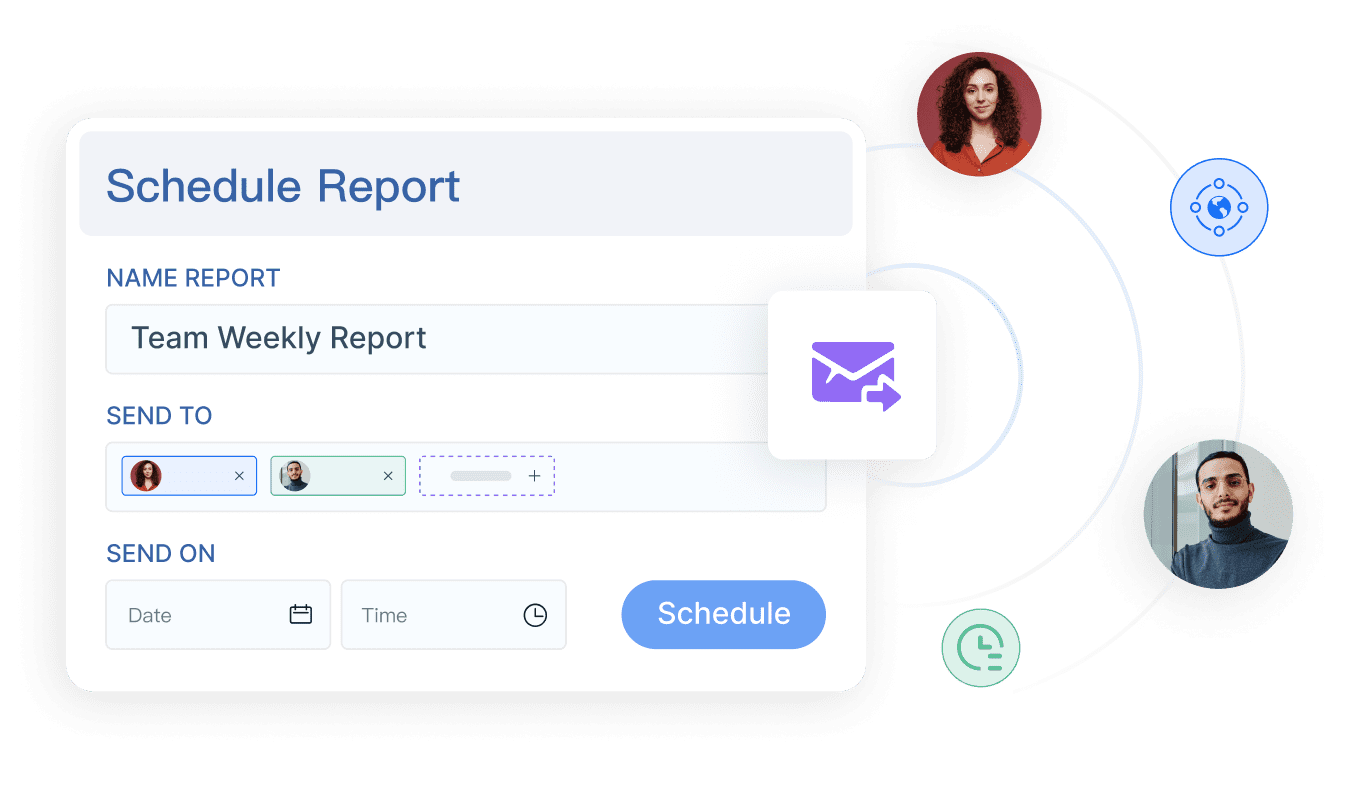
FineReport offers automation features that save you time and improve data accuracy. Use scheduled tasks to generate and distribute reports automatically. Take advantage of dynamic effects and animation for engaging visualizations. Automated reporting provides real-time insights, enabling you to identify risks and make proactive decisions. This approach supports continuous improvement and ensures your cio dashboard always delivers value as technology evolves.
| Benefit | Description |
|---|---|
| Time Savings | Automated reporting frees up time for strategy and problem-solving. |
| Improved Data Accuracy | Standardized workflows reduce errors and ensure consistent data. |
| Real-Time Insights | Immediate access to data supports quick adjustments and decision-making. |
A cio dashboard gives you a real-time, unified view of your IT environment, helping you monitor performance, manage risk, and align technology with business goals—all in one place.
You can use a cio dashboard to track the most important metrics in IT operations. This includes monitoring uptime, service level agreement (SLA) compliance, and resource allocation. You also gain the ability to monitor compliance and risk posture. With a dashboard, you enhance operational efficiency by seeing all your data in one place. You can quickly spot issues and respond before they become bigger problems.
A cio dashboard helps you stay ahead of threats and supports your digital transformation journey.
In manufacturing, you can use dashboards to improve equipment effectiveness and productivity. Real-time dashboards give you immediate insight into equipment performance. You can respond faster to downtime events and identify where losses occur, such as unplanned downtime or slow cycle times. This helps your team prioritize improvements and supports continuous improvement.
Dashboards in manufacturing shift your approach from reactive to proactive, making it easier to optimize productivity.
You can apply cio dashboards in many industries to drive better decisions. In the public sector, organizations like ADPIC use dashboards to oversee complex projects and ensure alignment with strategic goals. In finance, retail, and healthcare, dashboards help you monitor KPIs, track progress, and support digital transformation. You gain a single source of truth, making it easier to share insights and drive business value.
Tip: Use dashboards to bring together data from different sources. This helps you see the big picture and make smarter decisions.
A cio dashboard is a tool that gives you a real-time view of your IT environment and key metrics. You use it to drive efficiency and align your IT strategy with business goals. FineReport helps you build dashboards that support improved decision-making processes. Assess your current tools and consider FineReport to make better decisions as a cio.
Explore FineReport’s solutions today to see how you can transform your cio dashboard and gain a real-time view for smarter decisions.
Top Data Observability Tools Every Data Team Should Know
Top 11 Data Reporting Tools for Business Intelligence
Best Data Lake Tools for Modern Enterprises
What is Data Platform Services and What Makes Them Essential

The Author
Lewis
Senior Data Analyst at FanRuan
Related Articles

Payment Analytics Dashboard: 12 KPIs Every Operations Leader Should Track to Cut Revenue Leakage
Losing revenue to declines? Discover 12 essential KPIs to track in your payment analytics dashboard to stop leakage and manage disputes.
Lewis Chou
May 05, 2026

SOC Dashboard Explained: 12 Essential KPIs, Views, and Workflows Security Teams Use
Learn about SOC dashboards, the 12 essential KPIs for security teams, and how they centralize alerts and workflows for faster threat detection and response.
Lewis Chou
May 05, 2026

EMR Dashboard Guide: 12 Metrics to Track for Faster Clinical and Operational Decisions
Learn the 12 essential EMR dashboard metrics to track for faster clinical and operational decisions, improving patient flow and revenue cycle management.
Lewis Chou
May 05, 2026


