A CFO dashboard is a real-time, interactive display that brings together all your key financial metrics, helping you lead with clarity and confidence. In 2026, you see innovation everywhere—98% of CFOs like you invest in digital transformation to empower finance teams. You gain instant insights, spot trends, and improve decision-making outcomes with every financial dashboard you use. Advanced tools like FineReport now let you unify data, automate reporting, and visualize results. You can finally focus on what matters most: making bold, strategic moves as a finance leader.
Innovation in CFO Dashboard Design
Key Trends for 2026
You stand at the center of a finance revolution. The cfo dashboard in 2026 looks nothing like the static reports of the past. You now lead with dashboards that harness digital transformation, artificial intelligence, and real-time analytics. These tools give you the power to see the future and act fast.
Here are the top trends shaping your financial dashboard experience:
Trend Number
Trend Description
1
Advanced scenario planning and agile governance for navigating uncertainty
2
Finance leaders are strategy leaders—especially when they embrace advanced AI and cloud
3
Finance-led cost management helps drive measurable value
You use dashboards that adapt to change, support strategic thinking, and drive value across your organization. FineReport helps you stay ahead by connecting your data, automating your reporting, and delivering powerful data visualization. You can now focus on what matters most—leading your team with confidence.
Benefits for Finance Leaders
You want to make decisions quickly and accurately. The modern cfo dashboard gives you real-time financial data, so you never miss a beat. You see trends and outliers right away, which helps you spot risks before they grow. Your team stays aligned because everyone focuses on the same critical metrics.
Tip: When you automate your reporting processes, you save time and reduce errors. This means you get more accurate insights, faster.
Here are some ways dashboards transform your finance leadership:
Real-time data gives you instant access to key financial information.
Improved visibility helps you focus on what matters most.
Automation reduces manual work and boosts accuracy.
Visualization of trends makes risk management easier.
Aligning your team around shared metrics builds clarity and trust.
Companies that use advanced dashboards see real results. For example, a technology company reduced its DSO from 65 to 42 days and improved cash flow forecast accuracy from ±20% to ±5%. A global enterprise cut its monthly close time from 12 days to 5 days and identified millions in excess working capital. These wins show how the right dashboard can unlock measurable value for your finance team.
FineReport stands out by making these innovations possible. You get seamless integration, customizable dashboards, and mobile access. You lead with data, drive strategy, and inspire your organization to reach new heights.
1.Real-Time Cash Flow CFO Dashboard
Purpose and Use Case
You want to lead your organization with confidence. A real-time cash flow CFO dashboard gives you the power to see your financial position instantly. You no longer wait for end-of-month reports. Instead, you watch your cash position update in real time. This dashboard helps you spot liquidity challenges before they become problems. You can act quickly, adjust spending, or renegotiate terms with vendors. When you have immediate visibility, you make decisions that keep your business strong and agile.
With a cash flow dashboard, you track every dollar as it moves. You drill down into specific accounts or transactions. You compare actuals against your forecast. If something looks off, you get an alert right away. This level of control inspires confidence in your team and your board.
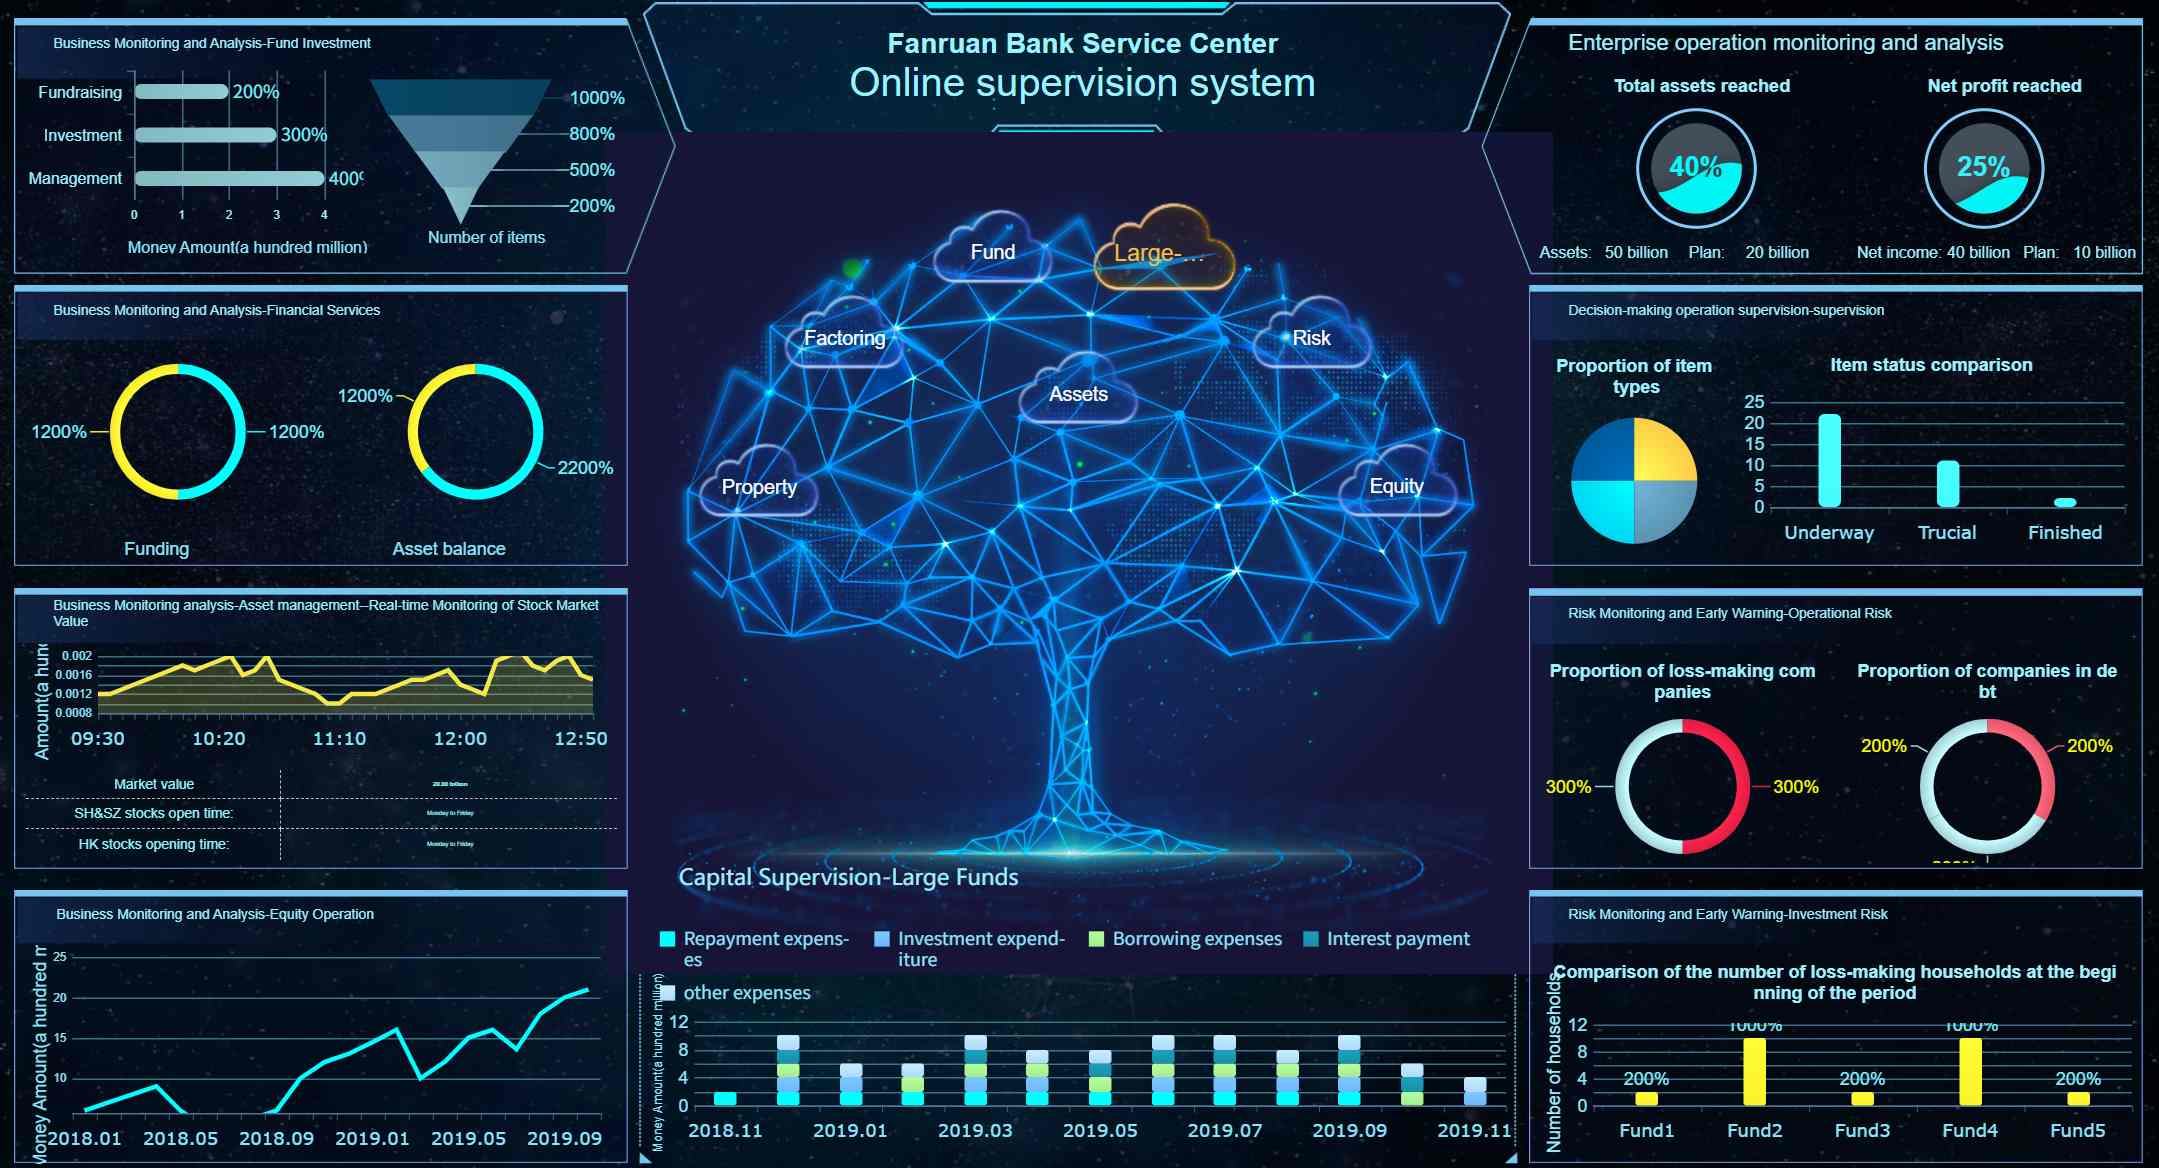
CFO Dashboard created by FineReport (Click to Engage)
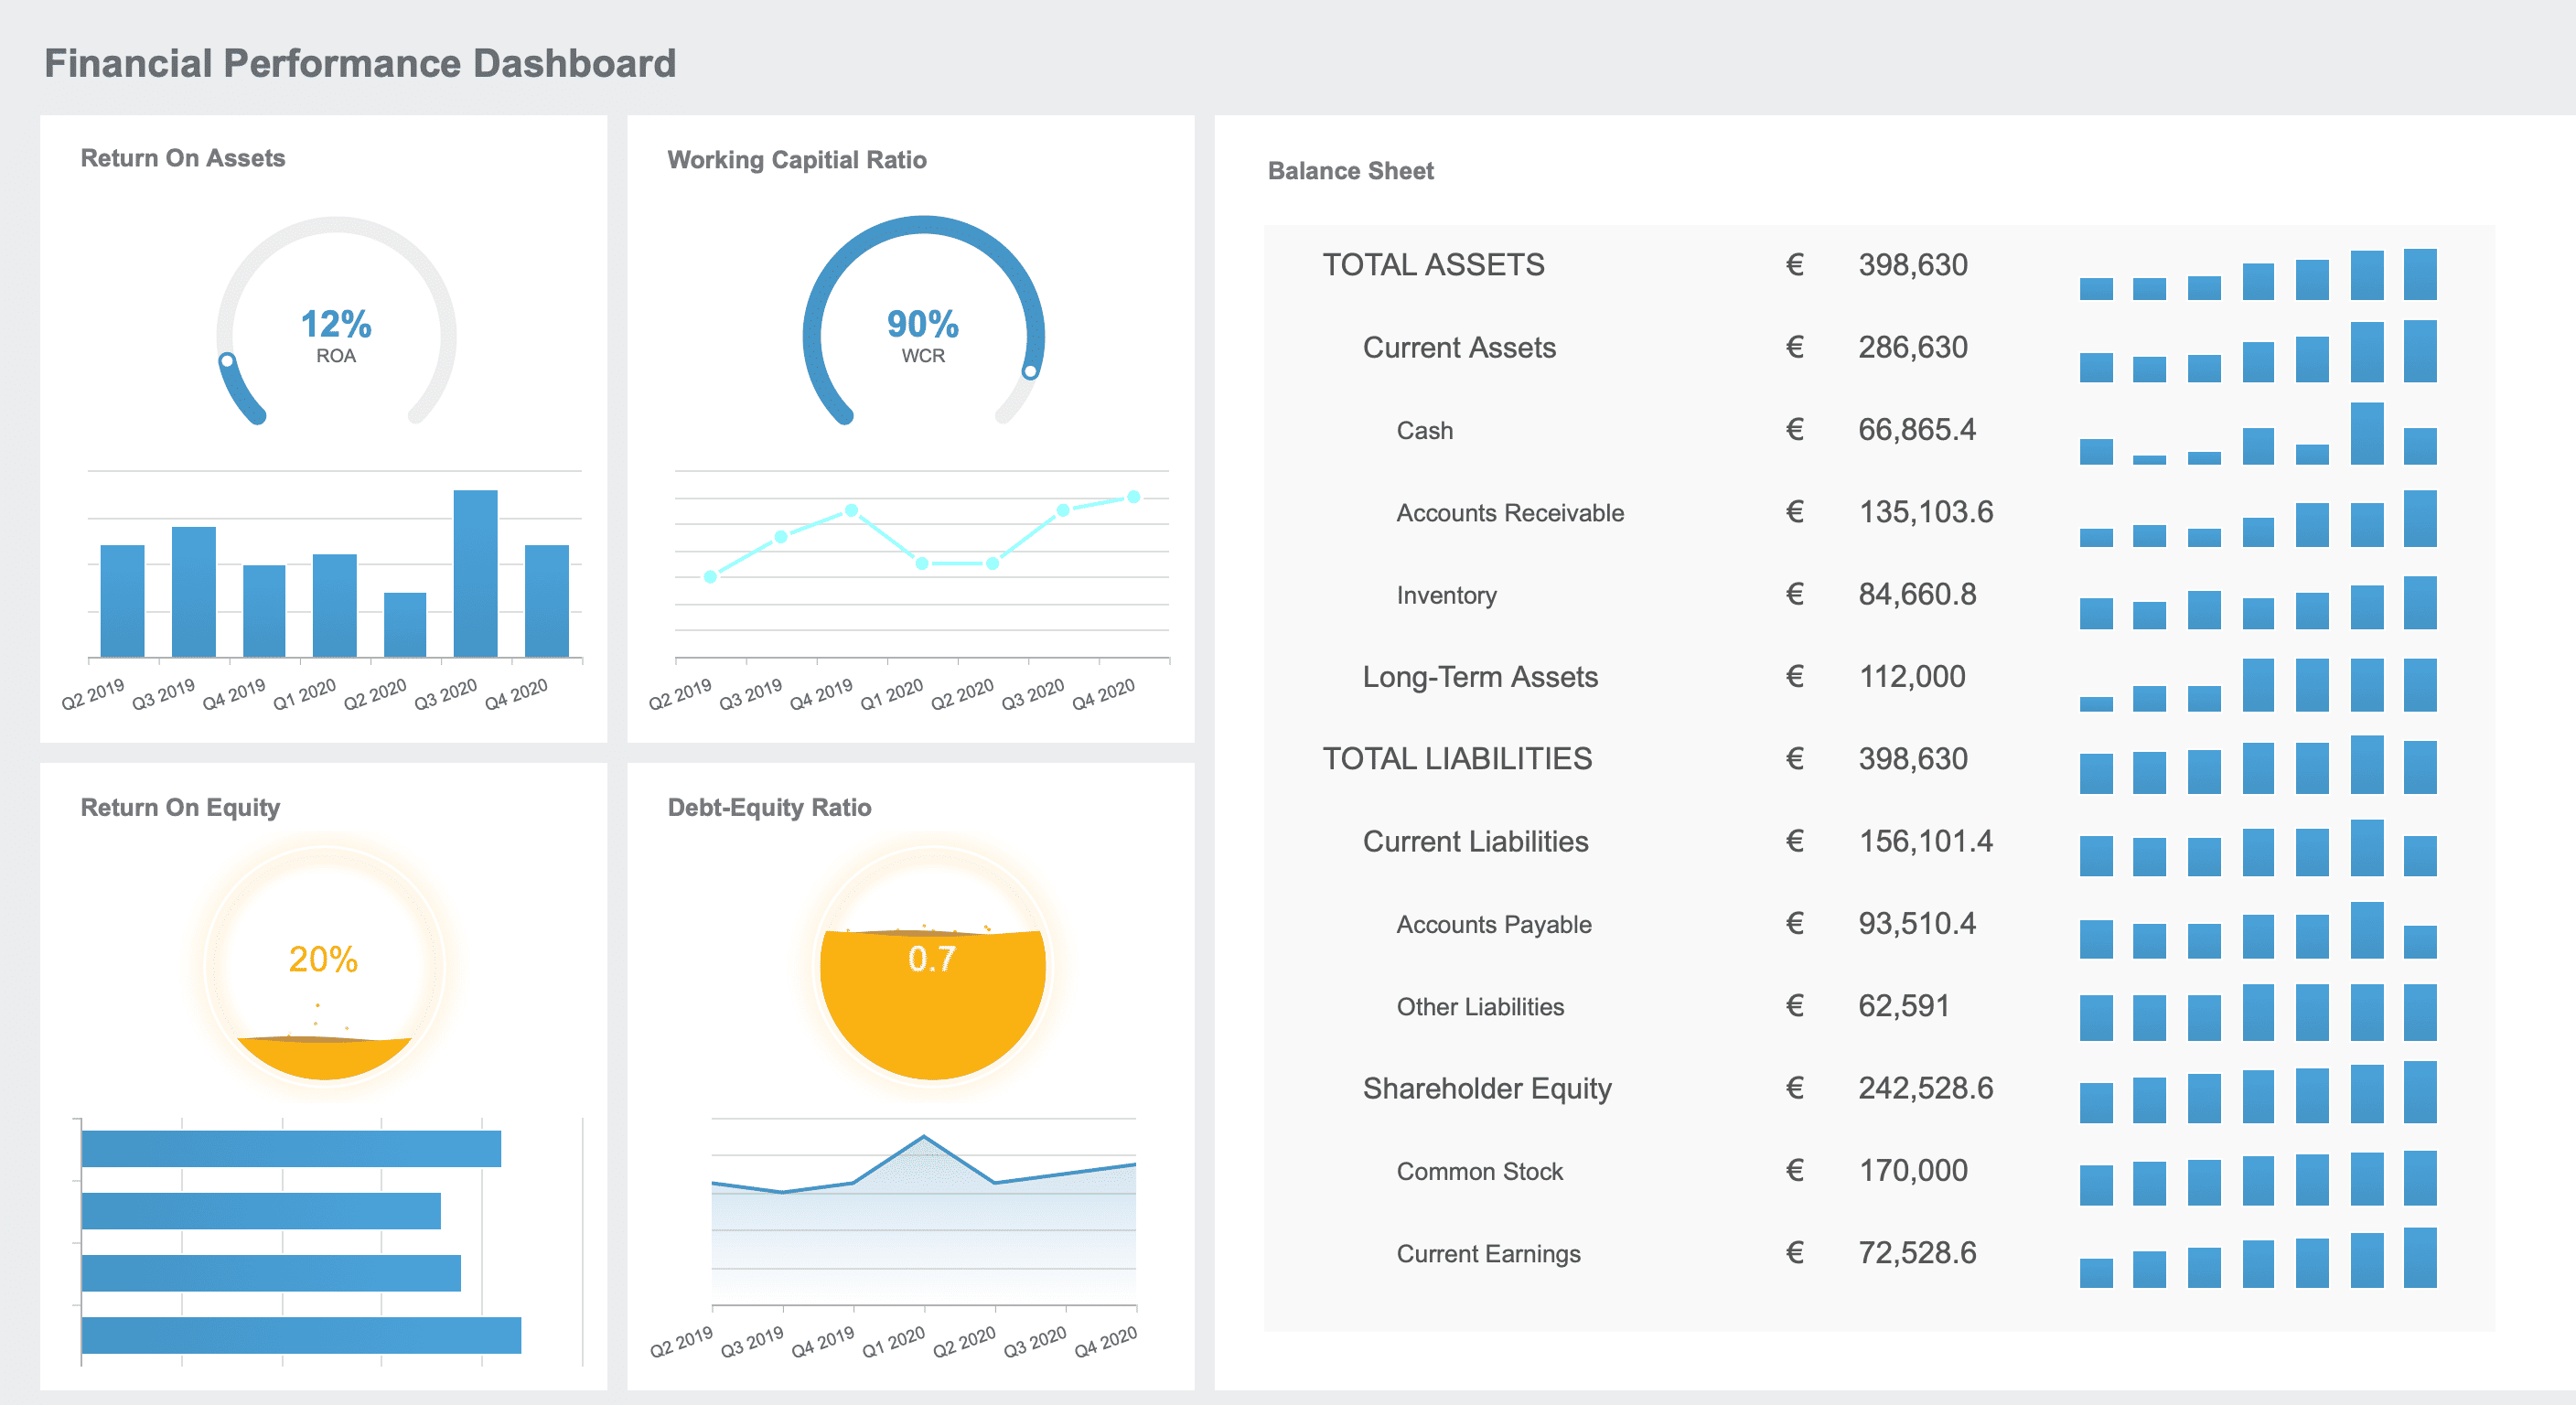
Variance analysis between actual and forecasted cash
These metrics help you understand your financial health at a glance. You see where your money comes from and where it goes. You spot trends and take action before issues grow.
FineReport Features
FineReport empowers you to build a CFO dashboard that works for you. You connect to real-time data sources, so your dashboard always shows the latest numbers. FineReport’s integration tools pull data from multiple systems, giving you a complete view. You use interactive visualizations to explore your financial data. Drill-down features let you investigate details with a single click. Real-time alerts notify you when action is needed. FineReport’s AI insights flag patterns early, so you can adjust your strategy and stay ahead.
With FineReport, you transform your cash flow dashboard into a powerful decision-making tool. You lead with clarity, speed, and confidence.
You want to see the future of your business with clarity. A predictive financial dashboard gives you that power. You use this dashboard to run scenario planning, test different strategies, and prepare for what comes next. When you face uncertain markets, you rely on predictive analytics to guide your decisions. You can spot trends, anticipate risks, and adjust your plans before challenges grow. This dashboard helps you answer questions like, “What happens if sales drop?” or “How will a new investment impact cash flow?” You gain confidence because you see the road ahead.
A predictive financial dashboard tracks the numbers that matter most for your future. You monitor revenue projections, expense forecasts, and profit margins. You also keep an eye on risk indicators and early warning signs. With this dashboard, you do not just look at history—you look forward. Here are some of the most valued features you will find:
Feature
Description
Proactive Risk Anticipation
Models monitor financial data and alert you to anomalies before they become problems.
Improved Forecast Accuracy
Machine learning updates your projections as new data arrives, making your planning stronger.
Data-Driven Decision Efficiency
You turn uncertainty into clear, probability-based choices.
Operational Cost Reduction
Automation streamlines your processes and reduces manual work.
Enhanced Customer Retention
Predictive analytics help you design better retention strategies for your clients.
Competitive Advantage Through Agility
You act faster than competitors by using forward-looking insights.
You also benefit from improved accuracy, early risk detection, real-time adjustments, and resource efficiency. These dashboards deliver 10-20% better precision by recognizing patterns in large datasets. You spot risks early and adjust your strategy in real time.
FineReport AI Integration
FineReport takes your predictive financial dashboard to the next level. You connect data from multiple sources, so your dashboard always reflects the latest information. FineReport’s AI-driven forecasting tools help you build models that learn and improve over time. You can automate scenario analysis and receive alerts when key metrics shift. With FineReport, you do not just react—you lead. You make smarter, faster decisions and inspire your team to embrace the future with confidence.
3.ESG & Sustainability CFO Dashboard
Purpose
You want to lead your organization toward a brighter, more responsible future. An ESG & Sustainability CFO dashboard helps you track the impact your business has on the world. You see more than just financial numbers. You measure your progress on environmental, social, and governance goals. This dashboard gives you the power to meet new regulations and build trust with investors. You can show your board and your team that you care about more than profit. You care about people and the planet, too.
You use this dashboard to keep your company ready for mandatory ESG disclosures. You make sure your data is accurate and your reporting meets the highest standards. You inspire your team to take action and improve your company’s reputation.
You track the most important ESG and sustainability metrics on your cfo dashboard. These indicators help you see where you stand and where you need to go next.
Metric Type
Description
Scope 1, 2, and 3 Emissions
Track direct and indirect greenhouse gas emissions across your value chain.
Climate Risk Assessments
Evaluate potential climate-related risks to your business and operations.
Governance Indicators
Assess governance practices, including board diversity and ethical standards.
Social Indicators
Measure your social impact, such as labor practices and community engagement.
You pay special attention to Scope 3 emissions. These make up the largest part of your carbon footprint. They include emissions from purchased goods, transportation, business travel, employee commuting, waste management, product use, and end-of-life treatment.
Note: Regulations now require you to disclose ESG metrics in specific formats. Your dashboard helps you stay compliant and ready for audits.
FineReport Visualization
FineReport gives you the tools to bring your ESG story to life. You use efficient data entry and validation to keep your metrics current. You connect to multiple databases, so you always have the latest information. FineReport lets you create engaging visualizations, including dynamic 3D charts, to present your ESG data clearly. You can customize your dashboard to highlight non-financial KPIs that matter most to your stakeholders.
With FineReport, you streamline compliance and improve your corporate reputation. You build trust with investors and prepare for future regulations. Your ESG & Sustainability CFO dashboard becomes a powerful tool for positive change and long-term success.
4.Profitability Dashboard for CFOs
Use Case
You want to unlock the true potential of your business. A profitability dashboard gives you the power to analyze margins and cost centers with precision. As a cfo, you use this dashboard to identify which products or services deliver the highest returns. You see where your financial resources go and spot opportunities to improve efficiency. When you understand your cost structure, you can make bold decisions that drive growth. You inspire your team to focus on what matters most—creating value and boosting profits.
Imagine reviewing your cfo dashboard and instantly seeing which departments outperform others. You notice trends in operating expenses and quickly address areas that need improvement. With this dashboard, you lead your organization toward greater financial success.
Your profitability dashboard tracks the metrics that matter most. You gain clarity on every aspect of your financial performance. Here is a table that highlights key metrics you monitor:
Key Metric
Description
Gross Margin
Shows the profitability of your core business operations
Operating Expense Ratio
Reveals how efficiently you're managing overhead costs
Net Profit Margin
Indicates overall profitability after all expenses
Operating Expense
Tracks fixed and variable costs to identify cost-saving opportunities
You also keep an eye on:
Gross Profit Margin
Operating Cash Flow Ratio
Customer Acquisition Cost (CAC)
Lifetime Value to CAC Ratio
Net Profit Margin
Quick Ratio
Cash Conversion Cycle
Revenue Growth Rate
These metrics help you measure profitability, liquidity, efficiency, and growth. You use your cfo dashboard to compare actual results with targets and adjust your strategy as needed.
FineReport Customization
FineReport empowers you to customize your profitability dashboard for maximum impact. You use multi-report layouts to display complex financial data in a clear, organized way. The dashboard adapts to your needs, whether you prefer adaptive, absolute, or tab layouts. Drill-down analysis lets you explore details with a single click. When you select a component, linked data refreshes instantly, giving you deeper insights.
You transform your cfo dashboard into a powerful tool for financial leadership. FineReport’s flexible design helps you visualize trends, uncover hidden opportunities, and inspire your team to achieve new levels of success.
5.Expense Management CFO Dashboard
Purpose
You want to control costs and drive efficiency. An expense management CFO dashboard gives you the power to track spending in real time. You no longer wait for monthly reports or chase down receipts. Instead, you see every expense as it happens. This dashboard helps you spot trends, flag outliers, and keep your financial goals on track. You empower your team to make smarter choices and stay within budget. With clear visibility, you lead your organization toward better financial health.
Expense management dashboards do more than just track numbers. They help you enforce policies, reduce errors, and improve compliance. You gain confidence knowing your financial data is accurate and up to date. Your team spends less time on manual tasks and more time on strategic work. You create a culture of accountability and transparency.
You focus on the metrics that matter most for expense control. The right cfo dashboard brings these numbers to your fingertips:
Metric
Description
Operating Cash Flow (OCF)
Shows cash from core operations, key for liquidity and short-term health.
EBITDA
Measures profitability, useful for benchmarking and financing.
Burn Rate
Tracks how fast you spend cash, vital for startups and growth planning.
Customer Acquisition Cost (CAC)
Reveals the average cost to gain a new customer, guiding marketing spend.
Customer Lifetime Value (LTV)
Estimates total revenue from a customer, helping with pricing and retention.
Forecast Accuracy
Compares actual results to projections, improving planning and budgeting.
Accounts Receivable Turnover
Measures how quickly you collect payments, impacting cash flow and working capital.
These metrics help you understand spending patterns, spot inefficiencies, and make informed financial decisions.
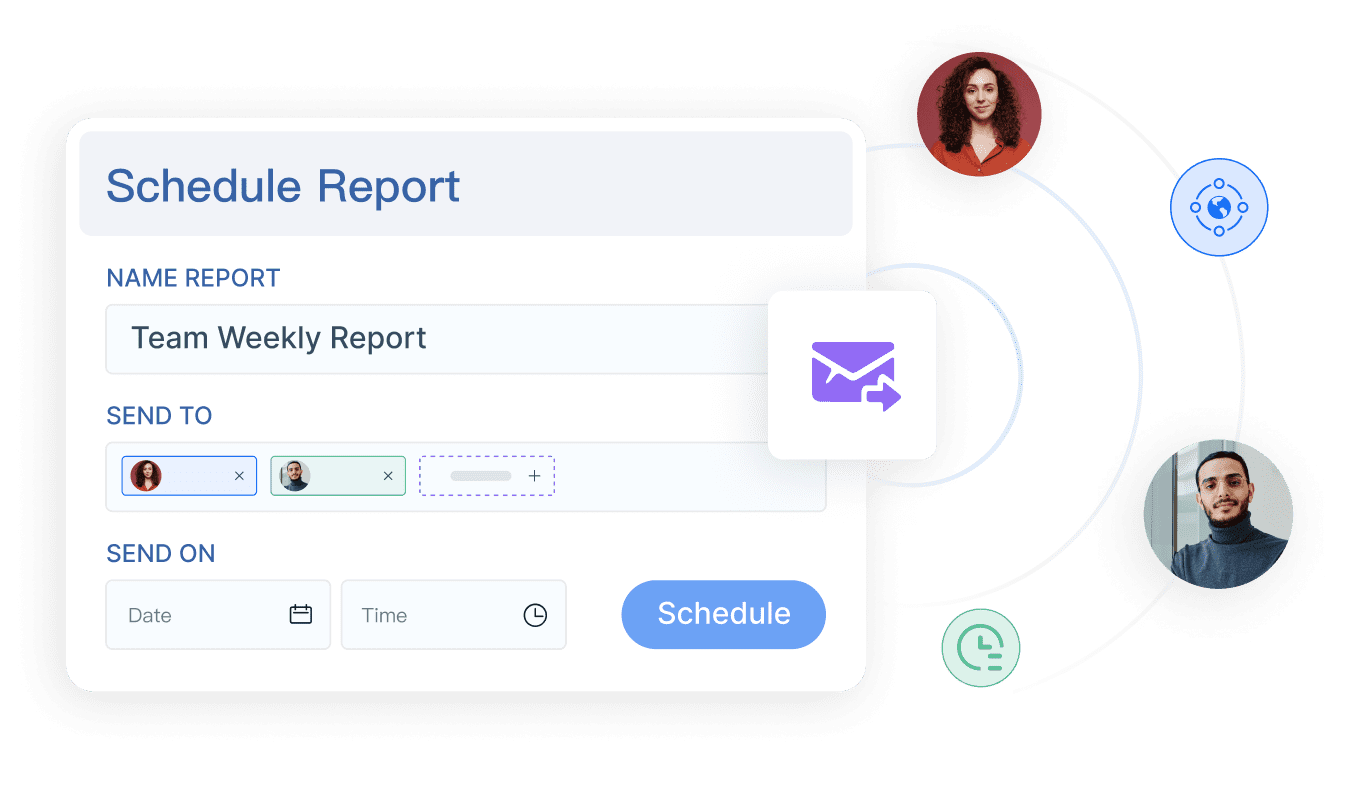
FineReport Automation
You want automation that works for you. FineReport transforms your expense management dashboard into a powerful tool for control and insight. You schedule reports to run automatically, so you never miss a deadline. Data entry forms make it easy for employees to submit expenses, reducing paperwork and speeding up approvals. Real-time data integration ensures your dashboard always shows the latest numbers.
FineReport’s data alert plugin monitors key indicators and sends instant notifications when something looks off. You get proactive alerts, not just static reports. This means you can act fast to prevent overspending or policy violations. Automation removes manual steps, reduces errors, and frees your team to focus on higher-value work.
Tip: When you automate expense tracking, you unlock cost-saving opportunities and improve budgeting accuracy. Your cfo dashboard becomes a source of actionable financial insights.
With FineReport, you lead with confidence. You turn your expense management dashboard into a strategic asset that supports your financial goals and inspires your team to achieve more.
6.Risk Management Financial Dashboard
Use Case
You want to protect your company from surprises. A risk management financial dashboard gives you the power to spot threats before they become problems. You see all your risks in one place. This unified view helps you act fast and make smart choices. As a cfo, you use the dashboard to monitor credit risk, market risk, and operational risk. You can track overdue payments, asset quality, and customer concentration. When you see a warning sign, you respond quickly. Your cfo dashboard becomes your early warning system.
You lead your team with confidence. You know where the risks are and how to handle them. The dashboard helps you build a culture of awareness and action. You inspire others to stay alert and take responsibility for financial health.
You focus on the numbers that matter for risk. Your dashboard tracks key risk indicators, so you never miss a beat. Here are some important metrics you monitor:
Metric
What It Shows
Overdue Payments
Tracks late payments and potential losses
Asset Quality
Measures the health of your company’s assets
Customer Concentration
Shows if too much revenue comes from one client
Market Volatility
Monitors changes in market conditions
Credit Exposure
Reveals how much risk you take with lending
You use these metrics to spot trends and take action. Your cfo dashboard helps you see the big picture and the small details.
FineReport Integration
FineReport makes risk management simple and powerful. You connect data from many sources, so your dashboard always shows the latest information. FineReport’s risk management solution brings all your financial data together. You get real-time alerts when something changes. The dashboard updates instantly, so you never fall behind.
You use FineReport to set up automated workflows. When a risk indicator crosses a threshold, you get a notification. You can drill down into the data and find the cause. FineReport helps you move from data gathering to strategic planning. Your cfo dashboard becomes a tool for action, not just observation.
Tip: When you use real-time alerts and unified data, you make better decisions and protect your company’s future.
7.Global Operations CFO Dashboard
Purpose
You lead a company that spans continents. Every day, you face new challenges in global markets. A global operations CFO dashboard gives you the power to see your entire business at a glance. You monitor performance across regions, track currency impacts, and respond quickly to changes. This dashboard helps you understand how external factors like GDP growth rates or geopolitical events affect your financial results. You stay ahead by watching global economic indicators and market trends. When exchange rates shift, you see the impact instantly. You make decisions that keep your business strong, no matter where you operate.
Successful companies use technology to automate multicurrency accounting. You invest in reliable software that updates exchange rates in real time. Your dashboard shows how currency fluctuations affect your financial performance. You gain confidence because you always know where you stand.
You track the numbers that matter for global success. Your cfo dashboard brings these key metrics together:
Revenue Growth Rate: Spot trends across countries and timeframes.
Gross Margin: Compare profitability by product, region, or customer.
EBITDA: Monitor operational profitability with real-time updates.
Operating Expenses: Use the Operating Expense Ratio to control costs.
Cash Flow Forecasting: Ensure liquidity for every region.
Customer Acquisition Cost: Measure efficiency across markets.
Customer Lifetime Value: Understand long-term value by geography.
Debt-to-Equity Ratio: Balance risk and stability.
Real-Time Financial Data: Make fast, informed decisions.
Variance to Budget: Stay aligned with your global goals.
Tip: When you track these metrics, you spot risks and opportunities before they grow.
FineReport Data Sources
FineReport empowers you to build a cfo dashboard that unifies global data. You connect to databases in every country where you operate. FineReport’s multi-database connectivity lets you pull information from SQL, Oracle, SAP, and more. You see all your financial data in one dashboard, no matter the source or currency. Cross-border reporting becomes simple. You drill down into details for any region or business unit. FineReport keeps your dashboard updated with real-time exchange rates and financial results. You lead with clarity, speed, and confidence—ready to take on the world.
8.AI-Driven Forecasting Executive Dashboard
Use Case
You want to guide your company with confidence. An executive dashboard powered by AI gives you the tools to see beyond the present. You use this executive dashboard to plan for the future, test strategies, and respond to market changes. You rely on real-time insights to make bold decisions. Your cfo dashboard becomes the center of your strategic planning. You see patterns in your financial data and act before challenges arise. You inspire your team to embrace innovation and move forward with purpose.
You use the executive dashboard to align your leadership team. Everyone sees the same financial metrics and understands the goals. You track performance, spot risks, and adjust your strategy quickly. You lead with clarity and vision.
Metrics
Your executive dashboard tracks the numbers that matter most. You monitor revenue growth, profit margins, and operating expenses. You keep an eye on cash flow, working capital, and debt ratios. You use the cfo dashboard to compare actual results with your forecast. You see trends in customer acquisition cost and lifetime value. You measure efficiency and growth across departments.
Metric
Description
Revenue Growth
Tracks increases in sales over time
Profit Margin
Measures profitability of operations
Operating Expenses
Shows cost control and efficiency
Cash Flow
Monitors liquidity and financial health
Debt Ratio
Assesses risk and stability
You use these metrics to guide your executive dashboard decisions. You stay ahead of the competition and drive your company toward success.
FineReport AI Capabilities
FineReport transforms your executive dashboard into a powerful decision-making platform. You use AI-driven automation to analyze financial data and generate insights instantly. You set up scheduled reports that update your executive dashboard without manual effort. You use interactive visualizations to explore trends and drill down into details. FineReport connects to multiple data sources, so your executive dashboard always shows the latest information.
You rely on predictive analytics to improve your forecast accuracy. FineReport’s AI features help you spot risks early and adjust your strategy. You empower your leadership team to make smarter decisions. Your executive dashboard becomes the foundation for growth, innovation, and financial excellence.
Tip: When you use AI-powered executive dashboards, you unlock new levels of strategic planning and inspire your organization to reach its full potential.
9.Working Capital CFO Dashboard
Purpose
You want to keep your business running smoothly. A working capital CFO dashboard gives you the power to manage your receivables, payables, and inventory with confidence. You see every part of your financial cycle in one place. This dashboard helps you spot cash flow gaps before they become problems. You can act quickly to collect payments, pay vendors, or adjust inventory levels. When you use a cfo dashboard, you gain control over your financial health and keep your company agile.
You inspire your team to focus on what matters. With a clear view of your working capital, you make decisions that drive growth. You lead by example, showing everyone how to use data to solve challenges and reach new goals.
Key Metrics
Your dashboard tracks the numbers that matter most for working capital. These metrics help you understand your financial position and take action fast.
Metric
What It Shows
Days Sales Outstanding (DSO)
How quickly you collect payments from customers
Days Payable Outstanding
How long you take to pay your suppliers
Inventory Turnover
How often you sell and replace inventory
Current Ratio
Your ability to cover short-term obligations
Cash Conversion Cycle
The time it takes to turn investments into cash
You use these metrics to spot trends and make smart choices. Your cfo dashboard keeps you focused on improving every part of your financial process.
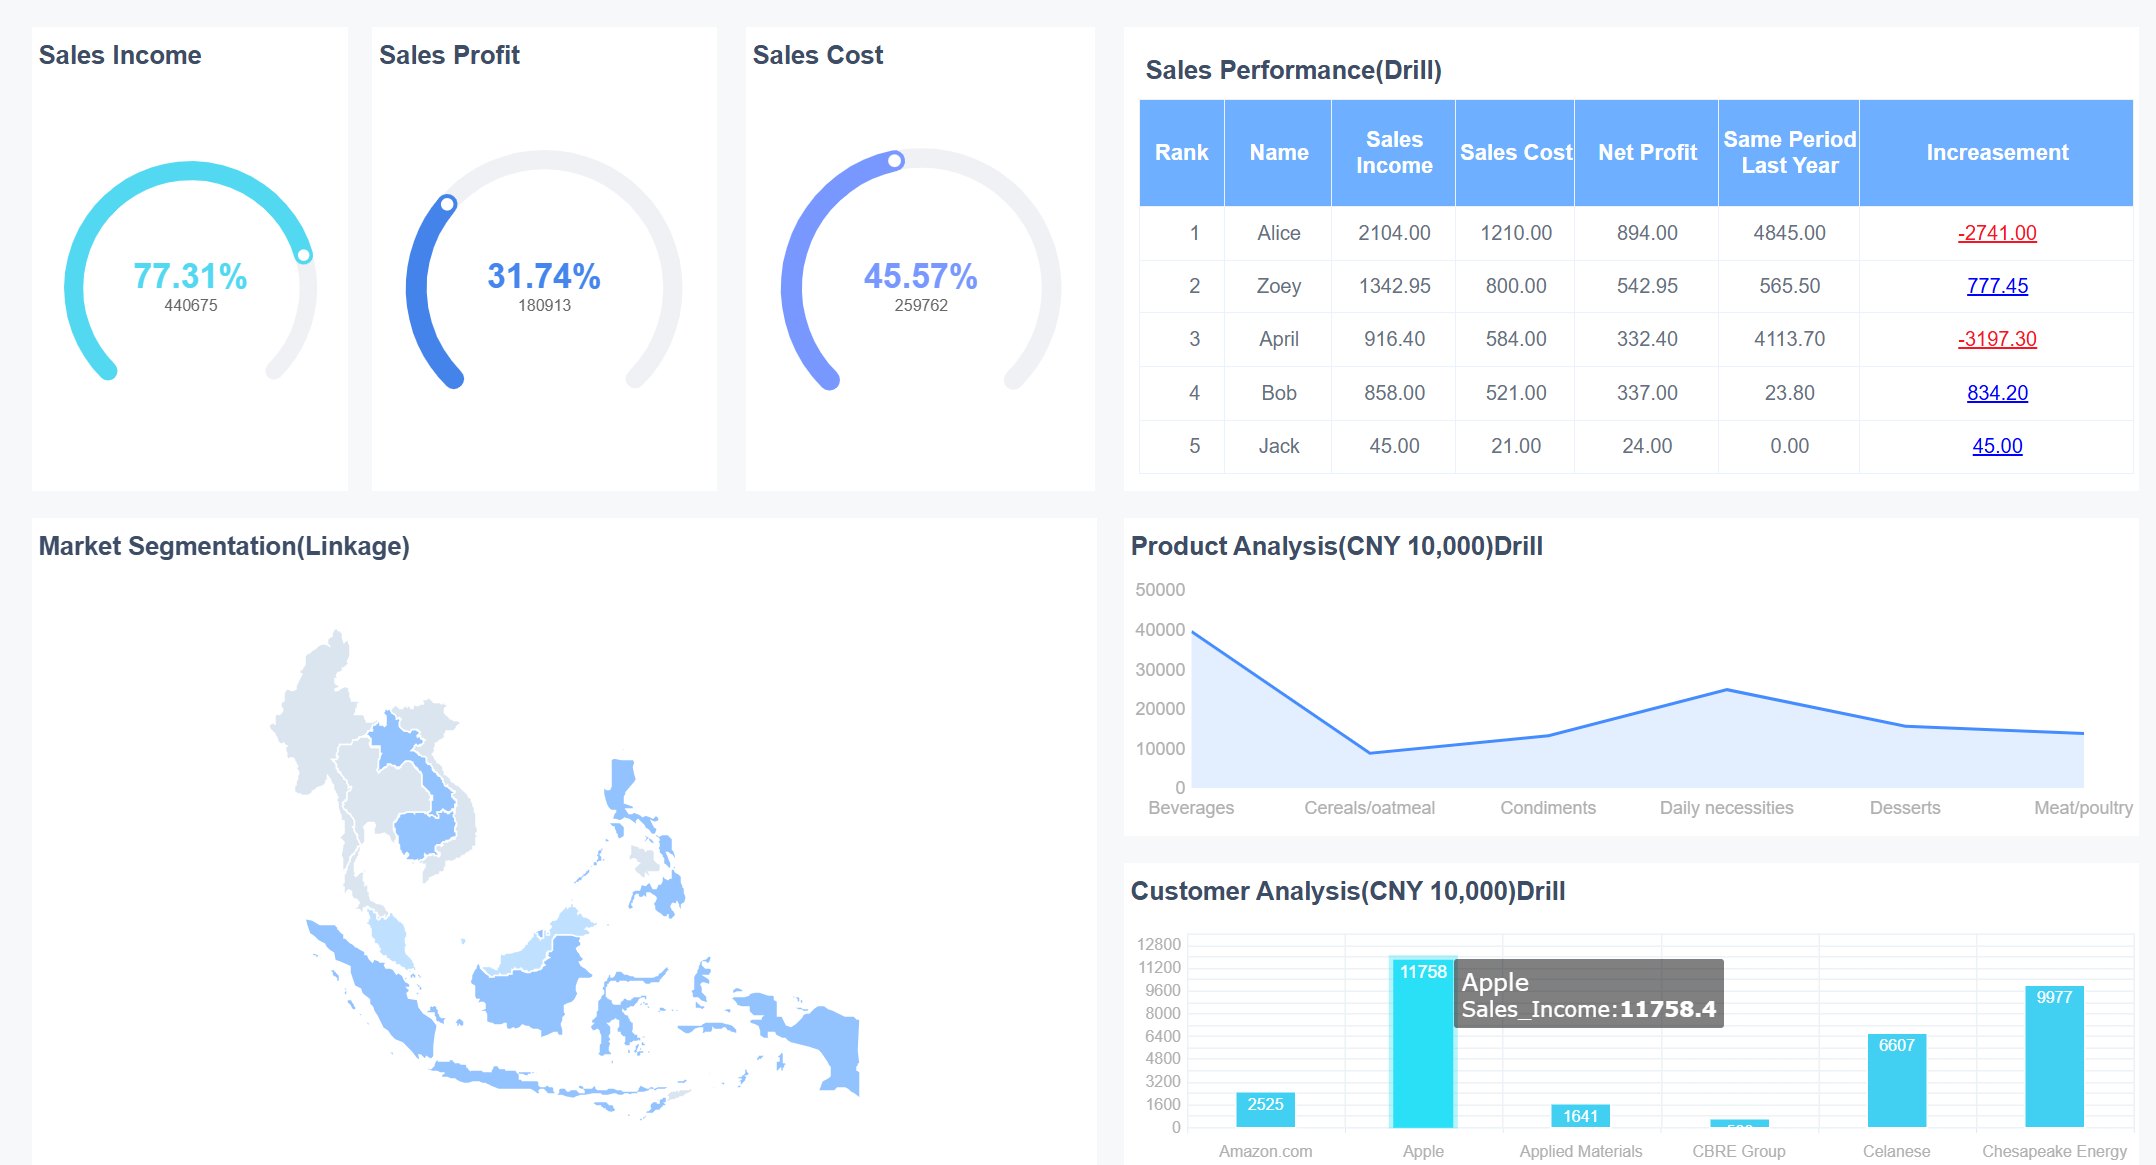
FineReport Drill-Down
FineReport gives you the tools to dig deeper into your data. You use drill-down features to move from a high-level view to the details behind each number. When you see a spike in DSO, you click to see which customers are late. If inventory turnover drops, you drill down to find slow-moving products. FineReport’s parameter query function lets you filter data by region, product, or time period. You get answers fast, so you can act with confidence.
FineReport Drill-Down (Click to Engagge)
Tip: Use FineReport’s interactive dashboard to set alerts for key financial metrics. When something changes, you get notified right away. This helps you stay ahead and lead your team to success.
A working capital CFO dashboard powered by FineReport turns your financial data into action. You build a culture of accountability and drive your business forward.
10.Board-Ready Executive Dashboard
Use Case
You want to inspire your board with clear, compelling stories. A board-ready executive dashboard helps you do just that. You use this cfo dashboard to turn complex financial data into simple visuals that everyone understands. When you walk into a board meeting, you feel confident. You know your dashboard will help you explain trends, highlight achievements, and address challenges. Your board sees the big picture and the details, all in one place. You guide the conversation and keep everyone focused on what matters most.
Metrics
You choose the right metrics to tell your financial story. Your cfo dashboard brings together the numbers that matter for your board. Here are some key metrics you might include:
Metric
Why It Matters
Revenue Growth
Shows business momentum
Net Profit Margin
Reveals overall financial health
Cash Flow Status
Highlights liquidity and stability
Expense Breakdown
Tracks spending and cost control
Forecast vs. Actual
Measures accuracy and performance
You use these metrics to answer questions and support your recommendations. Your dashboard makes it easy for board members to see progress and spot opportunities.
FineReport Storytelling
FineReport empowers you to create a board-ready executive dashboard that stands out. You use export features to share your dashboard as PDF, Excel, or Word files. You print reports in high quality for in-person meetings. FineReport’s presentation mode lets you display your dashboard on big screens, making your financial story come alive. You add interactive charts and visuals that engage your audience. When someone asks a question, you drill down into the data and provide instant answers. Your cfo dashboard becomes more than a report—it becomes a tool for leadership and inspiration.
Tip: Use FineReport’s export and presentation features to make every board meeting a success. You show your board the full value of your financial leadership.
Best Practices for CFO Dashboard Implementation
Aligning with Strategy
You want your cfo dashboard to drive real results. Start by making sure every dashboard aligns with your company’s strategy. Ask yourself what problems you want to solve. Choose metrics that match your business goals. Limit the number of metrics to five to eight. This keeps your dashboard focused and easy to use. When you design with purpose, your cfo dashboard becomes a tool for action, not just a report.
Build dashboards that answer key business questions and use the right charts.
Focused Metrics
Select five to eight metrics that support your financial strategy.
Effective Color Schemes
Use clear color codes like red, amber, and green to show performance.
Data Quality
You need accurate data for your cfo dashboard to work. Automate data refreshes so your dashboard always shows the latest numbers. Schedule updates to match board meetings or monthly reviews. Automation reduces manual work and improves data reliability. When your financial data is fresh and correct, you make better decisions.
Tip: Use automation to keep your dashboard up to date and avoid errors.
User Adoption
A great dashboard only works if people use it. Share your cfo dashboard across departments. This breaks down silos and helps everyone work together. Train your team so they know how to use the dashboard. Encourage feedback and make improvements. When everyone trusts the dashboard, your financial insights become stronger.
FineReport Deployment Tips
FineReport makes cfo dashboard deployment simple. Use its drag-and-drop designer to build dashboards fast. Connect to all your financial data sources, from databases to Excel files. Set up scheduled tasks for automatic report delivery. Use FineReport’s permission controls to keep sensitive data secure. Try the mobile dashboard feature so you can check your numbers anywhere. With FineReport, you empower your team to lead with data and drive your financial strategy forward.
You stand at the edge of a new era in financial leadership. Innovative cfo dashboard tools help you make smarter decisions and move faster than ever. FineReport gives you the power to build a dashboard that fits your needs and supports your goals. Take time to review your current cfo tools. Explore FineReport to unlock future-ready financial management.
Ready to learn more? Visit FineReport’s website or reach out for a demo. Your journey starts now.
Access a wealth of case studies, industry insights, and solution guides to accelerate digital transformation.
FAQ
How do I start building a CFO dashboard with FineReport?
You can begin by connecting your data sources in FineReport. Use the drag-and-drop designer to add charts and tables. Choose key metrics that match your goals. FineReport makes dashboard creation simple and fast.
Can I access my dashboards on mobile devices?
Yes! FineReport dashboards work on smartphones and tablets. You can check your numbers anywhere, anytime. Stay connected and make decisions on the go.
What data sources does FineReport support?
FineReport connects to over 500 data sources, including SQL, Oracle, SAP, Excel, and cloud platforms. You can unify all your financial data in one dashboard.
How does FineReport help improve team collaboration?
FineReport lets you share dashboards across departments. You control permissions, so everyone sees what they need. This builds trust and keeps your team focused on shared goals.