A marketing performance dashboard puts all your data in one spot and helps you see your marketing data right away. You can find and use information fast with a Data Resource module. You do not have to wait for IT to make reports or dashboards. You can look at and share charts on any device. Tools like FineBI from FanRuan help you decide things faster. They let you use new data as soon as it comes in.
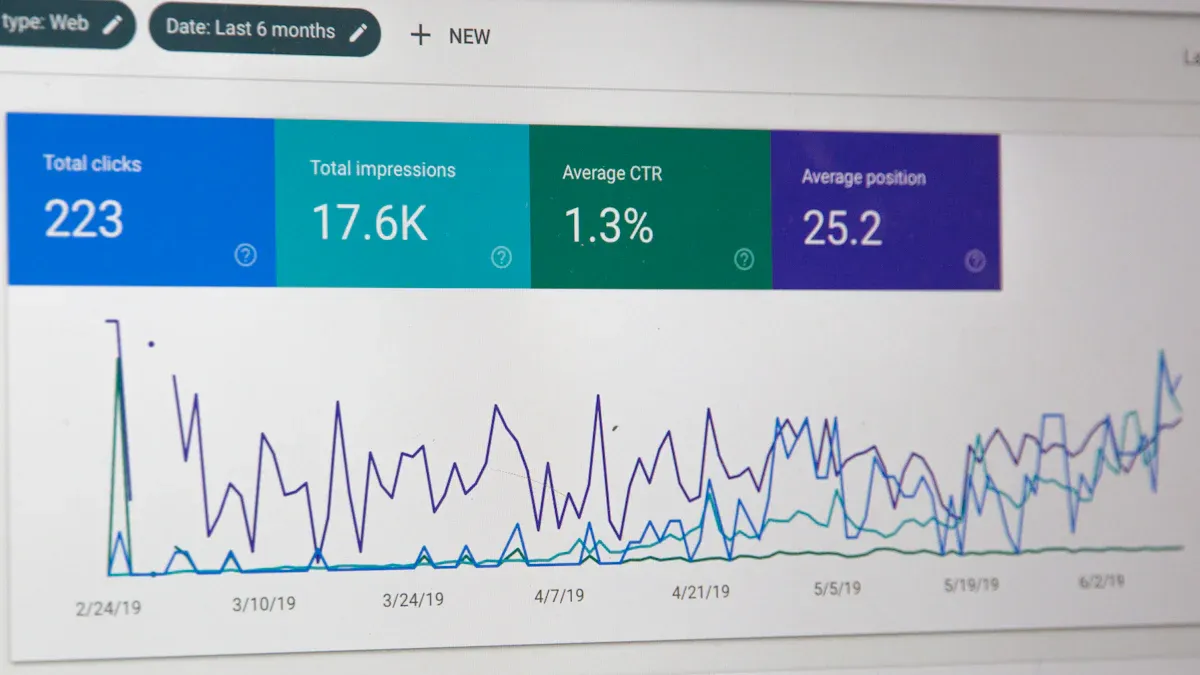
A marketing performance dashboard is a visual tool that brings together marketing data from different channels to track key performance indicators and see marketing impact in one place. This tool helps you keep track of your work and see how well you are doing. You do not have to open lots of files or use different systems. The dashboard shows your marketing work in a simple way.
You can use a marketing dashboard to check your campaigns and see what is working. It also helps you find what needs to get better. Tools like FineBI from FanRuan make this easy for you. You just connect your data, and the dashboard shows results right away. You do not need to be an expert to use it.
A marketing performance dashboard helps you in many ways. You can see your marketing work and results without waiting. The dashboard puts all your numbers in one place. You do not have to look at each platform by itself.
Here are the main things a marketing dashboard does:
You get many good things when you use a marketing performance dashboard. The dashboard shows you all your marketing numbers and KPIs as they happen. You can see if your work matches your business goals. You can change your plans fast if you need to. This helps you make your marketing better.
Solutions like FineBI give you more features. You can put data from all your platforms together for a clear picture. You get real-time insights, so you can make quick choices with up-to-date information. The dashboard does reports for you, so you do not have to do them by hand. You save time and can look deeper into your data.
You can use a marketing dashboard on your computer or phone. The dashboard works well even if your internet is slow. You can work with your data and share results with your team. This makes your marketing work easier and helps you do better.
A marketing performance dashboard helps you see, understand, and improve your marketing. You can track your work, spot trends, and make smart choices every day.
A marketing dashboard puts all your marketing data together. FineBI helps you do this easily. You can connect things like databases, spreadsheets, and APIs. The dashboard updates your marketing numbers by itself. You do not have to copy numbers or wait for reports. You see new information as soon as it comes in.
FineBI lets you get data from many places at the same time. You can link tables and mix information from different campaigns. This helps you watch marketing metrics on all your channels. You can do connected actions on many data sets in one report. You get a full look at your marketing work.
Here is a table that shows how FineBI does data integration:
| Feature | Description |
|---|---|
| Data Source Integration | The same report can fetch data from multiple databases or multiple data tables. |
| Associated Operations | Allows performing associated operations on multiple data sets within the report. |
You save time and make fewer mistakes. The dashboard updates on its own. You always see the newest marketing numbers. You can spot trends and act fast. Real-time insights help you make smart choices for your marketing.
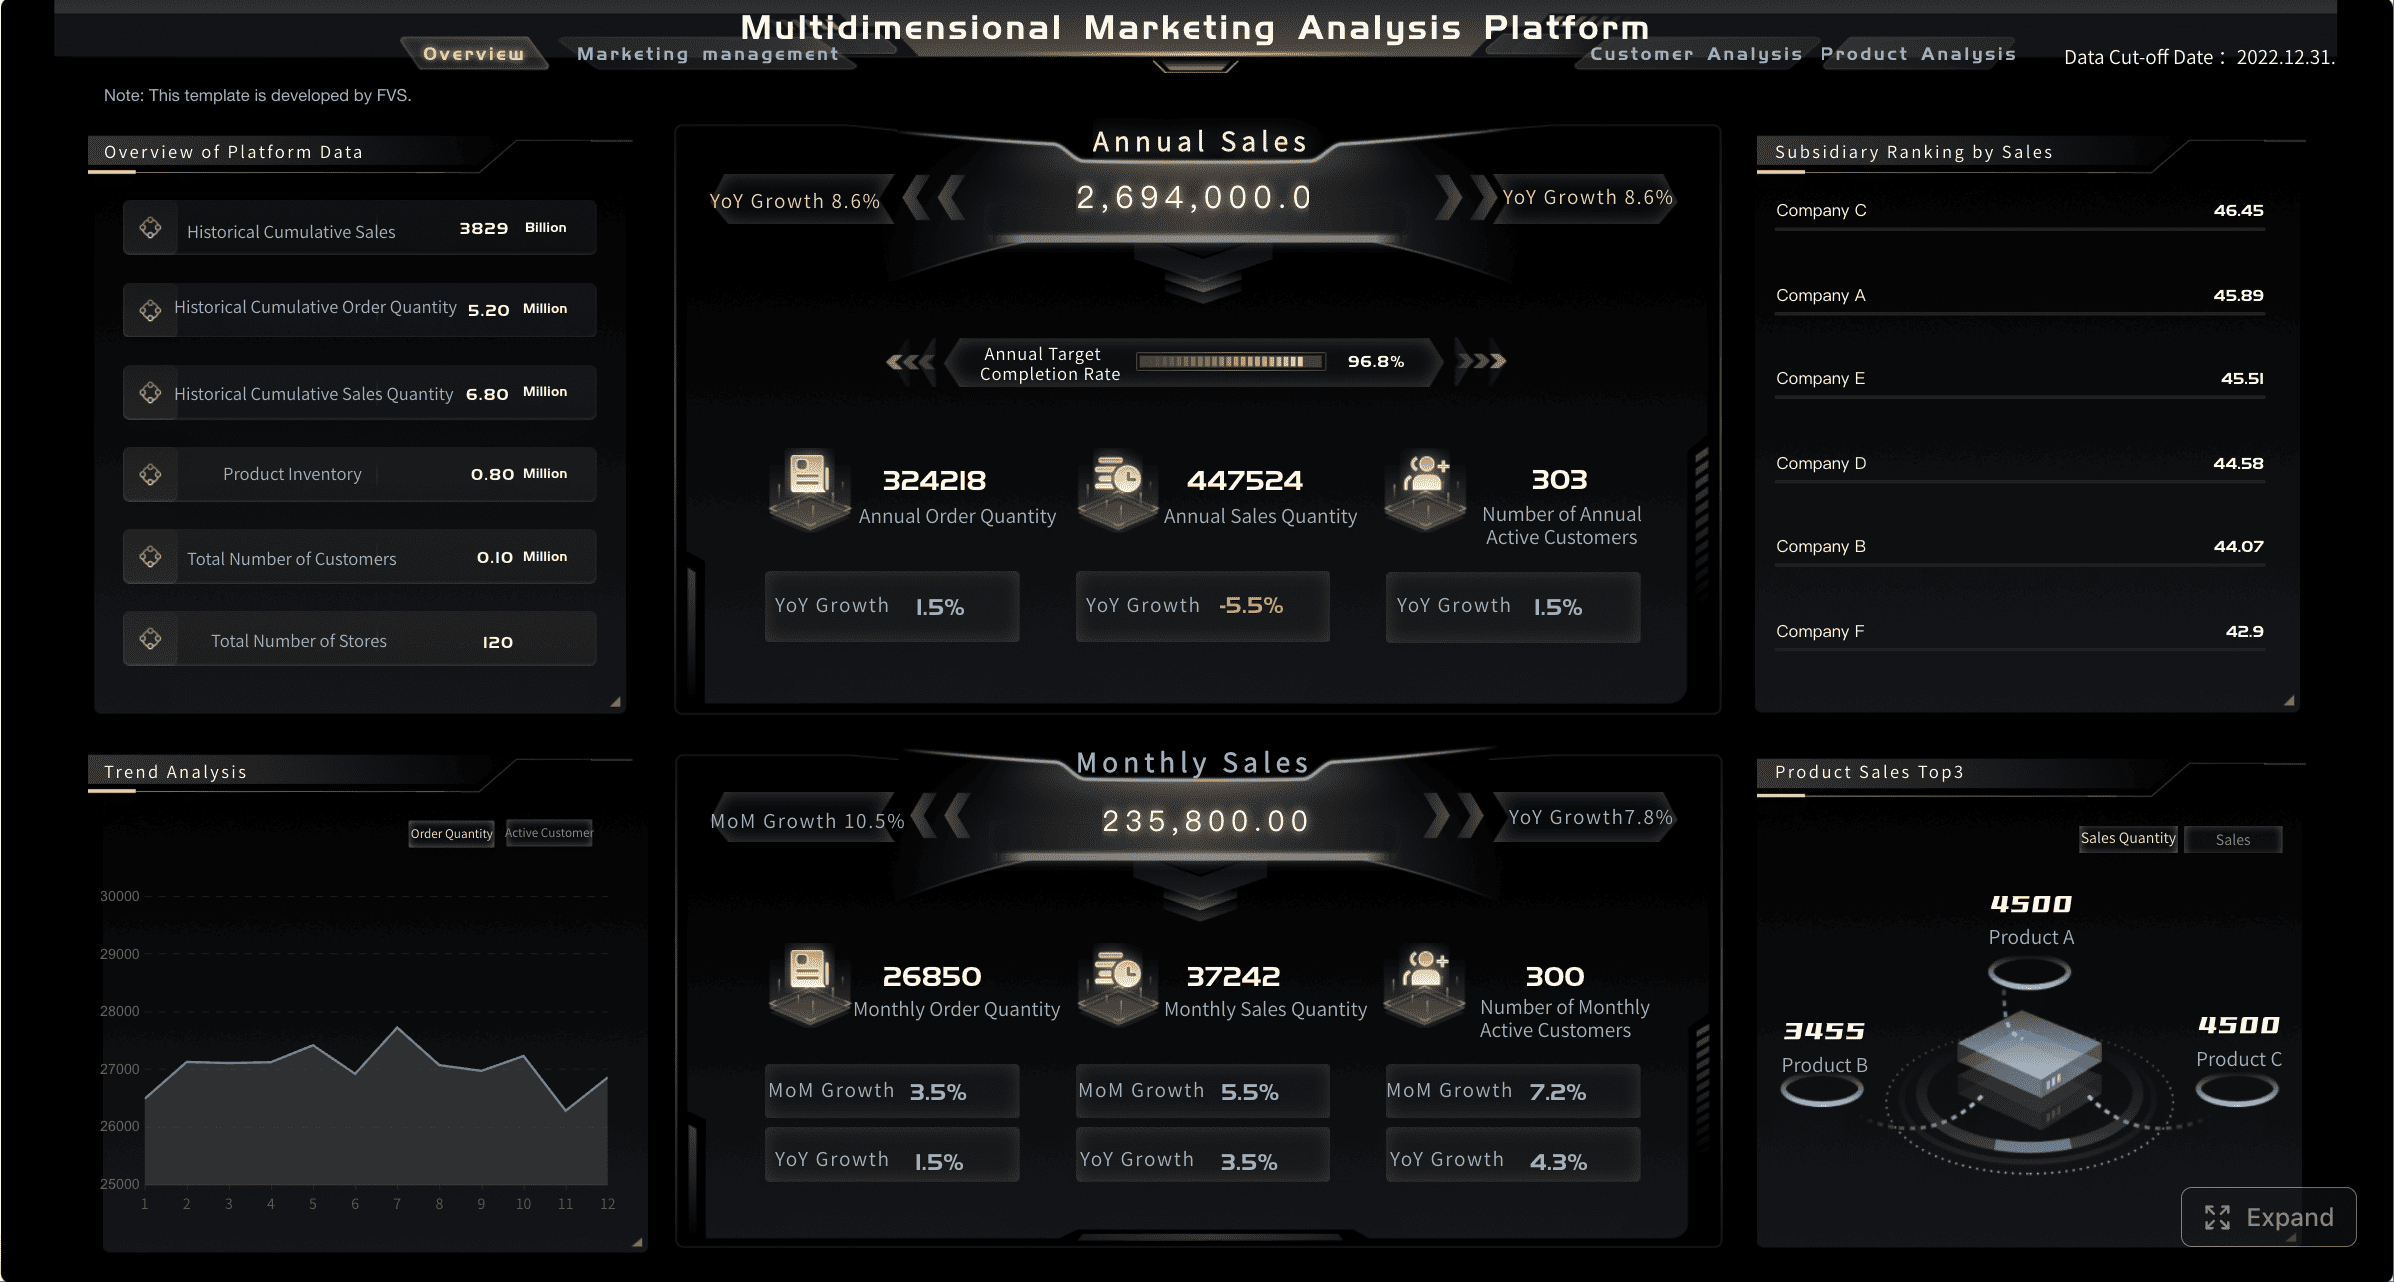
A marketing dashboard shows your marketing work in a simple way. You can use charts, tables, and maps to see your numbers. FineBI gives you lots of ways to look at your marketing data. You can filter results, link charts, and drill down for details. You can look at your marketing numbers from different sides.
You can use your marketing dashboard on any device. FineBI works on computers, tablets, and phones. You can check your marketing numbers anywhere. The dashboard loads fast, even with slow internet. You can share real-time insights with your team and decide together.
A digital marketing dashboard gives you control. You track your marketing, see real-time insights, and make smart choices every day. You can use FineBI to connect your data, automate your dashboard, and share results with your team. You improve your marketing and reach your goals faster.
You need to watch the right numbers to see your progress. A dashboard shows these numbers in one place. You can check how well your marketing works by looking at key kpis. Here are some important metrics you should know:
You can use these metrics to see if your marketing plans work. The dashboard helps you find problems and ways to fix them. You can compare your results with your goals. This helps you make better choices for your next campaign.
You often get marketing data from many places. FineBI makes it easy to bring all your data together in one dashboard. You can connect to CRMs like HubSpot or Salesforce. You can also add data from Google Analytics, Google Ads, Facebook Ads, and tools that track customer actions.
FineBI lets you mix data from these sources. You do not have to look at each platform by itself. The dashboard gives you one view of all your marketing metrics. You can see social media results, email clicks, ad spending, website visits, and CRM activities in one spot.
Here is a table that shows common data sources you can connect with FineBI:
| Data Source Type | Example Platforms |
|---|---|
| CRM | HubSpot, Salesforce |
| Analytics | Google Analytics |
| Advertising | Google Ads, Facebook Ads |
| Customer Interaction | Unbounce |
You get a clear story about your marketing. The dashboard helps you see how all your marketing activities work together. You can make faster decisions and improve your results.
You need a good tool to make your dashboard. FineBI helps you connect your marketing data fast. You can use FineBI to check your campaigns and see how they do. The dashboard works for small groups and big companies. You do not need to know how to code. You can set up your dashboard and look at your numbers right away.
You have to bring all your marketing data together. FineBI lets you connect to many places. You can add data from CRMs, spreadsheets, ad platforms, and website analytics. The dashboard updates your numbers as soon as new data comes in. You can track campaigns on different channels. You see all your results in one dashboard. This helps you spot trends and make better choices.
You can change how your dashboard looks. FineBI gives you lots of ways to change layout and visuals. You can group parts by theme and change their size. You can pick a style or make your own. You can change chart colors, table styles, and filter backgrounds. You can also set map backgrounds and add pictures with rounded corners. The table below shows some ways you can customize your dashboard:
| Customization Aspect | Description |
|---|---|
| Dashboard Layout Beautification | Group components by theme and adjust layout by resizing and repositioning. |
| Dashboard Style | Select or customize the dashboard style, including options like 'White'. |
| Tab Component Style | Modify tab component styles, including hiding titles and adjusting other visual elements. |
| Chart and Table Customization | Set color matching, text styles, and theme colors for charts and tables. |
| Other Beautification | Adjust title color, value unit format, and component size for aesthetic improvements. |
You can make your dashboard easy to read and match your brand. You can highlight important numbers and make your dashboard clear for your team.
You need to share your dashboard with your team. FineBI lets you do this easily. You can publish dashboards so everyone sees the same numbers. Your team can track campaigns together and decide faster. The dashboard shows results in real time. This helps your team plan ahead instead of just reacting. You can put all your data in one place so everyone understands. The dashboard helps your team work together and reach goals.
A marketing dashboard helps you make better choices. You see all your numbers in one spot. This lets you know what works and what does not. You do not have to guess anymore. The dashboard gives you clear answers from your data. You can find patterns and notice changes in your results. This helps you act fast and fix your campaigns. You save time because you do not make reports by hand. You can spend more time planning and trying new ideas. FineBI gives you updates right away. You can change your marketing plan when you see new trends. UnionPay Data Services used FineBI to find ways to get better. They got more customers to join and made more money.
You work better with your team when you use a marketing dashboard. FineBI gives you tools to share your work and results. You can change dashboards together and share folders. Everyone sees the same numbers and works toward the same goals. You can share what you learn and check campaigns as a group. This makes teamwork easier and helps you reach your targets.
| Feature | Description |
|---|---|
| Collaborative Editing | Many people can work on dashboards at the same time. |
| Sharing Analysis Subjects | You can share what you study with your team easily. |
| Folder Sharing | Teams can share folders to work together on marketing analysis. |
You do not waste time sending files back and forth. You see results right away and decide together. This helps your team answer fast when things change.
You can see trends as they happen with a marketing dashboard. The dashboard shows you new data from all your channels. You see what works and what needs help. You track key performance indicators and check your plans in one place. FineBI turns numbers into easy-to-read pictures. You spot trends and odd things right away. This helps you act fast when things change. You get more customers to join by changing your campaigns quickly.
You can use a marketing performance dashboard to see your data right away. This helps you act quickly when things change. FineBI is easy to set up and lets you change how your dashboard looks. It also uses automation to make things simple for you.
| Benefit | Description |
|---|---|
| Real-time insights | You get important numbers right away so you can decide faster. |
| Automation | The dashboard updates your data for you and saves you time. |
| Decision support | You can watch KPIs that help you plan and grow your business. |
FanRuan solutions help you see patterns, guess what might happen, and plan better campaigns. Try these tools to make your marketing smarter and work better.


The Author
Lewis
Senior Data Analyst at FanRuan
Related Articles

Payment Analytics Dashboard: 12 KPIs Every Operations Leader Should Track to Cut Revenue Leakage
Losing revenue to declines? Discover 12 essential KPIs to track in your payment analytics dashboard to stop leakage and manage disputes.
Lewis Chou
May 05, 2026

SOC Dashboard Explained: 12 Essential KPIs, Views, and Workflows Security Teams Use
Learn about SOC dashboards, the 12 essential KPIs for security teams, and how they centralize alerts and workflows for faster threat detection and response.
Lewis Chou
May 05, 2026

EMR Dashboard Guide: 12 Metrics to Track for Faster Clinical and Operational Decisions
Learn the 12 essential EMR dashboard metrics to track for faster clinical and operational decisions, improving patient flow and revenue cycle management.
Lewis Chou
May 05, 2026


