What is "marketing metrics dashboard"? You use it to track and visualize your marketing performance in real time. This dashboard brings together campaign data, website analytics, and customer insights so you can see exactly what’s working. For marketing teams, a marketing metrics dashboard makes data-driven decision-making possible. You face design complexity, data management issues, and collaboration challenges when building dashboards from scratch. FineReport helps you overcome these hurdles with easy data integration and flexible dashboard creation.
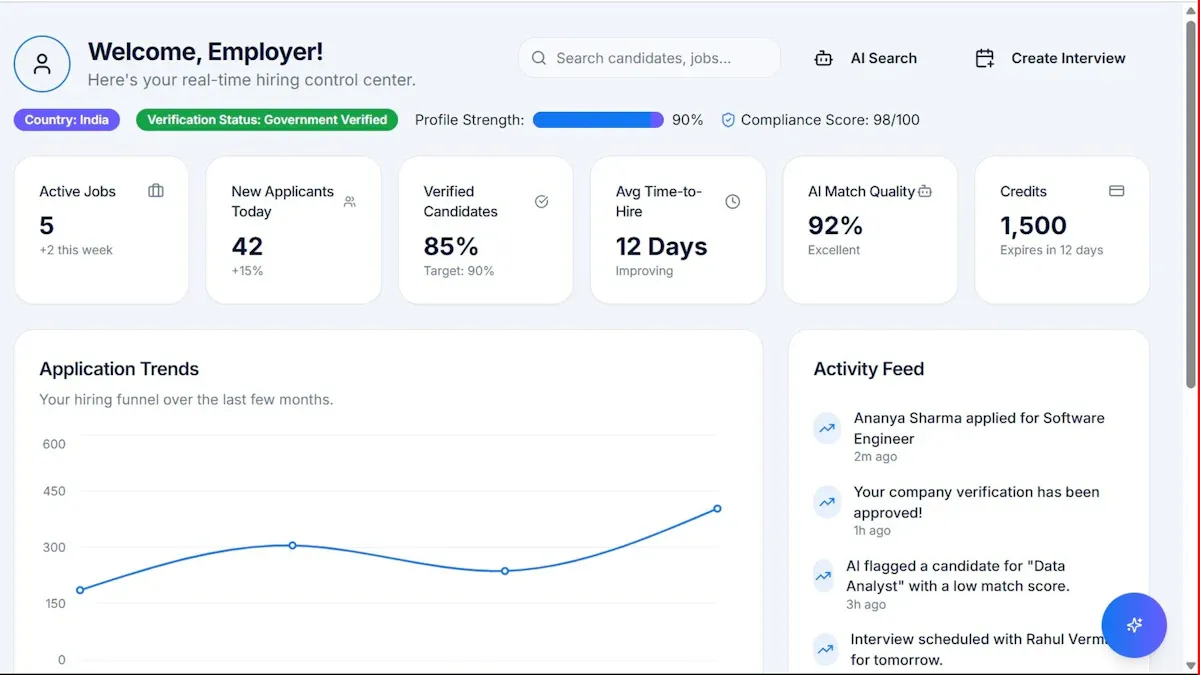
A marketing metrics dashboard gives you a clear view of your marketing performance. You see all your key metrics in one place, from conversion rates to customer acquisition costs. This dashboard helps you track campaign results, website traffic, and customer engagement. You get real-time updates, so you can spot trends and react quickly. The dashboard is user-friendly and accessible, making it easy for you and your team to interpret data and make decisions.
You need a marketing metrics dashboard to make smarter decisions. When you track metrics like conversion rate, customer acquisition cost, and return on investment, you understand what works and what needs improvement. Here’s a quick look at some important metrics you’ll find on an effective marketing dashboard:
| KPI/Metric | Description |
|---|---|
| Conversion Rate | Measures the percentage of visitors who complete a desired action. |
| Customer Acquisition Cost | The cost associated with acquiring a new customer. |
| Return on Investment (ROI) | Evaluates the profitability of marketing investments. |
With a content marketing dashboard, you combine data from different sources. You see patterns that isolated reports might miss. Dashboards encourage you to explore your marketing strategies and ask better questions. You can track web users, goal completions, and new contacts. This helps you align your marketing efforts with your business goals.
An effective marketing metrics dashboard offers several features that make your job easier:
A content marketing metrics dashboard lets you monitor brand awareness, traffic sources, and cost per action. You can measure response time, customer lifetime value, and return on ad spend. Clean and accurate data is essential. Inaccurate data can lead to poor decisions and wasted resources. When you use a content marketing dashboard, you focus on the critical priorities of your business and improve performance.
When you build a marketing campaign performance dashboard, you want to track metrics that matter most. You need to see how your campaigns perform and where your budget goes. Here are some of the most important metrics you should include:
You can also add metrics like conversion rate, engagement rate, and cost per lead to your marketing campaign performance dashboard. These metrics help you understand which campaigns drive results.
Different dashboard types help you track metrics for various marketing strategies. You might use a website traffic dashboard to monitor visitors and engagement. You can choose a dashboard that fits your needs. Here’s a quick overview:
| Dashboard Type | Purpose | Example Metrics |
|---|---|---|
| Status Dashboards | Quick checks for operational teams, monitoring activities regularly. | Active ad spend, website uptime, live campaign counts |
| Role-specific Dashboards | Tailored for specific positions, providing focused insights. | ROAS, total ad spend, cost per lead |
| Area-specific Dashboards | Focused on particular marketing channels, filtering out irrelevant data. | Registrations, attendance rate, cost per attendee |
| Entity Dashboards | Track specific campaigns or projects, monitoring detailed metrics. | Daily ad spend, CVR, revenue generated |
| Performance Analysis Dashboards | Track long-term strategic goals, analyzing historical trends. | Progress toward KPIs over time |
You can customize your marketing campaign performance dashboard to show only the metrics that matter for your team. FineReport supports multi-source data integration, so you can pull data from different platforms and create flexible dashboard layouts.
You want your marketing campaign performance dashboard to support your business objectives. Here’s how you can align your metrics with your goals:
When you collaborate with your team to identify key metrics, you create effective marketing dashboards that drive better decisions. You foster a data-driven culture and give everyone visibility into company performance. With FineReport, you can design dashboards that match your goals and help you track metrics in real time.

Creating a content marketing dashboard from scratch can feel overwhelming, but you can break it down into manageable steps. This step-by-step guide will help you build a client marketing dashboard that delivers actionable insights and supports your marketing goals. You’ll learn how to define objectives, select the right tools, integrate data, design layouts, add visualizations, automate reporting, and keep your dashboard relevant.
Before you start building a content marketing dashboard, you need to clarify your marketing objectives. You want your dashboard to reflect your business goals and measure what matters most. Here’s a simple table to help you map out your objectives:
| Step | Description |
|---|---|
| 1 | Map the relationship between marketing programs and business outcomes to clarify Marketing's role and identify key metrics. |
| 2 | Select metrics to measure Marketing's impact, efficiency, and value through dialogue with the marketing team. |
| 3 | Create a data chain linking marketing activities to business results to visualize the impact of marketing efforts. |
| 4 | Identify and secure necessary data sources to ensure measurement can be conducted effectively. |
| 5 | Develop an alpha dashboard to validate data and measurement processes, ensuring the dashboard captures relevant performance information. |
You should focus on metrics that connect your marketing activities to real business outcomes. For example, if your goal is to increase brand awareness, you might track website visits, social shares, and engagement rates. If you want to improve lead generation, you’ll monitor conversion rates and cost per lead. This approach helps you build a content marketing metrics dashboard that supports your strategy.
Once you’ve defined your objectives, you need a tool that makes dashboard creation easy and effective. FineReport stands out for its intuitive design mode and robust data connectivity. Here’s a quick comparison table to show why FineReport is a smart choice for building a client marketing dashboard:
| Feature/Benefit | Description |
|---|---|
| Intuitive design mode | Easy-to-use designer with drag-and-drop functionality for quick report creation. |
| Excellent data connectivity | One-click integrations with mainstream databases and direct JDBC connections. |
| Dedicated mobile app | A mobile app built with ReactNative for a seamless experience on mobile devices. |
| Pre-built HTML5 charts | Over 50 styles of charts with dynamic effects for effective data visualization. |
| Stream-to-TV feature | Allows tracking of KPIs on large screens and TV dashboards easily. |
FineReport lets you create custom marketing dashboards without coding. You can design interactive dashboards for different teams, from executives to specialists. The drag-and-drop designer makes it easy to add charts, tables, and filters. You can also access your content marketing dashboard on mobile devices, so you stay connected wherever you go.
A powerful content marketing dashboard pulls data from multiple sources. You want to see your campaign performance, website analytics, social media stats, and email marketing dashboard metrics all in one place. Here’s an ordered list of best practices for integrating data:
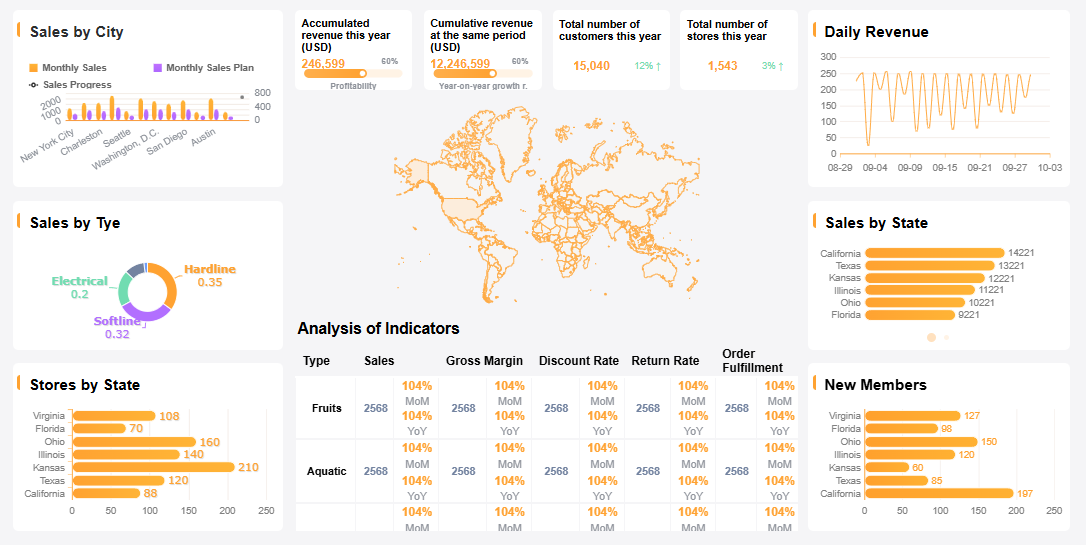
FineReport supports multi-source data integration, so you can connect to databases, spreadsheets, and cloud platforms. For example, in retail membership management, you can combine customer segmentation data, sales figures, and campaign results to create an integrated content marketing dashboard. This approach gives you a holistic view of your marketing efforts.
The layout of your content marketing dashboard affects how users engage with data. You want your dashboard to be clear, focused, and easy to navigate. Here’s a table with design tips:
| Evidence | Explanation |
|---|---|
| Limiting items on a dashboard to five to seven | Reduces clutter and noise, enhancing user focus on the intended purpose of the dashboard. |
| Asymmetrical design | Strategically places prominent elements to guide user attention to important data, improving clarity and engagement. |
| Strategic use of color | Communicates effectively by emphasizing key data points and ensuring accessibility, which keeps users engaged. |
| Use of icons | Simplifies navigation and comprehension, making the dashboard more intuitive, especially for non-technical users. |
Good dashboard design minimizes the effort required for users to interpret data. You should prioritize the most important information at the top and use a clear hierarchy to guide the viewer’s eye. For example, BOE’s experience shows that reducing cognitive load and offering a holistic status at a glance helps users understand performance and take action. You can use icons and color strategically to highlight key metrics and make navigation simple.
Visualizations bring your content marketing metrics dashboard to life. You want to use charts, graphs, and tables that make trends and patterns easy to spot. Here’s a table with popular visualization tools and their strengths:
| Dashboard Type | Key Features | Purpose |
|---|---|---|
| HubSpot | All-in-one ecosystem, user-centric design | Strategic command center for marketing performance |
| Salesforce | Comprehensive data integration, customizable views | Facilitates informed decision-making through visual storytelling |
| Google Analytics 4 | Granular insights, real-time data tracking | Helps in understanding web and app performance |
| Facebook Ads Manager | Specialized ad performance views | Focused on campaign-specific metrics for better ad management |
| Tableau | Visual storytelling capabilities | Enhances narrative of marketing performance through engaging visuals |
| Power BI | Interactive dashboards, data connectivity | Provides a dynamic view of marketing metrics for agile decision-making |
| Mailchimp | Campaign-specific focus, easy-to-read visuals | Tailored for email marketing performance tracking |
Centralized views and real-time metrics help you track performance and make quick decisions. You can filter by time period, campaign, or channel for deeper insights. Clear visuals help teams see trends and spot patterns, while well-organized dashboards reduce confusion and mistakes.
Automated reporting transforms your workflow. You can schedule reports to run automatically, saving hours each week. This frees you to focus on strategy and problem-solving. Automated reporting also minimizes human error, ensuring consistent and accurate data presentation. With FineReport, you can set up scheduled reporting for your content marketing dashboard, so your team always has the latest insights.

Your content marketing dashboard needs regular review to stay relevant. You want to validate data, audit processes, and collect feedback from users. Here’s a table with recommended processes:
| Process | Description |
|---|---|
| Data Validation | Implement checks at every step of the data pipeline to ensure reliability. |
| Conducting Regular Data Audits | Schedule consistent manual audits to identify and document recurring issues. |
| Implementing Version Control | Track changes to dashboards to maintain accuracy and facilitate troubleshooting. |
| Establishing a Review Process | Regular evaluations help keep dashboards relevant and functional as data sources change. |
| Collecting User Feedback | Create channels for users to provide feedback, such as surveys or embedded feedback buttons. |
You should update your metrics as your business goals evolve. Collect feedback from your team to improve usability and functionality. For example, in building a client dashboard for retail membership management, regular reviews help you refine customer segmentation and optimize marketing strategies. In the BOE customer story, ongoing dashboard updates led to better operational efficiency and more actionable insights.
By following this step-by-step guide, you can build a content marketing dashboard that supports your marketing objectives, delivers real-time insights, and drives better decisions. FineReport’s drag-and-drop designer, mobile dashboard features, and automated reporting make dashboard creation simple and effective. Whether you’re building a client dashboard for a retail business, a content performance dashboard for your team, or a content roi dashboard for executives, you’ll have the tools you need to succeed.
If you want to create an integrated content marketing dashboard or a content marketing analytics dashboard, start by defining your objectives, integrating your data, and designing for clarity. Use interactive dashboards to engage users and automate reporting to save time. Regularly review and update your metrics to keep your dashboard relevant. With FineReport, you can build custom marketing dashboards that scale with your business and deliver the insights you need.
When you design a marketing metrics dashboard, you want clarity and usability. Start with a clear visual hierarchy so users can find important information fast. Pick the right visualizations—bar charts work well for comparisons, line charts show trends. Limit the number of visual elements to avoid overwhelming your team. Keep things consistent with colors and interaction patterns. Simplify the design and focus on essentials. Make sure your dashboard makes data accessible and easy to use.
You might feel tempted to add every metric you can think of, but less is often more. Dashboards should answer specific marketing questions, not drown users in complex metrics. Design your dashboard around decisions you need to make. Create feedback loops to improve usability. Audit dashboard usage and remove clutter. You can also apply the one-dashboard-per-purpose rule. This keeps each dashboard focused and relevant.
Tip: Audit your tools and dashboards regularly. Cut out anything that overlaps or does not align with your marketing goals.
You need to ensure data accuracy for your marketing metrics dashboard to be effective. Data quality matters in marketing analytics. Hold regular meetings between marketing and sales teams to align on lead quality and metrics. Set clear service level agreements to define what counts as a qualified lead. These steps help you track accurate metrics and make better decisions.
Every marketing team has unique needs. Customize your dashboard for different roles and departments. FineReport makes this easy with flexible layouts and permission controls. You can scale your dashboard as your business grows. Scheduled reporting and real-time monitoring keep your metrics up to date. Continuous feedback and cross-department collaboration help you maintain and improve your dashboard over time.
| Best Practice | Description |
|---|---|
| Continuous Monitoring and Feedback | Gather user input to keep dashboards efficient and effective |
| Training and Documentation | Provide training and clear documentation for users and maintainers |
| Cross-Department Collaboration | Share best practices and align goals across teams |
| Implementing Automation | Use automation to streamline audits and updates |
By following these best practices, you build a marketing metrics dashboard that supports decision-making, avoids common pitfalls, and grows with your marketing needs.

You can build a marketing metrics dashboard by following a few clear steps. Start by defining your goals, choosing key metrics, ensuring data accuracy, and customizing the layout for your team. FineReport helps you visualize large datasets and spot patterns quickly, boosting your efficiency. Companies using AI tools like FineReport see up to 40% better data interpretation. Real-world dashboards give you instant insights into customer health and engagement. If you align your dashboard with business objectives, automate data sources, and keep it focused, you’ll create a tool that grows with your needs.
| Key Takeaway | Description |
|---|---|
| Define Goals | Set clear objectives for your dashboard. |
| Choose Key Metrics | Pick metrics that match your marketing KPIs. |
| Ensure Data Accuracy | Validate and standardize your data sources. |
| Customize Layout | Design for your users to improve clarity and usability. |
Tip: Regularly review and optimize your marketing metrics dashboard to keep it relevant and actionable.

Best Dashboard Apps for Business Insights
What is a Call Center Dashboard and Why Does It Matter
What is a Reporting Dashboard and How Does it Work
What is An Interactive Dashboard and How Does It Work
What is a Call Center Metrics Dashboard and How Does It Work

The Author
Lewis
Senior Data Analyst at FanRuan
Related Articles

Payment Analytics Dashboard: 12 KPIs Every Operations Leader Should Track to Cut Revenue Leakage
Losing revenue to declines? Discover 12 essential KPIs to track in your payment analytics dashboard to stop leakage and manage disputes.
Lewis Chou
May 05, 2026

SOC Dashboard Explained: 12 Essential KPIs, Views, and Workflows Security Teams Use
Learn about SOC dashboards, the 12 essential KPIs for security teams, and how they centralize alerts and workflows for faster threat detection and response.
Lewis Chou
May 05, 2026

EMR Dashboard Guide: 12 Metrics to Track for Faster Clinical and Operational Decisions
Learn the 12 essential EMR dashboard metrics to track for faster clinical and operational decisions, improving patient flow and revenue cycle management.
Lewis Chou
May 05, 2026


