What is an HR analytics dashboard? An HR analytics dashboard is a digital tool that lets you view, analyze, and track key HR metrics in one place. You use it to monitor your workforce data, spot trends, and measure the impact of HR initiatives.
With an hr analytics dashboard, you make informed decisions that improve talent management and employee satisfaction. The growing availability of HR data means you can move beyond guesswork. Studies show that organizations using workforce analytics see higher employee engagement, lower turnover, and increased profitability. You can proactively manage your talent pipeline and design effective retention strategies by relying on data-driven insights.
HR Analytics Dashboard Overview
What is an HR Analytics Dashboard
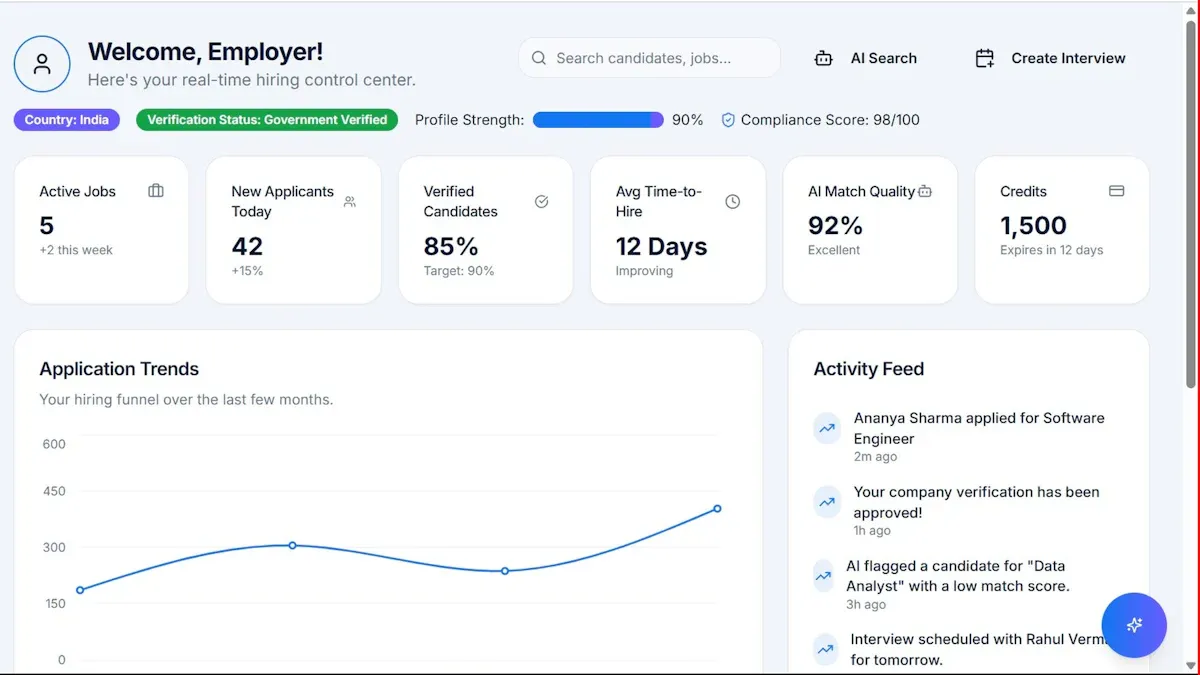
You use an HR analytics dashboard as a management tool that brings together all your HR-related information, reports, and key performance indicators in one place. This dashboard helps you visualize and summarize complex workforce data, making it easier to track and analyze metrics across different HR initiatives and departments. When you use an HR dashboard, you can monitor the proper functioning of your HR services and manage them more effectively. This tool plays a crucial role in operations management and team evaluation. You can see at a glance whether your HR services are running smoothly and whether your teams are meeting performance expectations. The HR dashboard acts as a set of indicators that help you verify the effective operation of your HR services, which is essential for managing and evaluating team performance.
Key Features and Benefits for HR
You gain several important features when you use a leading HR analytics dashboard. These features help you work more efficiently and make better decisions. The table below summarizes the primary features you will find in top HR dashboards:
| Feature | Description |
|---|---|
| Fully Interactive | Drill down into data and create custom views for quick identification of improvement areas. |
| Integrates All Data Sources | Combine all HR data sources into one platform for seamless access across departments. |
| Can Use Augmented Analytics | Automate complex analytics and identify trends using real-time data. |
| Automated Alerts and Reporting | Receive notifications for important events and generate customized reports. |
| Customizable Reports | Tailor reports to focus on metrics like turnover or recruiting costs. |
| Omni-device Functionalities | Access dashboards on mobile devices for flexibility and usability. |
| Flexible Sharing Options | Share reports and data easily among team members for better collaboration. |
| Real-time Messaging Capability | Communicate securely between managers and employees, which is helpful for remote teams. |
When you use an HR dashboard with these features, you can expect measurable benefits. Organizations report better talent decisions because you can identify hiring trends, skill gaps, and the best sources of talent. You also see improvements in employee retention, as analytics reveal patterns behind attrition, engagement, and satisfaction. HR metrics help you track productivity, training outcomes, and team efficiency, which leads to performance optimization. You can predict future workforce needs and align your people strategy with business goals, supporting strategic workforce planning. Cost efficiency improves because you eliminate guesswork and make smarter investments in people and technology.
You also move from reactive to proactive decision-making. The HR analytics dashboard gives you insights into which employee benefits deliver measurable value. You can connect costs to outcomes like retention, well-being, and trust. This approach helps you focus your resources where they have the greatest impact.
How HR Dashboards Support Decision-making
You rely on an HR analytics dashboard to enhance the quality and speed of your HR decision-making. The dashboard provides real-time insights and visualizations of complex HR data. You can quickly identify trends and issues without reading through multiple reports. This speed allows you to take proactive steps that improve organizational performance.
Different types of HR dashboards serve different audiences and answer key questions. The table below shows how each dashboard type supports decision-making at various levels:
| Dashboard Type | Primary Audience | Key Questions Answered | Example Metrics Tracked | Value Proposition for Leadership |
|---|---|---|---|---|
| Operational | HR Staff, Department Managers | Are our current processes running smoothly? | Time-to-fill, current headcount, active benefits enrollment | Improves daily efficiency and shows immediate work bottlenecks. |
| Tactical | Middle Management, HR Specialists | How are specific programs or initiatives performing? | Training completion rates, employee satisfaction by department, source-of-hire effectiveness | Tracks the success of focused HR programs and helps justify investments. |
| Strategic | Executives, C-Suite, Board | Is the workforce structure supporting long-term goals? | Voluntary turnover rate, human capital ROI, internal mobility rate, diversity metrics | Drives long-range planning and links people strategy to business results. |
You use the HR analytics dashboard to make decisions at every level. Operational dashboards help you improve daily efficiency and spot bottlenecks. Tactical dashboards let you track the success of HR programs and justify investments. Strategic dashboards support long-term planning and connect your people strategy to financial and market performance.
The HR analytics dashboard gives you the tools to act quickly and confidently. You no longer need to wait for manual reports or guess about workforce trends. Instead, you have a clear, visual summary of your HR data that supports better decisions and stronger outcomes.
How an HR Analytics Dashboard Works
Data Integration and Processing in HR Dashboards
You start building an HR analytics dashboard by bringing together data from many sources. This step is called data integration. You might collect information from recruiting systems, employee records, performance management tools, and payroll software. You also include data from learning management, compensation and benefits, succession planning, and even employee surveys. Sometimes, you add business data from finance or sales to connect workforce trends to company outcomes.
You need to process this data to ensure accuracy and reliability. You follow best practices to protect sensitive information and comply with regulations. You clean and organize the data, removing errors and duplicates. You segment the data into categories like department, job role, or location. This helps you uncover hidden trends and disparities. You set up a regular reporting schedule so your HR analytics dashboard always shows the latest information. You enable self-service reporting so managers and HR staff can access real-time data without waiting for IT support.
Tip: Always use visualizations to make complex data easier to understand. This helps everyone on your team see patterns and make better decisions.

Visualization and Real-time Analysis
You use your HR analytics dashboard to turn raw data into clear, engaging visuals. You choose the right chart or graph for each metric. For example, you might use a bar chart to compare turnover rates by department or a line graph to track employee engagement over time. You keep your dashboard simple and focused, avoiding clutter. You tell a story with your visuals, showing not just what is happening but why it matters.
Real-time analysis is a key advantage of a modern HR analytics dashboard. You see up-to-the-minute insights into your workforce. This means you can spot early warning signs, such as rising absenteeism or declining performance, and act before problems grow. Organizations that use real-time dashboards can reduce employee turnover by up to 40%. You also make your dashboard interactive, allowing users to filter data, drill down into details, and explore different scenarios. This makes your HR analytics dashboard useful for everyone, from HR staff to executives.

Role of FineBI in HR Analytics Dashboards
You can use FineBI to power your HR analytics dashboard with advanced features and a user-friendly experience. FineBI connects to all your HR data sources, including databases, spreadsheets, and cloud platforms. You can integrate data from recruiting, performance management, compensation, and even external sources like industry benchmarks.
FineBI gives you self-service analytics. You build dashboards and analyze data without needing technical skills. The drag-and-drop interface lets you create charts and tables quickly. You can sort, filter, and modify data fields to match your needs. FineBI supports enhanced data processing, so you can clean and organize your data for accurate reporting.
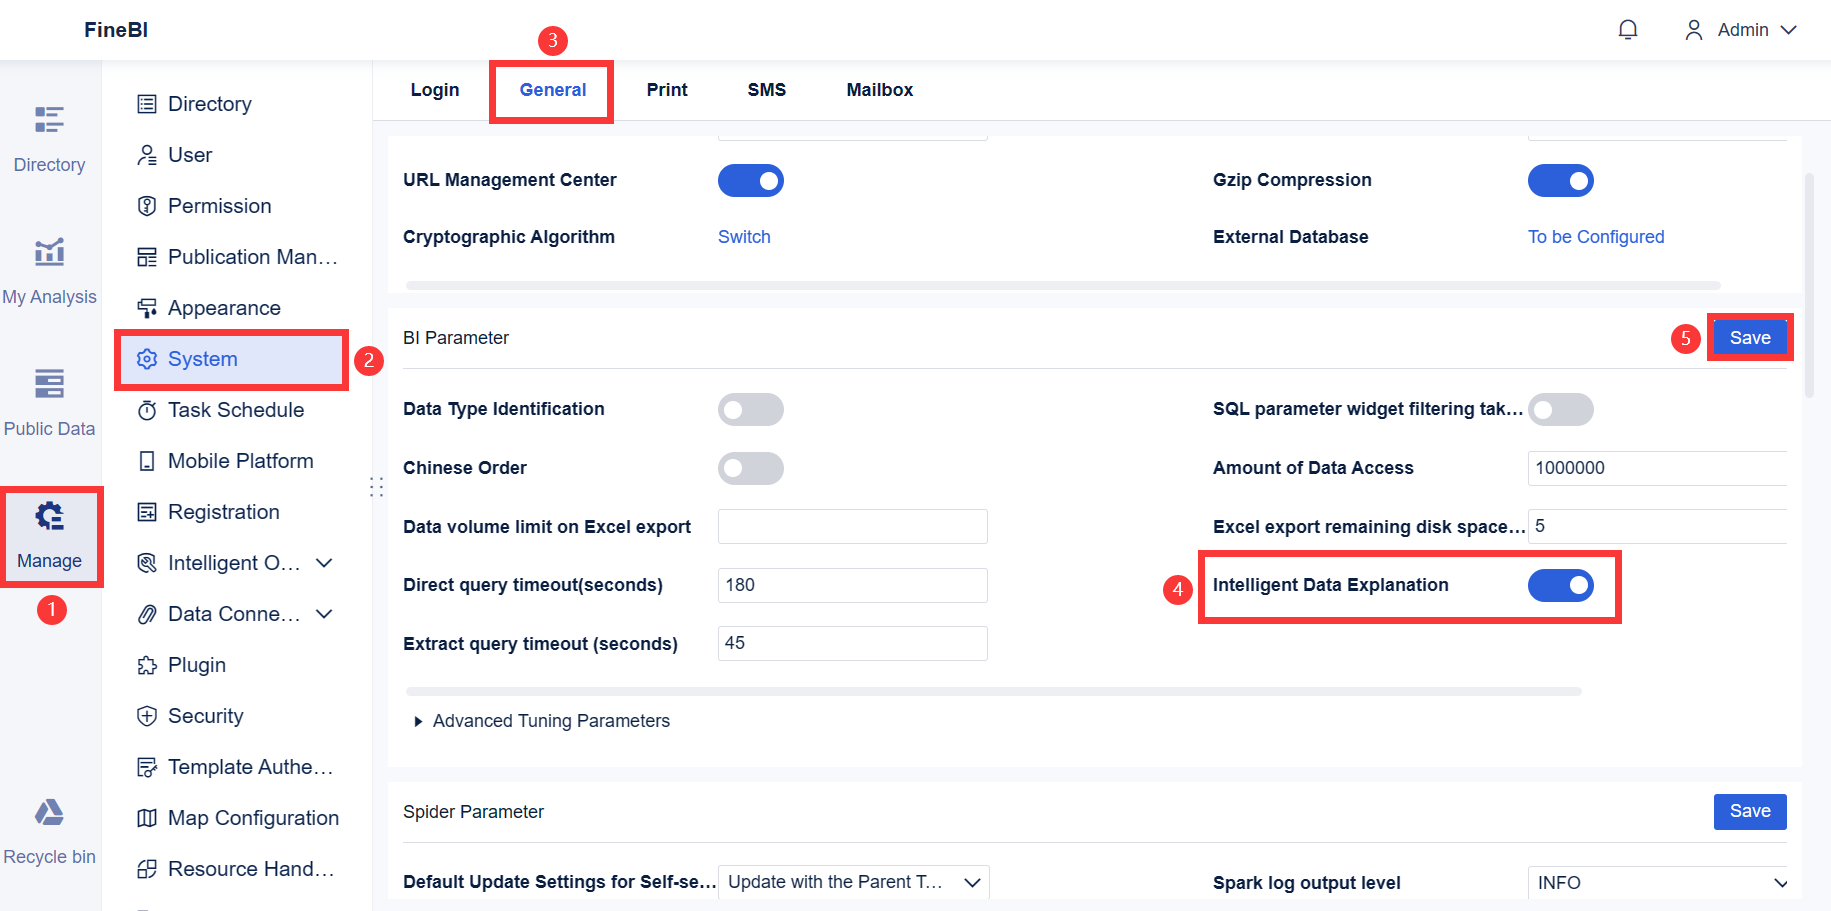
You also benefit from real-time data monitoring. FineBI lets you set up alerts for abnormal data, such as sudden drops in engagement or spikes in turnover. You receive notifications by email, so you can respond fast. FineBI’s collaborative features allow your HR team to share dashboards, discuss insights, and make decisions together. This approach helps you improve performance, optimize talent management, and align your HR strategy with business goals.
Note: FineBI’s integration with FineDataLink supports advanced ETL and ELT processes, making data synchronization efficient and reliable for your HR analytics dashboard.
By using FineBI, you transform your HR analytics dashboard into a powerful tool for data-driven decision-making. You gain clear insights, improve performance tracking, and support your organization’s growth.
Essential HR Analytics Dashboard Metrics
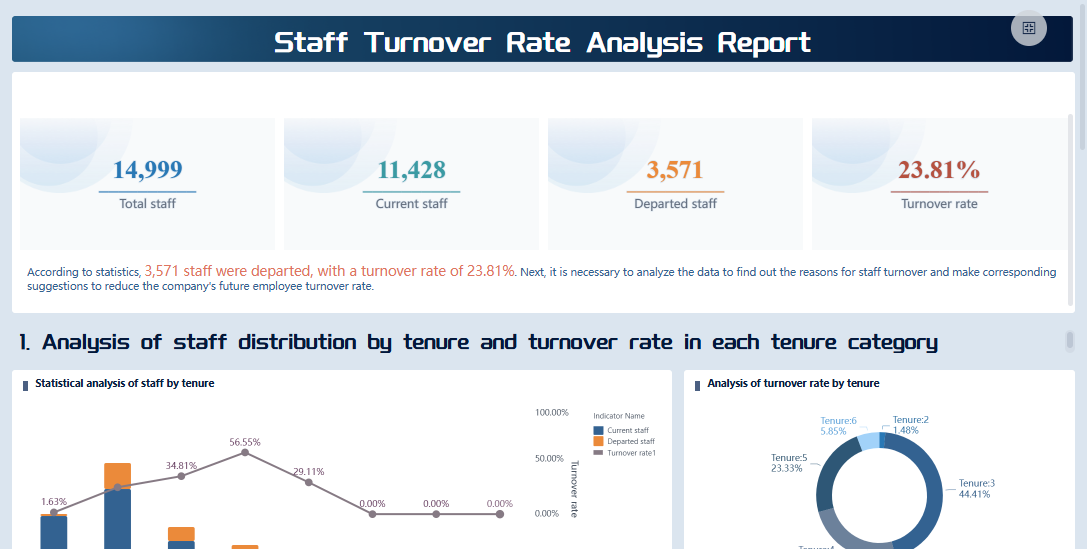
Turnover Rate and Retention
You need to track turnover and retention metrics in your HR analytics dashboard to understand workforce stability. High turnover can signal problems with job satisfaction or management. In the retail industry, the average turnover rate is about 37%. For all U.S. companies, the average is around 22%. Retailers with rates near 30% perform better than most competitors. Your HR analytics dashboard should include these key metrics:
| Metric | Description |
|---|---|
| Overall Retention Rate | Percentage of employees staying with the company over time. |
| Overall Turnover Rate | Percentage of employees who leave during a set period. |
| Voluntary Turnover Rate | Percentage who leave by choice, often due to dissatisfaction. |
| Involuntary Turnover Rate | Percentage terminated or laid off, which may show management or training issues. |
| Employee Satisfaction | Measures contentment and engagement, affecting retention. |
| Average Employee Tenure | Average time employees stay, showing stability. |
| Cost of Employee Turnover | Financial impact of losing employees, guiding retention strategies. |
Tracking these metrics in your HR analytics dashboard helps you spot trends and take action to improve retention.
Employee Demographics and Diversity
Your HR analytics dashboard should display workforce demographics and diversity metrics. These metrics help you build a fair and inclusive workplace. Common metrics include:
| Metric | Description |
|---|---|
| Gender Representation | Tracks the visibility of different genders in the workforce. |
| Ethnic Diversity | Measures the presence of various ethnic groups. |
| Pay Equity | Compares salaries across demographics for fairness. |
| Retention Rates | Monitors retention among diverse groups. |
You can also track the ethnic diversity ratio, gender ratio, and the number of people from minority groups. When you use your HR analytics dashboard to monitor these metrics, you can identify gaps in hiring and retention. This leads to a more equitable environment and higher employee satisfaction. Companies like Delta Airlines saw a 12% rise in satisfaction and a 15% boost in customer loyalty after focusing on diversity.
Cost Per Hire and Recruitment Metrics
You use your HR analytics dashboard to measure the cost and efficiency of hiring. The average cost per hire is $4,700 across all industries. In tech, it ranges from $6,000 to $8,000. Healthcare sees costs from $9,000 to $12,000. Your dashboard should track:
| Metric | Description |
|---|---|
| Time-to-hire | Measures days from job posting to hiring. |
| Offer acceptance | Tracks the percentage of accepted job offers. |
| Applicant drop-off | Shows how many candidates leave the process early. |
These metrics help you improve your recruitment process and control costs.
Engagement, Performance, and Other HR KPIs
Your HR analytics dashboard should include engagement and performance metrics. Key KPIs are:
| KPI Name | Description |
|---|---|
| Employee Net Promoter Score | Measures how likely employees are to recommend your company. |
| Employee Turnover Rate | Tracks the percentage of employees who leave. |
| Absenteeism Rate | Monitors unplanned absences, which may signal low morale. |
| Employee Satisfaction Index | Gauges how satisfied employees are with their roles and workplace. |
You can also track career advancement, promotions, salary increases, and complaints. Engaged employees show higher productivity, better teamwork, and lower absenteeism. Your HR analytics dashboard gives you the insights you need to connect these metrics to business outcomes.
Building an HR Analytics Dashboard With FineBI
Setting Goals and Selecting HR Metrics
You begin building your HR analytics dashboard by setting clear goals and choosing the right HR metrics. Start by identifying what questions you want your dashboard to answer. Focus on decisions that matter for your organization, such as improving employee retention or tracking performance. Use a table to compare criteria for selecting HR metrics:
| Criteria for HR Dashboards | Description |
|---|---|
| Data Sources | Pull data from payroll, recruiting tools, and HRIS. |
| Usability | Make the dashboard easy to use and share. |
| Interactivity | Allow users to analyze and collaborate. |
| Mobile Friendly | Access HR data from mobile devices. |
| Augmented Analytics | Alert users about negative trends. |
| Essential Metrics | Include employee count, turnover rate, and engagement data. |
Connecting Data Sources and Preparing Data
You connect your HR dashboard to all relevant HR data sources. Common challenges include inconsistent data quality, siloed systems, and limited integration. FineBI helps you overcome these issues by supporting connections to databases, spreadsheets, and cloud platforms. Prepare your data by following these steps:
- Identify HR metrics that align with your goals, such as recruitment and retention.
- Collaborate with stakeholders to set objectives for your dashboard.
- Ensure accurate data collection and integration for real-time insights.
- Focus on effective visualization and layout for better accessibility.
Designing and Customizing the HR Dashboard
You design your HR analytics dashboard by choosing the right visualizations for each metric. Start with the questions you want to answer, not just the available data. Use strategic color coding and layout to make the dashboard easy to read. Provide context and benchmarks to help users understand trends. Customization lets HR teams personalize views based on roles, so each member sees only the most relevant information. Tailored dashboards deliver real-time analytics for functions like hiring and performance management.
| Design Principle | Description |
|---|---|
| Start with Questions | Focus on decisions, not just metrics. |
| Choose Visualization | Use charts and graphs that fit each metric. |
| Strategic Layout | Organize with color and space for usability. |
| Provide Context | Add benchmarks and historical trends. |
Reviewing, Sharing, and Maintaining Dashboards
You review your HR dashboard regularly to ensure it meets your needs. Tailor dashboards for different audiences and topics to minimize clutter. Track changes over time and respond to trends, not just minor fluctuations. FineBI makes sharing easy with secure publishing and role-based access. Collaborate with your HR team to discuss insights and update dashboards as your organization evolves. Maintain your HR analytics dashboard by auditing usage and keeping data sources up to date.
Tip: Regularly review your dashboard and update HR metrics to reflect changing business priorities.
Real-world Examples and Impact of HR Analytics Dashboard
Case Study: BOE’s HR Dashboard Transformation
You can see the power of an HR analytics dashboard in action by looking at BOE Technology Group. BOE faced challenges with fragmented data and inconsistent metric definitions across departments. You might experience similar issues if your HR data lives in separate systems or spreadsheets. BOE used FineBI to build a unified HR analytics dashboard. This dashboard integrated data from recruiting, employee records, and performance management. You can follow BOE’s approach to standardize metrics and automate reporting. After implementing FineBI, BOE reduced inventory costs by 5% and increased operational efficiency by 50%. The HR analytics dashboard enabled real-time monitoring of KPIs and cross-factory benchmarking. You can use these features to identify risks early and compare performance across teams. BOE’s transformation shows how a modern HR analytics dashboard supports digital growth and better decision-making.
Business Value of HR Analytics Dashboards
You realize significant business value when you use an HR analytics dashboard. You gain actionable insights that improve employee wellbeing and talent retention. Organizations like Stockport NHS and Trust (mii People) use HR analytics dashboards to monitor employee health and reduce reliance on temporary staff. You can empower leaders to make informed decisions and enhance operational efficiency. Merck KGaA gave 3,500 users access to data dashboards, which helped leaders act quickly and improve performance. The table below summarizes the business value realized by organizations using HR analytics dashboards:
| Organization | Business Value Realized | Evidence |
|---|---|---|
| Stockport NHS | Improved employee wellbeing, strengthened talent retention | Actionable insights led to smarter, faster decisions, reducing reliance on temporary staff. |
| Merck KGaA | Enhanced decision-making and operational efficiency | 3,500 users gained access to data dashboards, empowering leaders to make informed decisions. |
| Trust (mii People) | Better talent retention, improved employee wellbeing | Real-time visibility into data allowed for monitoring of sickness absence and early signs of stress. |
You can use an HR analytics dashboard to track key metrics, spot trends, and support strategic HR initiatives. This approach helps you optimize talent management, improve employee satisfaction, and drive business results.
You need an HR analytics dashboard to drive your HR strategy forward. This tool helps you track HR metrics, spot trends, and make better decisions. When you use FineBI, you gain access to real-time HR data and data-driven insights. You can improve HR processes, boost employee satisfaction, and support business growth. Start building or optimizing your HR analytics dashboard today to unlock the full value of your HR data.

Continue Reading About HR Analytics Dashboard
Best Dashboard Apps for Business Insights
What is a Call Center Dashboard and Why Does It Matter
What is a Reporting Dashboard and How Does it Work
What is An Interactive Dashboard and How Does It Work
What is a Call Center Metrics Dashboard and How Does It Work


FAQ

The Author
Lewis
Senior Data Analyst at FanRuan
Related Articles

How to Build an Investment Portfolio Reporting Dashboard for Executives: KPIs, Benchmarks, and Drill-Down Views
Investment portfolio reporting for executives is not about showing every holding, transaction, and chart your investment team can produce. It is about giving CEOs, CFOs, CIOs, boards, and investment committees a fast, re
Yida YIn
Jun 25, 2026

12 KPI Reporting Examples for Executive Dashboards: What to Show in Weekly, Monthly, and Quarterly Reviews
Executive leaders do not need more data. They need decision ready $1 examples that match how often they review the business and what actions they are expected to take. A weekly $1 should surface fast moving risks and per
Yida YIn
Jun 25, 2026

How to Build a Digital Marketing Reports Dashboard: Executive Examples, KPIs, and Templates
A $1 is the control layer that helps executives and marketing leaders turn scattered channel data into fast, confident decisions. If you are a CEO, CMO, operations director, or marketing analytics lead, the real problem
Yida Yin
May 07, 2026