What is a sales pipeline dashboard? A sales pipeline dashboard is a sales management tool that visualizes every stage of your sales process, from lead generation to deal closure. You use it to track key pipeline metrics, monitor team performance, and identify sales opportunities.
Sales teams need real-time visibility to make informed decisions and drive revenue. When you analyze sales data instantly, you spot trends and adjust strategies before competitors react.
Real-time competitive intelligence allows sales teams to anticipate industry shifts, such as trends towards sustainability, enabling them to adjust their strategies proactively and maintain a competitive edge.
Tracking sales pipeline metrics improves your ability to set targets, measure progress, and boost results. The table below shows essential metrics that high-performing organizations monitor:
| Metric | Description | Importance |
|---|---|---|
| Pipeline Velocity | Measures how quickly opportunities move through the funnel to generate revenue. | Reflects the efficiency of the sales process and indicates potential bottlenecks in the pipeline. |
| Pipeline Coverage Ratio | Ratio of total pipeline value to sales target. | Ensures there are enough deals to meet revenue targets, indicating healthy pipeline management. |
| Win Rate by Stage | Percentage of opportunities won at each stage of the pipeline. | Provides insight into where deals drop off, guiding coaching and performance improvement efforts. |
| Average Deal Size | Average monetary value of closed-won deals. | Helps determine the number of deals needed to meet revenue targets, influencing sales strategy. |
FineReport helps you build interactive sales pipeline dashboards, giving you control and insight for effective sales management.
Sales Pipeline Dashboard Overview
What Is a Sales Pipeline Dashboard
What is a sales pipeline dashboard? A sales pipeline dashboard is a visual management tool that tracks every stage of your sales pipeline, from initial prospecting to closing deals. You use it to monitor sales activities, analyze conversion rates, and assess team performance in real time. The dashboard transforms complex sales data into actionable insights, helping you make faster and smarter decisions.
You rely on a sales pipeline dashboard to see the entire sales process at a glance. The dashboard acts as a command center, giving you instant access to key metrics such as opportunity status, win rates, and forecasted revenue. You can identify bottlenecks, spot trends, and adjust your sales strategy based on real-time data. Leading sales management experts describe the sales pipeline dashboard as a tool that visually represents the stages customers go through before becoming clients. It provides a consolidated view of sales opportunities, conversion rates, and key performance indicators.
A sales pipeline dashboard helps you optimize sales strategies for consistent growth by highlighting team performance and translating data into meaningful signals for coaching and improvement.
The primary functions of a sales pipeline dashboard include real-time visibility, performance tracking, and data-driven decision making. You use the dashboard to assess pipeline health, analyze buyer engagement, and forecast revenue. The table below summarizes these core functions:
| Function | Description |
|---|---|
| Real-time visibility | Provides insights into current sales activities and performance metrics. |
| Performance tracking | Monitors sales team performance and identifies areas for improvement. |
| Data-driven decision making | Supports informed decisions based on consolidated data and analytics. |
| Pipeline health tracking | Allows leaders to assess the status of sales opportunities and prioritize actions accordingly. |
| Buyer engagement analysis | Connects buyer interactions with sales activities to enhance follow-up strategies. |
| Actionable insights | Translates data into meaningful signals for coaching and strategy adjustments. |
| Forecasting revenue | Helps predict potential revenue based on current pipeline data and deal likelihood. |
Key Stages in the Sales Pipeline
You manage your sales pipeline by guiding leads through several distinct stages. Each stage represents a critical step in the sales process, and understanding these stages helps you improve conversion rates and forecast revenue more accurately. The typical stages found in a sales pipeline across industries include:
| Stage | Description |
|---|---|
| Prospecting | Identify potential leads through research, networking, or marketing channels. |
| Lead Qualification | Determine if the lead meets your criteria (budget, need, authority). |
| Needs Analysis | Understand the lead’s specific challenges and goals. |
| Proposal/Demo | Present your product or service as a tailored solution. |
| Negotiation | Address objections, refine terms, and work toward agreement. |
| Closing | Finalize the deal—contracts signed or payment secured. |
| Post-Sale | Onboard the customer and nurture for upsells or referrals. |
You track conversion rates between each stage to identify where your sales pipeline loses momentum. For example, the most significant drop-off often occurs when moving leads from marketing-qualified to sales-qualified. Understanding these transition rates allows you to focus your efforts on the stages that need improvement. The table below shows average conversion rates for each stage in B2B sales pipelines:
| Pipeline Stage | Average Conversion Rate | MarketJoy Benchmark |
|---|---|---|
| Lead → MQL | 20–25% | 22% |
| MQL → SQL | 12–18% | 15% |
| SQL → Opportunity | 10–12% | 11% |
| Opportunity → Closed-Won | 6–9% | 7% |
You use these benchmarks to set realistic targets and measure your sales team's effectiveness at each stage.
FineReport’s Role in Sales Dashboards
FineReport empowers you to build interactive sales pipeline dashboards that integrate data from multiple sources. You can connect to various databases, spreadsheets, and external systems, consolidating all your sales data in one place. FineReport offers a user-friendly interface that simplifies dashboard creation, allowing you to visualize sales pipeline metrics with dynamic charts, tables, and maps.
You benefit from FineReport’s robust data integration capabilities. The platform supports exporting reports in Excel, PNG, and PDF formats with a single click. You can enter sales data directly into your database using online forms, ensuring accuracy and consistency. FineReport provides a wide range of visualization tools, including 2D and 3D HTML5 charts and GIS maps with engaging animations. You can access your sales pipeline dashboard on any device—PC, mobile, or big screen—making it easy to stay informed wherever you are.
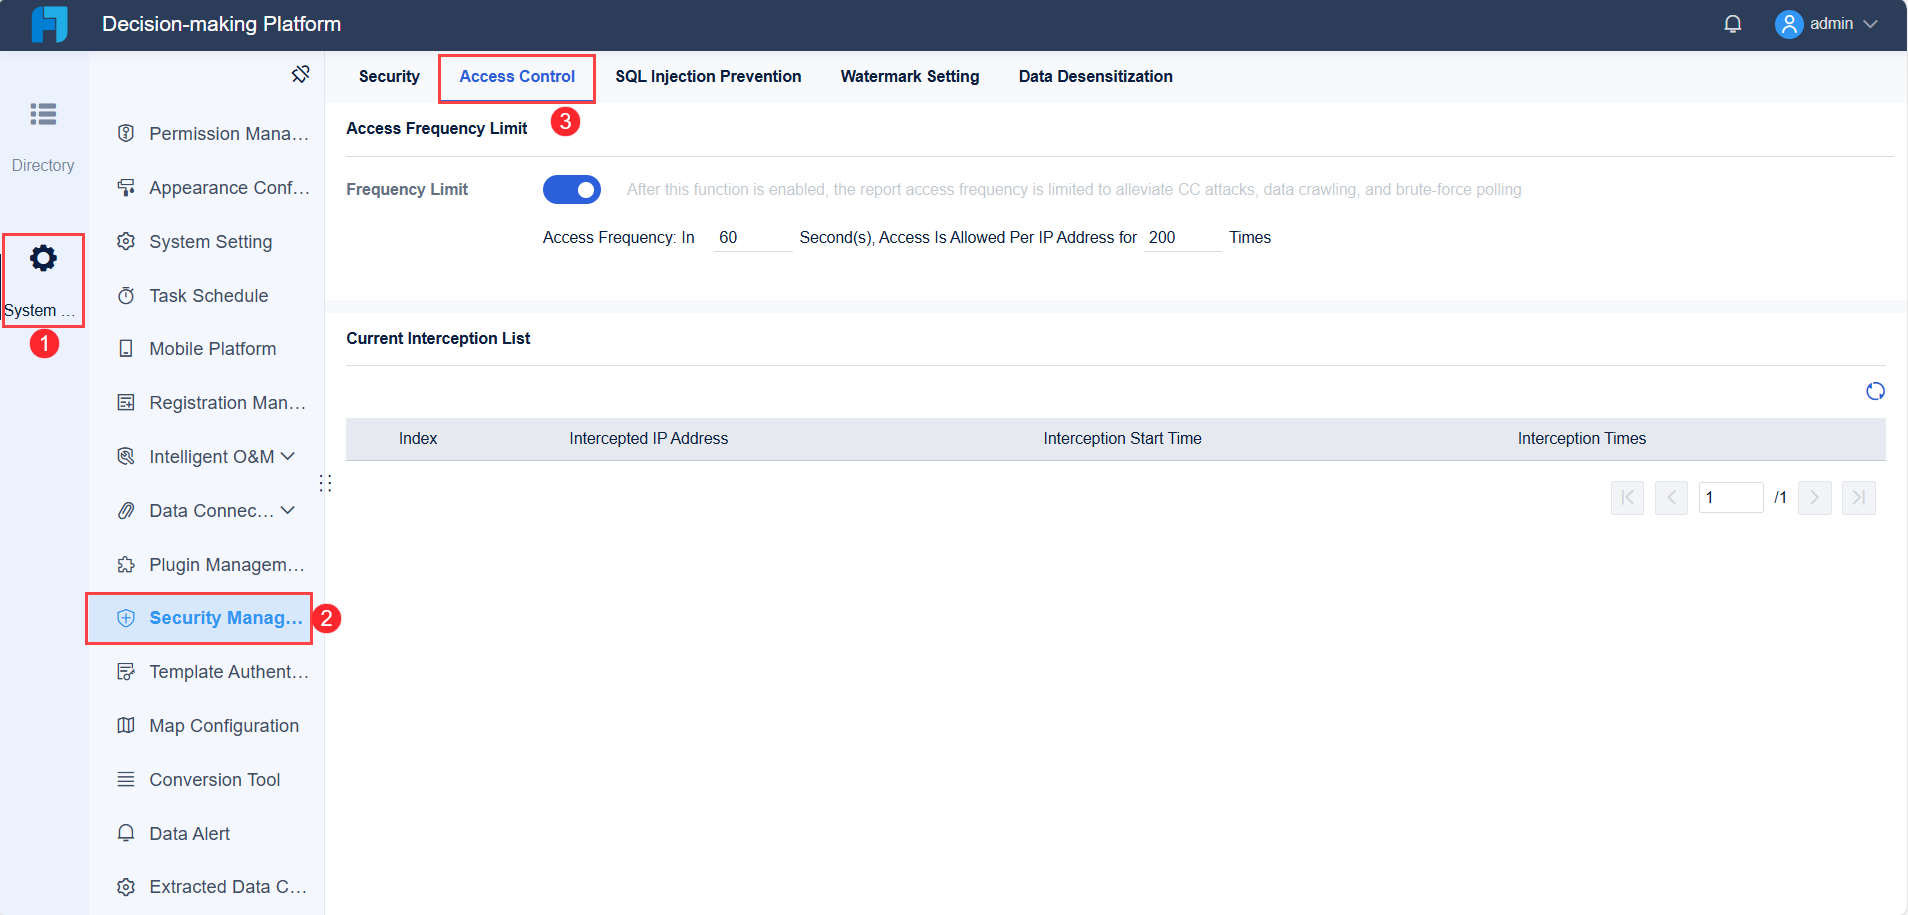
FineReport also enhances security and user management. You control access to sales data with group permission settings, ensuring that only authorized users can view or edit sensitive information. The decision-making platform allows you to assign permissions at multiple levels, supporting collaboration across departments while maintaining data integrity.
Compared to other BI tools, FineReport stands out for its intuitive design and ease of use. You can quickly create interactive dashboards without extensive training, enabling your team to analyze sales pipeline data, track key performance indicators, and review overall performance efficiently. FineReport adapts to your business needs, offering customization and expansion options that support your growth.
You integrate FineReport with your existing CRM systems to enhance data interaction and ensure real-time updates. Role-based dashboards focus on relevant metrics for each team member, improving efficiency and decision-making. AI technology automates data entry, reducing manual tasks and increasing accuracy. Modern forecasting tools provide insights into deal likelihood and team performance, helping you stay ahead in a competitive market.
A sales pipeline dashboard built with FineReport gives you the visibility, control, and flexibility needed to manage your sales pipeline effectively. You can optimize your sales process, improve conversion rates, and drive consistent growth by leveraging real-time data and actionable insights.
Empowering Sales Teams with Sales Pipeline Dashboard
Real-Time Sales Tracking
You need to know what happens in your sales pipeline at every moment. Real-time sales tracking gives you instant access to the status of leads, deals, and opportunities. This visibility helps you respond quickly to changes in the market and customer behavior. When you use a sales pipeline dashboard, you can monitor every stage of the sales process and see which leads move forward or stall.
A sales pipeline dashboard reduces the time you spend analyzing data and helps you identify new opportunities faster. The following table shows how real-time tracking improves sales team responsiveness:
| Metric | Improvement Percentage |
|---|---|
| Reduction in analysis time | 78% |
| Identification of opportunities | 67% faster |
| Faster market adaptation | 31% |
| Improvement in competitive win rates | 29% |
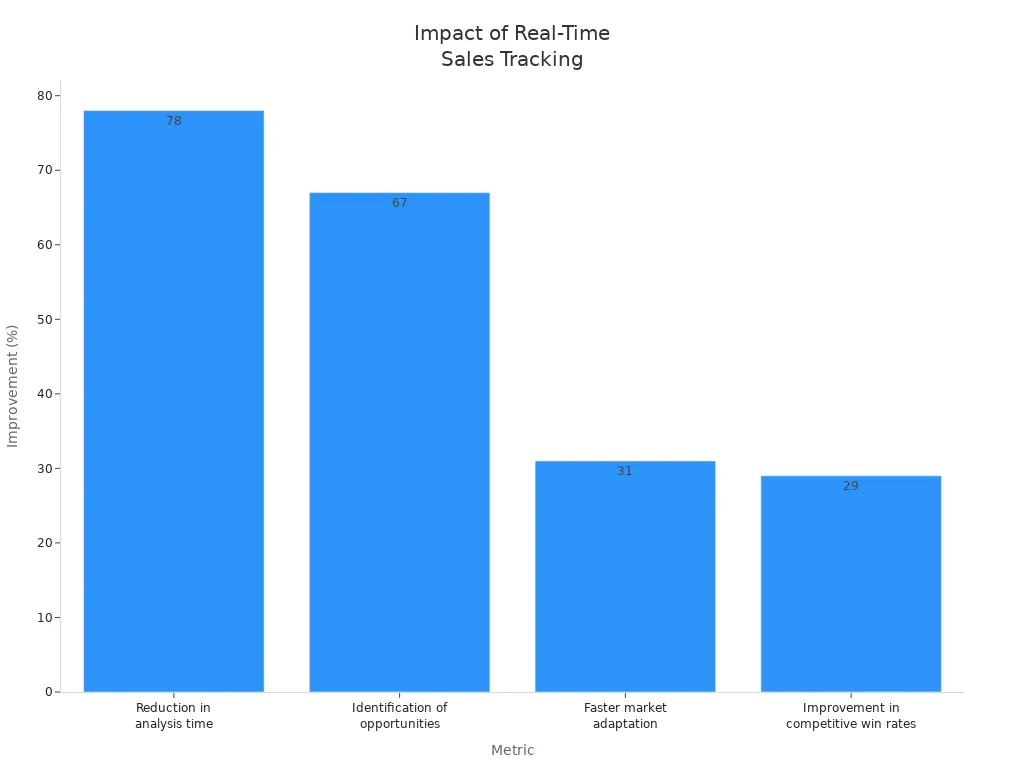
You can see how a sales pipeline dashboard helps you adapt to market changes and close deals more efficiently. Real-time visibility into pipeline movement allows you to detect risks early and take action before problems grow. You shift from reviewing past results to managing current deals, which leads to faster deal closure and better outcomes.
Data-Driven Sales Decisions
You make better decisions when you use data instead of relying on guesswork. A sales pipeline dashboard gives you access to accurate, up-to-date information about your pipeline, leads, and sales performance. You can track key metrics, such as conversion rates and deal values, to understand what works and what needs improvement.
Research shows that 53% of fast-growing sales teams use data to drive their sales strategy. When you use a sales pipeline dashboard, you gain real-time data that enhances your ability to forecast revenue and identify risks. You can see which leads are most likely to convert and which deals need more attention. AI-driven dashboards ensure your data stays clean and consistent, so your revenue projections match your actual pipeline performance.
You also save time with automated reporting. Organizations using well-built sales dashboards reduce reporting time by 31%. Deals supported by AI-driven execution metrics close 11 days faster on average because you can spot risks early and intervene quickly.
- Real-time visibility into pipeline movement and deal progression
- Early detection of risks for timely interventions
- Shift from analyzing past outcomes to managing current deals effectively
FineReport supports your data-driven approach by integrating data from multiple sources and providing interactive dashboards. You can customize your sales pipeline dashboard to focus on the metrics that matter most to your team. FineReport’s manufacturing sales management solution uses the PDCA cycle to help you plan, execute, review, and improve your sales process. This approach ensures you always have the data you need to make informed decisions and drive continuous improvement.

Collaboration and Transparency
A sales pipeline dashboard does more than track numbers. It brings your sales team together by making information visible to everyone. When you share real-time data, you break down information silos and encourage collaboration between sales, marketing, and management. Everyone can see the same pipeline, leads, and performance metrics, which helps align your team toward common goals.
Teams using dashboards achieve their goals twice as fast. Peer-to-peer recognition increases by 40%, and you see less burnout and disengagement. Increased transparency allows your team to communicate better and support each other. You can identify top performers and successful campaigns, making it easier to share best practices and improve overall performance.
FineReport's decision-making platform enhances collaboration by allowing you to set user permissions and manage access to sensitive sales data. You can create role-based dashboards for different team members, ensuring everyone sees the information relevant to their responsibilities. The Kintetsu customer story shows how integrating multiple data sources into a real-time dashboard improved information management and operational efficiency. Sales teams at Kintetsu now access comprehensive customer data, track previous visits, and manage logistics more effectively, leading to better decision-making and streamlined operations.
A sales pipeline dashboard empowers your sales team by providing real-time tracking, supporting data-driven decisions, and fostering collaboration. You gain the tools you need to improve sales team performance metrics, close more deals, and drive growth.
Essential Sales Pipeline Dashboard Metrics and Features
Key Metrics to Track
You need to track the right sales pipeline metrics to predict future revenue and optimize your sales process. Sales pipeline metrics help you understand how deals move through each pipeline stage and where you can improve. The most predictive metrics include opportunity-to-close rate, pipeline coverage ratio, sales velocity, win rate by rep, average deal size, sales stage duration, lead-to-opportunity conversion rate, and deal age. These metrics reveal how efficiently your pipeline converts leads into revenue and highlight bottlenecks that slow down progress.
| Metric | Description |
|---|---|
| Opportunity-to-close rate | Measures the percentage of opportunities that result in closed deals. |
| Pipeline coverage ratio | Compares the total value of opportunities in the pipeline to the sales target. |
| Sales velocity | Indicates how quickly deals are moving through the pipeline. |
| Win rate by rep | Tracks the success rate of individual sales representatives. |
| Average deal size | Calculates the mean value of deals closed, providing insight into revenue potential. |
| Sales stage duration | Measures the time deals spend in each stage of the pipeline, highlighting potential delays. |
| Lead-to-opportunity conversion rate | Assesses the effectiveness of converting leads into opportunities. |
| Deal age | Indicates how long deals have been in the pipeline, which can signal potential issues. |
You analyze conversion rates to see where leads stall and use deal stage metrics to coach your team. Improving sales through metrics like these helps you forecast revenue and adjust strategies proactively.
Customization and Mobile Access with FineReport
FineReport gives you powerful customization options for your sales pipeline dashboard. You can set chart styles, adjust titles, legends, labels, and axes. Special effects like animation, chart zoom, and custom display conditions make your dashboard interactive and engaging. You use features such as monitor refresh, drill-down, and custom category colors to highlight important pipeline data.
Mobile BI lets you access your sales pipeline dashboard on any device. You monitor pipeline health, review sales pipeline metrics, and track revenue trends wherever you are. FineReport’s mobile dashboard ensures you stay connected to your sales data, making quick decisions and responding to changes in real time.

Use Cases and Success Stories
Organizations use sales pipeline dashboards to identify bottlenecks and improve pipeline management. You see visual insights into deal flow, spot where deals get stuck, and compare stage durations to find delays. Sales managers coach reps based on real deal performance, while marketing teams align content with sales efforts to drive revenue. For example, companies using FineReport’s dashboards have improved operational efficiency and gained better visibility into customer data. Kintetsu World Express integrated multiple data sources, enabling their sales teams to manage customer interactions and logistics more effectively, resulting in streamlined operations and increased revenue.

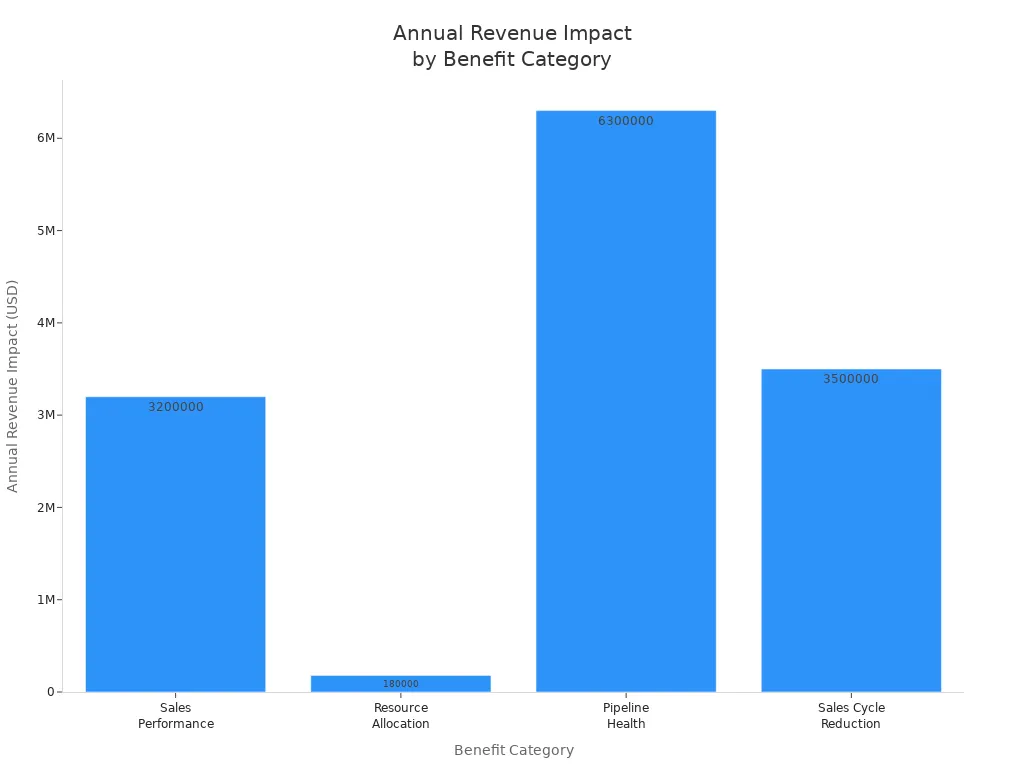
You gain measurable benefits when you use a sales pipeline dashboard. Sales teams report faster sales cycles, improved pipeline health, and stronger revenue growth. The table below shows how sales performance and revenue growth increase after adopting a dashboard.
| Benefit Category | Before | After | Impact | Value |
|---|---|---|---|---|
| Sales Performance | No visibility into top/bottom performers | Real-time leaderboard drives competition | Bottom quartile performance up 18% | Additional $3.2M closed from improved performance |
| Resource Allocation | Marketing budget split evenly across products | 50% to SAAS, 30% Services, 20% Custom | Lead quality up 25%, cost per acquisition down 15% | $180K annual marketing efficiency gain |
| Pipeline Health | 60-65% of leads in "potential" limbo | Implemented 90-day rule, moved 20% to closed/lost | Conversion rate improved from 20% to 24% | +$6.3M annual revenue (4% × $158M pipeline) |
| Sales Cycle Reduction | Average 10.5 weeks to close | Best practices sharing reduced to 9.2 weeks | 12% faster closes = 12% more deals per year | +$3.5M annual revenue (73 additional deals) |
| Total Measurable Impact | N/A | N/A | Revenue Impact: +$12.8M annually (+8% growth) | Cost Savings: $220K annually (ops time + marketing efficiency) |
FineReport supports your sales management and drives continuous improvement. You can achieve revenue growth and sustainable growth by following these steps:
- Complete maturity assessment of your current sales process.
- Align stakeholders and secure sponsorship for sales dashboard adoption.
- Evaluate technology options and run proof-of-concept projects.
Explore FineReport to unlock new sales opportunities, accelerate revenue growth, and drive your team’s growth.

Continue Reading About Sales Pipeline Dashboard
Best Dashboard Apps for Business Insights
What is a Call Center Dashboard and Why Does It Matter
What is a Reporting Dashboard and How Does it Work
What is An Interactive Dashboard and How Does It Work
What is a Call Center Metrics Dashboard and How Does It Work


FAQ

The Author
Lewis
Senior Data Analyst at FanRuan
Related Articles

How to Build an Investment Portfolio Reporting Dashboard for Executives: KPIs, Benchmarks, and Drill-Down Views
Investment portfolio reporting for executives is not about showing every holding, transaction, and chart your investment team can produce. It is about giving CEOs, CFOs, CIOs, boards, and investment committees a fast, re
Yida YIn
Jun 25, 2026

12 KPI Reporting Examples for Executive Dashboards: What to Show in Weekly, Monthly, and Quarterly Reviews
Executive leaders do not need more data. They need decision ready $1 examples that match how often they review the business and what actions they are expected to take. A weekly $1 should surface fast moving risks and per
Yida YIn
Jun 25, 2026

How to Build a Digital Marketing Reports Dashboard: Executive Examples, KPIs, and Templates
A $1 is the control layer that helps executives and marketing leaders turn scattered channel data into fast, confident decisions. If you are a CEO, CMO, operations director, or marketing analytics lead, the real problem
Yida Yin
May 07, 2026