CFOs do not need more reports. They need faster visibility into cash risk, collection delays, payment pressure, and forecast gaps before those issues hit liquidity. That is why the top accounting dashboard features are not just about cleaner visuals. They are about turning fragmented finance data into decisions that protect working capital, improve planning confidence, and support operational agility.
If your finance team is still switching between ERP exports, bank portals, aging reports, and spreadsheet forecasts, cash visibility is delayed by design. A well-built accounting dashboard solves that by bringing critical indicators into one decision layer. For CFOs, controllers, and finance leaders, the business value is straightforward: earlier intervention, better allocation of cash, and less reliance on backward-looking reporting.
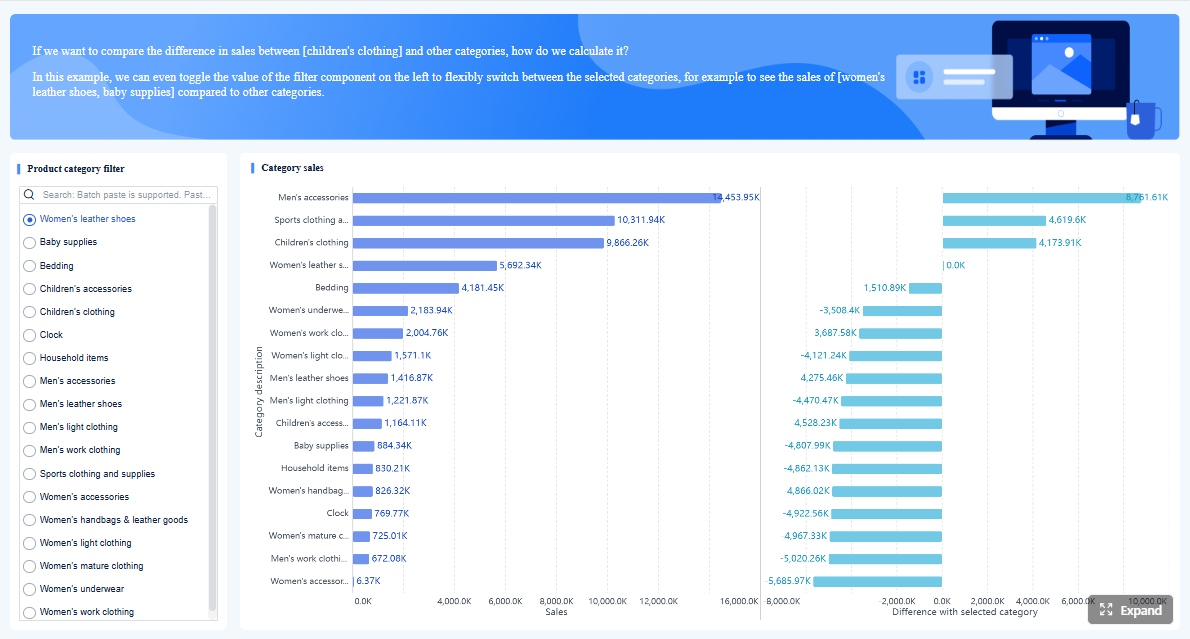
The difference between a useful dashboard and a low-value one is simple. A useful dashboard answers urgent business questions immediately:
How much usable cash do we have today?
What collections are slipping?
What payments are coming due?
Are operations generating cash or consuming it?
How accurate is our cash forecast?
What happens if inflows slow down next month?
A visually appealing dashboard that cannot answer those questions is not a finance tool. It is a presentation layer.
Click To Try The Dashboard
Why Top Accounting Dashboard Features Matter for CFOs
For CFOs, dashboard design directly affects the speed and quality of financial decisions. When core metrics are buried across disconnected reports, teams react late. When the dashboard surfaces the right KPIs with the right context, leaders can identify risk earlier and act while options still exist.
This matters most in cash management. Cash flow pressure rarely appears all at once. It builds through smaller signals:
collections slowing in one customer segment
vendor obligations clustering in the same week
forecasts repeatedly overstating inflows
rising burn without corresponding operating cash generation
Without a KPI framework, finance teams end up managing exceptions manually. They spend more time reconciling numbers than using them. A modern accounting dashboard should replace fragmented reporting with a structured operating view that connects liquidity, working capital, forecast performance, and scenario planning.
The 9 KPI Essentials That Strengthen Cash Flow Visibility
Cash Position and Daily Liquidity
Every CFO dashboard should start with a single source of truth for current liquidity. This means showing:
available cash
restricted cash
undrawn facilities if relevant
short-term obligations due within the next few days or weeks
The value here is immediate. A dashboard that combines cash balances with near-term obligations helps finance leaders understand not just how much cash exists, but how much is actually usable. That distinction is critical when making payroll, supplier, debt, or investment decisions.
Real-time liquidity tracking reduces avoidable shortfalls because it highlights pressure before it becomes a crisis. If cash balances look healthy but committed outflows spike next week, the dashboard should make that visible today.
Cash Inflow and Revenue Collection Trends
Collections are one of the earliest indicators of future cash strain. CFOs need to track incoming receipts by source, timing, and reliability. That means segmenting inflows by:
customer group
product line
geography
channel
expected versus actual receipt timing
The dashboard should reveal whether cash collections are consistent or increasingly volatile. A revenue figure may look strong on paper, but if receipts lag forecast, treasury decisions become more difficult and risk increases.
Comparing actual collections against forecasted inflows is especially important. It helps finance teams identify pattern breaks early, such as chronic overestimation in specific accounts or delayed remittances in certain business units.
Accounts Receivable Performance
AR performance remains one of the most important indicators in any list of top accounting dashboard features. If receivables weaken, working capital tightens quickly.
The dashboard should monitor:
aging buckets
DSO
overdue balances
concentration of late payments by customer
trends in disputed invoices or collection holds
These KPIs help CFOs detect collection issues before they damage liquidity. For example, rising overdue balances may signal sales terms deterioration, credit quality problems, billing errors, or under-resourced collections processes.
A high-value dashboard does not just show totals. It shows movement. Is the 60+ day bucket growing? Are a few customers driving most of the aging risk? Are overdue balances concentrated in one region or business line?
Accounts Payable and Cash Commitments
Strong cash management requires more than collection visibility. CFOs also need a clear view of payment obligations, due dates, and concentration risk across suppliers.
A dashboard should display:
upcoming payables by due date
critical vendor obligations
early payment discount opportunities
concentration of spend across top vendors
recurring commitments and one-time spikes
This allows finance leaders to preserve cash without damaging supplier relationships. Payment scheduling is not just a treasury function; it is a strategic lever. The right dashboard helps teams decide when to accelerate, hold, or renegotiate outflows based on current liquidity and business priorities.
Operating Cash Flow and Burn Rate
Profitability does not guarantee liquidity. That is why operating cash flow must be visible separately from accounting profit. CFOs need to know whether the business is generating enough cash from operations to support growth, debt service, and day-to-day obligations.
A dashboard should track:
operating cash inflows and outflows
trend direction over time
cash generation by business segment where possible
burn rate on a monthly or weekly basis
Burn rate is particularly important during expansion, turnaround periods, or funding constraints. If the business is consuming cash faster than expected, leadership needs a clear runway view. This supports practical decisions on hiring pace, cost controls, capital spending, and financing timing.
Forecast Accuracy and Variance Tracking
Cash forecasting loses credibility when variances repeat without explanation. CFOs need a dashboard that compares projected cash outcomes against actual performance and isolates the drivers behind the gap.
This should include:
forecast versus actual cash position
forecast versus actual inflows
forecast versus actual outflows
variance by business unit, account category, or period
recurring sources of forecast error
This KPI area improves planning discipline. When teams can see which assumptions consistently fail, they can adjust methodology, improve input quality, and build more reliable cash forecasts. Better forecast accuracy leads directly to better capital decisions.
Working Capital Efficiency
Cash visibility improves when CFOs can connect receivables, payables, and inventory behavior into one working capital view. Looking at each metric separately is useful, but the real insight comes from understanding how they interact.
A dashboard should help finance teams assess:
whether receivables are stretching
whether payables strategy is aligned with cash preservation goals
whether inventory levels are tying up excess liquidity
whether cycle times are improving or deteriorating
Trend analysis is essential here. Working capital inefficiencies often emerge gradually and become normalized unless the dashboard makes them obvious. A CFO needs to see whether more cash is trapped in the operating cycle than necessary.
Profitability Versus Cash Reality
One of the most dangerous finance mistakes is assuming that accounting profit reflects cash strength. It does not. Accrual-based performance can look healthy while cash remains tight due to collections delays, inventory build-up, or heavy payment obligations.
A strong dashboard should distinguish clearly between:
reported profit
operating cash flow
free cash available for near-term use
non-cash accounting impacts
This helps prevent misleading decisions. Without this separation, leadership may approve investments, distributions, or spending increases based on earnings that have not translated into available cash.
Scenario Planning and Forward Visibility
A dashboard built only for historical reporting is incomplete. CFOs need to understand future cash exposure under changing conditions. Scenario planning turns the dashboard into a decision instrument rather than a passive monitor.
The dashboard should support:
best-case cash position
expected cash position
downside cash position
collection slowdown scenarios
expense surge scenarios
delayed funding or reduced demand scenarios
This forward visibility is essential during volatility, rapid growth, seasonal swings, or financing constraints. When scenarios are integrated into the dashboard, finance leaders can make faster, more confident decisions about credit lines, payment timing, hiring, and capital allocation.
Dashboard Features That Make These KPIs Actionable
The KPIs are only as useful as the features that support them. This is where the top accounting dashboard features become operationally meaningful.
Real-Time Data Integration
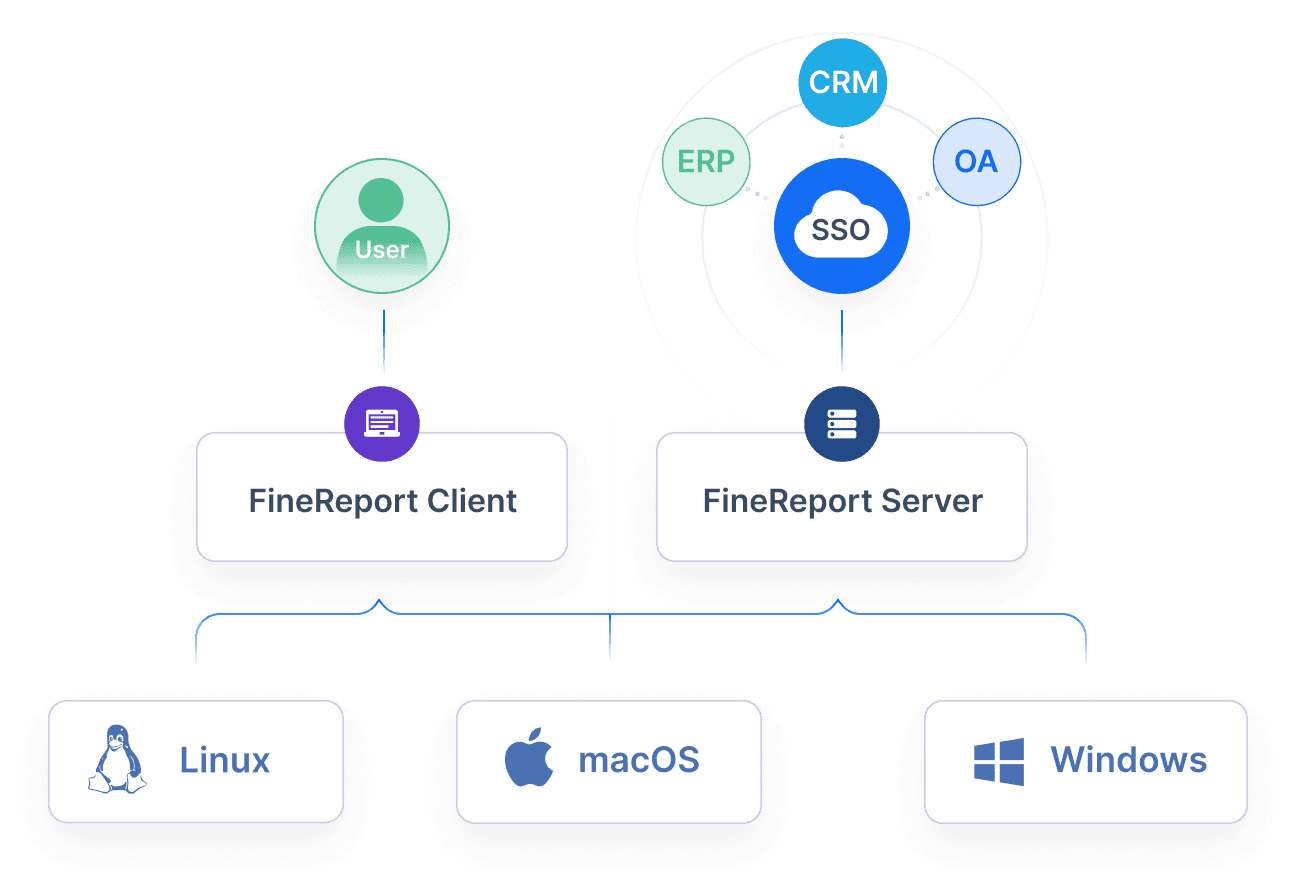
Finance teams lose time and confidence when data must be manually exported from ERP, banking, billing, and accounting systems before analysis can begin. A modern dashboard should unify these sources automatically.
Real-time or near-real-time integration helps CFOs:
reduce reconciliation delays
spot cash changes faster
eliminate spreadsheet bottlenecks
improve confidence in the numbers used for decisions
This is one of the highest-impact features because outdated cash data creates false certainty. In volatile environments, even a short delay can distort payment decisions or liquidity planning.
Custom Alerts and Exception Monitoring
Executives should not have to search for problems. The dashboard should identify them automatically. Custom alerts allow finance teams to focus on action rather than surveillance.
Useful alerts include:
missed collection targets
sudden drops in cash balances
overdue receivables crossing thresholds
large payments due within a defined window
forecast variance outside accepted tolerance
concentration risk increasing with a single vendor or customer
This keeps the dashboard proactive. Instead of reviewing static reports after the fact, finance leaders are prompted when intervention is required.
Drill-Down Reporting and Role-Based Views
CFOs need summary visibility, but they also need immediate access to detail when a number moves unexpectedly. That is why drill-down reporting is essential.
A good dashboard allows users to move from:
consolidated cash position
to business unit or account category
to invoice, payment, or transaction-level detail
Role-based views are equally important. CFOs, controllers, treasury teams, and finance managers do not all need the same dashboard. Executives need strategic summaries. Controllers may need aging and close-related detail. Treasury teams may focus on daily liquidity and commitments. Tailoring views improves adoption without duplicating report logic.
Interpretability also matters. A dashboard should be scannable in minutes. The best design choices reduce noise, clarify trends, and guide action. If users need a long explanation to understand what they are seeing, the dashboard is too complex.
Flexibility is another major evaluation point. As the business grows, enters new markets, changes systems, or adds legal entities, the dashboard should adapt without a full rebuild. CFOs should also ask whether the dashboard improves collaboration across finance and operations. Cash performance is not controlled by finance alone. Collections, procurement, sales, and operations all influence outcomes.
4 Best Practices for CFO Dashboard Implementation
If you are building or redesigning a cash-focused dashboard, follow these practical steps:
Start with decisions, not metrics.
Define the operational decisions the dashboard must support first, such as payment prioritization, forecast adjustment, or collection escalation. Then choose KPIs that directly enable those decisions.
Standardize KPI definitions across teams.
Align finance, treasury, accounting, and operations on definitions for cash position, overdue balance, forecast variance, and working capital metrics. Inconsistent definitions create confusion and destroy trust.
Design for exceptions and trend shifts.
Build visual logic that highlights changes requiring action, not just current balances. Thresholds, variance markers, and trend indicators make the dashboard far more useful than static totals alone.
Review and refine monthly.
Dashboard usefulness changes as business conditions change. Hold a regular review to remove low-value metrics, add leading indicators, and refine layout based on executive usage patterns.
Common Dashboard Mistakes That Reduce Cash Flow Visibility
Many dashboards fail because they try to do too much at once. The most common mistake is overloading the screen with metrics that compete for attention. When everything is important, nothing stands out.
Other common issues include:
Too many lagging indicators: Historical performance matters, but CFOs also need forward-looking signals such as scenario outcomes, projected shortfalls, and collection risk trends.
Inconsistent data definitions: If departments calculate receivables, cash commitments, or forecast variance differently, the dashboard becomes a source of disagreement instead of alignment.
Weak ownership: A dashboard should not just show problems; it should support action. Metrics need owners, escalation paths, and operational next steps.
Poor integration: Manual data consolidation introduces delays and errors that undermine confidence in dashboard output.
No drill-down capability: High-level summaries without traceable detail force teams back into spreadsheets and side reports.
The result of these mistakes is predictable: slower response, lower trust, and reduced cash visibility exactly when leadership needs it most.
Conclusion: Build a Dashboard That Supports Better Cash Decisions
The best accounting dashboards help CFOs move from passive reporting to proactive cash management. They do not just summarize performance. They expose liquidity pressure early, clarify what is driving change, and support faster decisions across collections, payments, forecasting, and working capital management.
forward visibility that improves planning under uncertainty
Building this manually is complex; use FineReport to utilize ready-made templates and automate this entire workflow. Instead of stitching together ERP exports, bank files, and spreadsheet logic, finance teams can use FineReport to integrate data sources, create role-based dashboards, enable drill-down analysis, and monitor cash KPIs in real time. For CFOs who want more than static reports, FineReport provides a faster path to a dashboard that strengthens control, improves forecast confidence, and makes cash visibility operational.
FAQs
The most important features are real-time cash visibility, collections and payable tracking, forecast variance monitoring, working capital KPIs, and drill-down analysis. Together, they help CFOs spot liquidity risk early and make faster decisions.
Cash flow visibility helps finance leaders see usable cash, upcoming obligations, and forecast gaps before they become problems. This supports better planning, stronger working capital control, and quicker intervention.
Key KPIs include cash position, daily liquidity ratio, DSO, overdue receivables, payment commitments, operating cash flow, burn rate, forecast variance, and working capital days. These metrics give a clear view of short-term liquidity and overall cash performance.
A good dashboard compares projected cash inflows and outflows against actual results on an ongoing basis. This helps finance teams identify recurring errors, improve forecast accuracy, and prepare for different cash scenarios.
A useful dashboard answers urgent finance questions immediately and connects KPIs to actions. It should highlight exceptions, show trends, and let users drill down into the drivers behind changes in cash flow.
Product Trial
FineReport
Pixel-perfect reports · Interactive dashboards · Easy data entry · Digital twins