An accounting dashboard gives you a clear view of your company’s finances in one place. You see key numbers, spot trends, and catch problems before they grow. With up-to-date data, you make quick, smart choices that keep your business on track. Real-time dashboards let you respond to market shifts, manage risks, and stay ahead of competitors. FineReport puts these powerful tools in your hands, making financial management simple and accessible for any business.
What Is an Accounting Dashboard?
An accounting dashboard is a visual tool that brings together real-time financial data, showing you key metrics, trends, and performance indicators in one place so you can understand your business finances quickly and make informed decisions.
Key Components
You will find that an accounting dashboard includes several important parts. Each type of dashboard focuses on different financial needs. The table below shows common dashboard types and their main components:
| Dashboard Type | Key Components |
|---|---|
| Cash Flow Dashboard | Net cash flow, Operating cash flow, Cash inflows and outflows breakdown, Free cash flow, Cash flow forecast, Cash reserves visualization |
| Sales and Marketing Financial Dashboard | Revenue and sales growth, Customer acquisition cost, Marketing ROI, Conversion rates, Customer lifetime value, Customer retention rate |
| Financial Reporting Dashboard | Revenue by division, Revenue vs. operating margin, Detailed expense breakdowns, Balance sheet summary, Cash flow statement, Customizable report templates |
| Actual vs. Forecast Expense Dashboard | Comparison of actual vs. forecast expenses, Breakdown by expense type, Trend analysis, Variance explanations, Budget adjustment recommendations |
| Risk-Adjusted Performance Dashboard | Current exposure and utilization, Return on equity and assets, Risk-adjusted return on capital, Value at Risk metrics, Performance by region, industry, and customer segment, Risk appetite and tolerance indicators |

You can use these components to track cash flow, monitor sales, compare actual and forecasted expenses, and manage risk. This helps you see the full picture of your business finances.
FineReport makes building your accounting dashboard easy. You can use its drag-and-drop interface to add charts, tables, and graphs. You do not need to write code. FineReport connects with many business systems and databases, so you can bring all your accounting data together. You can deploy FineReport as a web application and access your dashboard from any device. It also supports single sign-on, making it simple to manage user accounts.

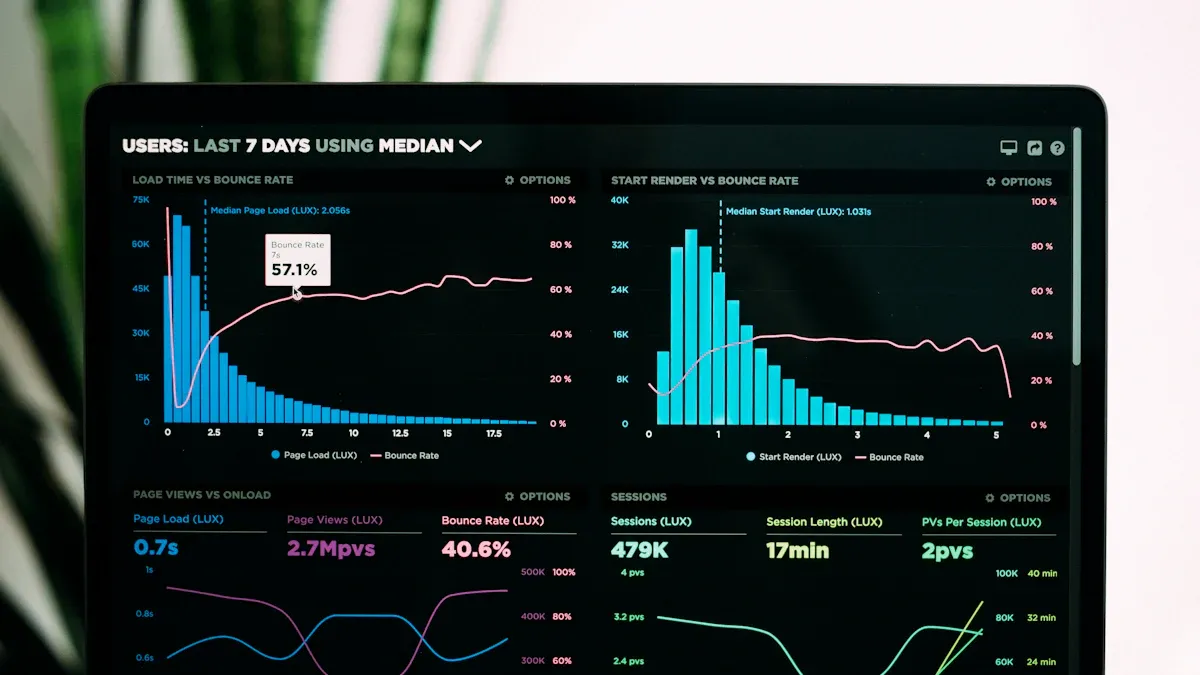
Data Visualization
Data visualization is a key part of any accounting dashboard. It helps you see patterns and trends in your financial data. Here is how visualization improves your accounting:
- You can spot trends and identify patterns, which makes your financial reporting more accurate.
- Visual tools help you track changes over time and catch any irregularities.
- Charts and graphs make complex data easy to understand, so you can make better decisions.
- You get key insights at a glance, which saves you time and helps you focus on what matters.
When you use FineReport, you can create dashboards with interactive charts and graphs. This makes your accounting data clear and easy to explore. You can customize your dashboard to show the metrics that matter most to you.

Why Use an Accounting Dashboard?
You need clear, reliable financial information to run your business well. An accounting dashboard gives you instant access to the numbers that matter most. You see trends, spot risks, and act quickly. FineReport helps you automate reporting, connect different data sources, and view your dashboard on any device. Let’s explore the main benefits.
Real-Time Insights
You want to know what is happening in your business right now. Real-time insights let you track cash flow, expenses, and revenue as they change. When you use an accounting dashboard, you see up-to-date data without waiting for manual updates. This helps you catch problems early and avoid costly mistakes.
Real-time dashboards improve financial accuracy. When you enter data, the system checks for errors and keeps your records clean. You avoid last-minute corrections and unreliable reports. Continuous updates allow you to spot exceptions and fix them before they grow. Automated dashboards shift your financial management from reactive to proactive, reducing the risk of errors.
Better Decisions
You make better decisions when you have all the facts. An accounting dashboard brings together financial data from different sources, giving you a complete view of your business. You see performance metrics, cost trends, and forecasts in one place.
Managers use dashboards to act quickly on financial trends and risks. You get a unified view of your company’s performance, which helps you make accurate choices. Cost management insights show where you can save money and align spending with your goals. Improved forecasting helps you plan for the future and allocate resources wisely. When you see key performance indicators clearly, you know where to focus your efforts.
Here are some ways dashboards support decision-making:
- Real-time decision support helps you act fast.
- Data consolidation ensures you have accurate information.
- Cost management insights reveal inefficiencies.
- Improved forecasting guides strategic planning.
- Enhanced visibility of KPIs helps you set priorities.
- Accountability and transparency keep your team on track.
| Benefit | Description |
|---|---|
| Visualized financial data | Dashboards provide a clear view of financial data, helping to understand the current state and predict future trends. |
| Improved decision-making | Real-time access to integrated data allows for informed business decisions, enhancing profitability and productivity. |
| Customization and adaptability | Dashboards can be tailored to specific workflows and can include new metrics or KPIs as business needs change. |
| Automation of processes | Automating repetitive tasks reduces manual errors and increases efficiency in accounting processes. |
Efficiency Gains
You save time and reduce errors when you use automated accounting dashboards. FineReport lets you automate report generation and distribution, so you spend less time on manual tasks. You can connect multiple data sources, which means you do not have to copy and paste information between systems.
Dashboards consolidate key financial data into one platform. You make decisions faster and with more confidence. You see operational performance clearly, so you know what works and what needs improvement. Customized views let you focus on the metrics that matter to you, improving accountability and strategic planning.
- Dashboards provide real-time data visualization for quick decision-making.
- You can customize views based on user roles, making relevant metrics easy to find.
- Monitoring and analyzing important data helps you allocate resources effectively.
- Enhanced reporting and analysis capabilities help you spot trends and act before problems grow.
- Automated accounting systems enable timely decision-making, reducing the risk of financial losses.
FineReport supports mobile access, so you can check your dashboard from your phone or tablet. You stay connected to your business wherever you are. Automation, integration, and mobile access work together to boost your efficiency and help you reach your goals.

Essential Features of FineReport Dashboards
FineReport gives you powerful tools to manage your accounting with ease. You can connect data from many sources, design custom layouts, and use advanced visualizations. These features help you see the big picture and focus on what matters most.
Cash Flow Tracking
You need to know where your money comes from and where it goes. FineReport lets you track cash flow in real time. You can combine data from different banks, sales systems, and expense records with just one click. This makes it easy to spot trends and manage your cash position. Automated features help you prepare financial statements quickly and accurately. You save time and reduce mistakes.

Expense Monitoring
Keeping an eye on expenses is key to healthy accounting. FineReport gives you real-time updates and detailed analysis of your spending. The drag-and-drop report design makes it simple to build reports. Advanced charting options let you see spending patterns at a glance. You can use the user-friendly interface to explore data and find areas to cut costs. Mobile access means you can check expenses from anywhere, even when you are not in the office.
- Drag-and-drop report design
- Advanced charting options
- Simplified learning process for users
Custom Reports
Every business has unique needs. FineReport lets you create custom reports that fit your workflow. You can use remote design, template assistants, and dynamic HTML5 charts. The system supports aggregation reports, deep data analysis, and accurate printing or exporting. You can even design Word-like reports with dynamic elements. Importing data from Excel is easy, so you can keep your accounting records up to date.
| Customization Option | Description |
|---|---|
| Remote Design | Create and modify report templates from anywhere. |
| Template Assistant | Get reminders to reduce errors during report creation. |
| Dynamic HTML5 Chart | Build interactive charts with animations. |
| Aggregation Report | Combine different report elements on one canvas. |
| Data Analysis | Re-analyze data on the current page without reconnecting. |
| Print/Export | Print or export reports in PDF, Excel, or Word formats. |
| Word Report | Design reports that look like Word documents with dynamic data. |
| Data Entry | Enter data into multiple tables and databases. |
| Multi-Level Data Reporting | Support complex reporting processes and notifications. |
| Excel Import | Import data from Excel to keep records current. |
![]()
FineReport also supports 3D visualizations. These make your accounting data more engaging and easier to understand. Automated scheduling sends reports to your team on time. Mobile dashboards let you view revenue trends and projections wherever you are. You stay connected and in control.
Accounting Dashboard for Business Success
Solving Common Problems
You face many challenges in accounting, but an accounting dashboard helps you solve them quickly. You can monitor cash flow to make sure you have enough funds for daily needs. You manage debt more effectively by tracking balances and payments. Tax compliance becomes easier because the dashboard automates calculations and reminders, reducing your workload. You also optimize your processes by improving efficiency in reporting and analysis. With these tools, you avoid common mistakes and keep your finances healthy.
- Cash flow monitoring keeps your business running smoothly.
- Managing debt helps you stay financially stable.
- Tax compliance reduces stress during tax season.
- Optimizing processes saves you time and effort.
Achieving Financial Goals
You want to reach your financial targets, and a dashboard gives you the tools to do it. First, you monitor performance and spot trends, which helps you make smart choices for cost reduction or revenue growth. You improve budgeting by using real-time insights to adjust your plans and find ways to save money. Data-driven decisions become easier because you can quickly analyze financial metrics. You track cash flow to address issues before they become problems. By consolidating information, you manage your finances more effectively and spend less time on routine tasks.
- Monitor performance and identify trends for better decisions.
- Improve budgeting and planning with up-to-date data.
- Make data-driven choices for investments and growth.
- Track cash flow to stay ahead of issues.
- Manage finances efficiently with all data in one place.
Real-World Use Cases
Many companies have improved their business performance with FineReport dashboards. In the telecommunications industry, businesses like AT&T and Vodafone use dashboards to gain insights into customer management, finance, and operations. BGL Life increased its efficiency by using a dashboard to detect issues quickly and make agile decisions. FineReport also supports financial management and budget control in industries like manufacturing and finance. You can see how dashboards help you make informed decisions and drive success in any field.

Choosing and Using an Accounting Dashboard
Selecting the Right Tool
Choosing the right accounting solution can shape your business success. You want a tool that fits your needs and grows with you. Start by looking at these important criteria:
| Criteria | Description |
|---|---|
| Mobile Optimization | Access your metrics anytime, anywhere, even when you are on the move. |
| Appropriate Chart Types | Use different visualizations to make your data clear and actionable. |
| Alignment with Business Goals | Make sure the tool supports your specific goals and priorities. |
| Inclusion of Key Metrics | Focus on the numbers that matter most, like sales growth or customer service. |
Integration capability is also essential. When your dashboard connects with other systems, you get accurate data without manual entry. This reduces errors and lets your team focus on important tasks. Real-time syncing keeps your financial workflows smooth and up to date.
Maximizing Value
Once you select your accounting dashboard, you want to get the most from it. FineReport makes it easy to get started. You can connect multiple data sources, design custom reports, and automate routine tasks. To maximize value, follow these best practices:
| Best Practice | Description |
|---|---|
| Automate whenever possible | Use automation to connect data, share reports, and monitor KPIs without manual updates. |
| Keep it simple | Focus on a few key indicators to avoid clutter and confusion. |
| Tell a comprehensive story | Include sales, marketing, and operational data for a full business picture. |
| Keep your audience in mind | Customize dashboards for different users so everyone gets the information they need. |
You should review your dashboard regularly. Update your key metrics as your business changes. Train your team to use the features and encourage feedback. With these steps, you turn your accounting data into clear insights that drive better decisions.
An accounting dashboard gives you a real-time, clear view of your finances. You make faster, smarter decisions and reduce errors. See the main benefits below:
| Benefit | Description |
|---|---|
| Decision-Making Efficiency | Make choices based on real-time data, not outdated reports. |
| KPI Monitoring | Track spending and cash flow against your goals. |
| Error Reduction | Rely less on manual entry, improving accuracy. |
With tools like FineReport, you spot trends, monitor key indicators, and act quickly. Start by identifying your key metrics, gathering your data, choosing a dashboard platform, designing your layout, and building your dashboard. Explore these solutions to boost your business performance.
Continue Reading About Accounting Dashboard
Top Finance Dashboard Examples Every Company Needs in 2026
Empower Your Business: Best Financial Reporting Tools 2025
7 Must-See Financial Dashboards for Modern Companies


FAQ

The Author
Lewis
Senior Data Analyst at FanRuan
Related Articles

How to Build an Investment Portfolio Reporting Dashboard for Executives: KPIs, Benchmarks, and Drill-Down Views
Investment portfolio reporting for executives is not about showing every holding, transaction, and chart your investment team can produce. It is about giving CEOs, CFOs, CIOs, boards, and investment committees a fast, re
Yida YIn
Jun 25, 2026

12 KPI Reporting Examples for Executive Dashboards: What to Show in Weekly, Monthly, and Quarterly Reviews
Executive leaders do not need more data. They need decision ready $1 examples that match how often they review the business and what actions they are expected to take. A weekly $1 should surface fast moving risks and per
Yida YIn
Jun 25, 2026

How to Build a Digital Marketing Reports Dashboard: Executive Examples, KPIs, and Templates
A $1 is the control layer that helps executives and marketing leaders turn scattered channel data into fast, confident decisions. If you are a CEO, CMO, operations director, or marketing analytics lead, the real problem
Yida Yin
May 07, 2026